Using Image Processing To Measurement of
Grinding Wheel Loading
1
Tilottama A. Chaudhari,
2Er Navneet K. Patil ,
3Jagruti R Surange
P.G. Student, Department of Mechanical Engineering, S.S.B.T‘s, C.O.E.T., Bambhori, Jalgaon,
Maharashtra India
1Associate Professor, Department of Mechanical Engineering, S.S.B.T‘s, C.O.E.T., Bambhori, Jalgaon,
Maharashtra, India
2Assistant professor,
Department of Mechanical Engineering, S.S.B.T‘s, C.O.E.T., Bambhori, Jalgaon,Maharashtra, India
3ABSTRACT: Wheel surface condition plays an important role in the grinding operation. Wheel loading which is chip accumulation in the space between grains leads to the deterioration of wheel cutting ability and causes excessive force and temperature. Identification of wheel loading is an important issue for optimizing the dressing intervals but it can be a time consuming and an expensive process.This study aims at developing a non-contact method for measuring the grinding wheel loading and thereby determining the optimum dressing intervals. This paper presents a systematic process for measuring the wheel loading. The images of the grinding wheel had been taken using a digital camera. These images had been transferred to the computer and are processed for determining the percentage of loading. The image toolbox of MATLAB had been used for image processing. Global thresholding technique had been used to differentiate the loaded portion of the wheel from rest of the wheel. Experiments were conducted on Mild Steel. Experimental results are presented which show the ability of using machine vision system in the online monitoring of the grinding wheel loading.
KEYWORDS: Grinding Wheel, Machine Vision, Image Processing, Global Thresholding, Wheel Loading.
I. INTRODUCTION
Grinding is an abrasive machining process which can produce very fine surface finishes. The removed chips from the work piece which get welded to the porosities between the abrasive grains can adversely affect the final surface finish of the machined component. The abrasive particles present on the surface of the grinding wheel are responsible for producing fine surface finishes on the work piece. During the grinding process, the removed chips from the work piece get accumulated to the porosities between the abrasives, which is called as wheel loading. Cutting force and temperature increase with wheel loading which in turn accelerate the wear of the grinding wheel. As a whole, the surface finish of the work piece deteriorates. In order to attain the original cutting capability of the wheel, it is necessary to carry out the dressing operation. Since the wheel dressing is a time consuming process, it is necessary to optimize the wheel dressing intervals. Therefore monitoring the condition of the grinding wheel for wheel dressing has got its significance.
When the loading and wear is severe, dressing of grinding wheel has to be carried out in order to bring the wheel to its best state. Determining the timing to dress the grinding wheel is extremely important in order to prevent flaws in products. Nowadays in industrial applications experience of the skilled operator plays a major role in determining the dressing interval. Therefore monitoring the grinding process for wheel loading and wheel wear is critical to ensure the surface quality of the machined component as well as the efficiency of the grinding process.
II. LITERATURE REVIEW
Nakai et al. measured the wear of the grinding wheel using intelligent systems composed of four Types of neural networks. Acoustic emission and cutting power signals were acquired and tool wear was measured by imprint method throughout the tests [6].
Narayanaperumal et al. evaluated the working surface of the grinding wheel using speckle image analysis. A simple speckle imaging arrangement was fabricated and fitted into the grinding machine to capture the images of the grinding wheel and speckle image intensity distribution captured the changes in the grinding wheel surface condition. The image processing techniques, including segmentation and blob analyses were able to extract the cutting edge density, width, spacing and protrusion height from the surface topography measurements [6].
Chang et al. measured the characteristic parameters of form grinding wheels used for micro drill fluting by computer vision system. The edge detection, the straight line detection, the contour separation, the circular arc fitting, and the circular arc angle evaluation were the five sequential steps used for the measurement [7].
Warren Liao et al. used acoustic emission signals for the condition monitoring of grinding process. AE signals were collected when the wheel was sharp and when the wheel was dull. Discrete wavelet decomposition procedure was used to extract discriminate features [2].
Mokbel et al. used AE signals for monitoring the condition of diamond grinding wheels .An acoustic emission sensor was attached to the mild steel specimens and raw AE signals generated from the grinding wheel/specimen contact were then analysed using a fast Fourier transform [3].
Lezanski et al. monitored the condition of grinding wheel based on neural network and fuzzy logic based system. For each measuring signal, a few statistical and spectral features were calculated and used as input for data selection and classification procedures.
Vipin Gopan, Leo Dev Wins K “Quantitative Analysis of Grinding Wheel Loading Using Image Processing” Quantitative analysis of wheel loading can provide information about the cutting conditions of the wheel. With the development in the field of machine vision and image. processing, this study focuses on developing a system for the quantitative assessment of wheel loading using image capturing and image processing.
Hamed Adibi, S. M. Rezaei, Ahmed A. D. Sarhan “Grinding Wheel Loading Evaluation Using Digital Image Processing” A novel technique based on digital image processing to determine the loading areas over the surface of CBN vitrified grinding wheels using the toolbox of MATLAB is presented in this paper Experiments were performed to examine the repeatability of the proposed technique. The results were verified by the use of a scanning electron microscope. Based on the proposed technique, the effects of cutting parameters on the loaded area to wheel surface ratio in relation to grinding performance were studied empirically.
K.C.Fan et al. measures the wear of grinding wheel using binarisation technique for image processing and the image is analysed using a derived edge detection algorithm to determine the spatial coordinates of the grinding wheel edge curvature [10].
Lachance et al. measured the grinding wheel wear using machine vision system. Binary segmentation technique was used for image processing
Fan et al. measured the wear of the grinding wheel using computer vision system. Binarisation technique was used for image processing and ‘mapping function method’ was used to transform an image pixel coordinate to a space coordinate [10].
Lachance et al used image processing for the measurement of wear flat area of grinding wheels (Lachance et al., 2004). This method was developed with a new technique called region growing as a supplementary solution for the detection of wear flat areas. Although, scanning electron microscope (SEM) is one of the best ways for observation of wheel surface but it is very expensive and is not practical for automated measurement [17].
III. DIGITAL IMAGE PROCESSING
the loaded portion is higher, the white pixel corresponds to the loaded portion. By counting the number of white pixels and dividing it with total number of pixels, will gives the percentage of wheel loading.
A. IMAGE NORMALIZATION.
The most common pre-processing step in image processing applications is image normalization. Image normalization refers to eliminating image variations (such as noise, illumination, or occlusion) that are related to conditions of image acquisition and are unrelated to object identity. Normalization is a process that changes the range of pixel intensity values aimed at correcting such differences by shifting the relative brightness values up or down before assessing the number of pixels contained within the threshold limits. Many techniques for noise reduction replace each pixel with some function of the pixel’s neighbourhood. Researchers have introduced a number of adaptive noise reduction algorithms. The Song-Delp algorithm which is used in this work, remove noise from images because openings and closings annihilate image features whose support (i.e., area in the image) does not cover the structuring element. That is, they eliminate small features and thin features. In contrast, these operations do preserve features that can contain the structuring element. Since features partition an image, opening and closing preserve those edges which are the boundaries between sufficiently large features. Edges that are boundaries between regions are preserved if they have zero width.
Edge detection is the process of locating and identifying sharp discontinuities in an image. The discontinuities are sudden changes in pixel intensity which characterize boundaries of the object in an image. Edge detection has been used by object recognition, target tracking, segmentation, etc. Several edge detection methods are in use. Beside this diversity, the majority of commonly used methods are alike. Derivative operators are applied on images and compute the gradient of several directions and combine the result of each gradient. The values of the gradient magnitude and orientation are estimated using differentiation masks. The magnitude of this derivative can be used to detect the presence of the edges. Sobel which is a popular method of edge detection was used in this work due to its simplicity and common uses. In addition, the Sobel operator holds a smoothing effect to reduce noise which is one of the reasons for its popularity. Matlab contains various toolboxes like image toolbox that has many functions and algorithms.
B. IMAGE SEGMENTATION.
Image segmentation is a fundamental processing step for many image processing applications. There are many algorithms used for image segmentation. Some of them segment an image manually while others can segment automatically. Several general purpose algorithms and techniques are available for image segmentation. These techniques often have to be combined with domain knowledge in order to effectively solve an image segmentation problem for a problem domain. The most common method of image segmentation is the threshold technique. This method is based on a clip-level (or a threshold value) to turn a grey-scale image into a binary image. The key of this method is to decide on the threshold value. Several popular methods are used in industry including the maximum entropy method, Otsu’s method (maximum variance), K-Means clustering and many others. During the thresholding process, individual pixels in an image are labelled as “object” if their pixel value are greater (or smaller) than threshold value. Other pixels are labelled as “background.” In this research work, “object” is the loaded areas on the wheel surface and "background" is abrasive grains. Characteristically, an object pixel value is assigned “1,” while a background pixel value is assigned “0.” Finally, a binary image is created by colouring each pixel white or black, depending on a pixel’s label. Several different methods for choosing a threshold exist. Users can manually choose a threshold value, or a thresholding algorithm can compute a value automatically. This is known as automatic thresholding. A sophisticated and more reliable approach might be to create a histogram of the image pixel intensities and use the valley point as the threshold. The histogram approach assumes that there is some average value for the background and object pixels. A typical grey scaled image of wheel surface is shown in Fig. 1. The histogram of pixel value along the line A–B is plotted in Fig. 3.1 (b). The vertical axis of the graph represents the pixel value. The magnitudes of 0 and 255 correspond to black and white pixels, respectively. It is evident that the pixel values of metal loaded area are higher than 120 approximately. But the actual pixel values have some variation around these average values
C. EDGE DETECTION.
Edge detection is the process of locating and identifying sharp discontinuities in an image. The discontinuities are sudden changes in pixel intensity which characterize boundaries of the object in an image. Edge detection has been used by object recognition, target tracking, segmentation, etc. Several edge detection methods are in use. Beside this diversity, the majority of commonly used methods are alike. Derivative operators are applied on images and compute the gradient of several directions and combine the result of each gradient. The values of the gradient magnitude and orientation are estimated using differentiation masks. The magnitude of this derivative can be used to detect the presence of the edges. Sobel which is a popular method of edge detection was used in this work due to its simplicity and common uses. In addition, the Sobel operator holds a smoothing effect to reduce noise which is one of the reasons for its popularity. Matlab contains various toolboxes like image toolbox that has many functions and algorithms.
Fig. 3.1 Pixel values of image
IV] GLOBAL THRESHOLDING TECHNIQUE
Definition: Thresholding is a process of converting a grayscale input image to a bi-level image by using an optimal threshold.
Purpose: The purpose of thresholding is to extract those pixels from some image which represent an object (either text or other line image data such as graphs, maps). Though the information is binary the pixels represent a range of intensities. Thus the objective of binarization is to mark pixels that belong to true foreground regions with a single intensity and background regions with different intensities.
V] EXPERIMENTAL SETUP
Fig.5.1 Block Diagram of Experimental Setup
VII. EXPERIMENTS
Experiments were conducted on Mild Steel. Before putting into operation, grinding wheel is dressed in order to bring the wheel to the best condition. Grinding wheel image is taken at this point of time. Speed of the grinding wheel is set at 2500rpm, feed at 0.06mm and depth at 0.1mm. Grinding wheel is put into operation for 1 hour. 12 images were taken for every five minute interval for mild steel specimen. The captured image is transferred to laptop and is processed using Matlab software. By using global thresholding technique, a binary image is created with loaded portion in white pixels and rest of background in black pixel.
VIII. RESULT AND DISCUSSION
The actual image and processed image of fully dressed wheel and loaded wheel at the end of 1 hour of operation on Mild Steel is as shown in figure 8.1. Actual image obtained is colour image and it had been converted to grey scale image. The white spots on the processed image indicate the percentage of loading. There are no white spots on the processed image of fully dressed wheel (Figure 8.1a). This indicates that wheel is in good condition or no loading of wheel had taken place. As the grinding operation continues percentage of loading goes on increasing. Processed image of wheel at the end of 1hour of operation (Fig 8.1.d) had large number of white spots which indicates that a certain percentage of loading had occurred.
A) B) C) D)
Fig. 8.1 A) Actual Image of Fully Dressed Wheel B) Processed Image of Fully Dressed Wheel C) Actual Image of Loaded Wheel at the End of 1 Hour of Operation D) Processed Image of Loaded Wheel at the End of 1 Hour of Operation
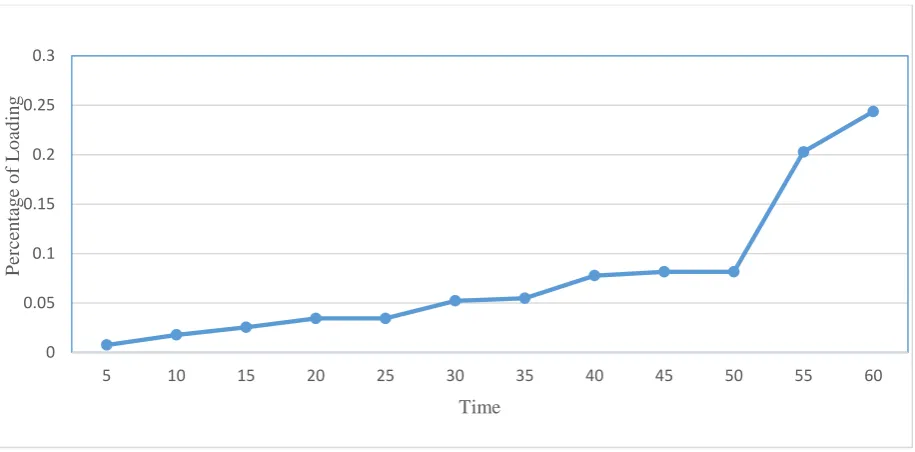
Fig 8.2. Plot for Time versus Percentage of Loading for Mild Steel Specimen
IX. CONCLUSION
Experiment conducted on mild steel specimen shows that percentage of loading increases with time. Since the carbon content associated with mild steel specimen is low and also the speed and feed given on the grinding machine is low, only a very small percentage of loading occurs.
REFERENCES
[1] Mauricio EijiNakai, Paulo Roberto Aguiar, HildoGuillardi Jr., Eduardo Carlos Bianchi, Danilo HernaneSpatti, DorianaMarilenaD’Addona. Evaluation of neural models applied to the estimation of tool wear in the grinding of advanced ceramics. International Journal of Expert Systems with Applications; 43 (2015) 7026–7035.
[2] T. Warren Liao, Chi-Fen Ting, J. Qu , P.J. Blau, A wavelet-based methodology for grinding wheel condition monitoring, International Journal of Machine Tools & Manufacture; 47 (2007) 580–592.
[3] Amin A. Mokbel, T.M.A. Maksoud, Monitoring of the condition of diamond grinding wheels using acoustic emission technique, Journal of Materials Processing Technology; 101 (2000) 292-297.
0 0.05 0.1 0.15 0.2 0.25 0.3
5 10 15 20 25 30 35 40 45 50 55 60
P
er
ce
n
tag
e
o
f
L
o
ad
in
g
[5] AbdalslamDarafon , Andrew Warkentin , Robert Bauer, Characterization of grinding wheel topography using a white chromatic sensor International Journal of Machine Tools and Manufacture; Volume 70 (2013) 22–31.
[6]ArunachalamNarayanaperumal and VijayaraghavanLakshmanan, Evaluation of the working surface of the grinding wheel using speckle image analysis, ASME 2015 International Manufacturing Science and Engineering Conference; Volume 1 (2015) 111-117.
[7] Wen-Tung Chang, Ting-Hsuan Chen, Yeong-Shin Tarng , Measuring characteristic parameters of form grinding wheels used for microdrill fluting by Computer Vision, Transactions of the Canadian Society for Mechanical Engineering; Vol. 35 No. 3 2011.
[8] J. C. Su , Y. S. Tarng, Measuring wear of the grinding wheel using machine vision, International Journal for Advanced Manufacturing Technology;31 (2006) 50–60.
[9] Ste´phaneLachance, Robert Bauer, Andrew Warkentin, Application of region growing method to evaluate the surface condition of grinding wheels, International Journal of Machine Tools & Manufacture; 44 (2004) 823–829.
[10] K.-C. Fan, M.-Z.Lee, J.-I.Mou, On-line non-contact system for grinding wheel wear measurement, International Journal Advanced Manufacturing Technology; 19 (2002) 14 22.
[11] Katsushi Furutani et al. (2002), “In-process Measurement of Topography Change of Grinding Wheel by Using Hydrodynamic Pressure”, International Journal of Machine Tools & Manufacture 42 1447–1453.
[12] SunHo Kim & Jung Hwan Ahn. (1999), “Decision of Dressing Interval and Depth by the Direct Measurement of the Grinding Wheel Surface”, Journal of Materials Processing Technology 88 190–194.
[13] Hosokawa. A & H. Yasui. (1996), “Characterization of the Grinding Wheel Surface by Means of Image Processing” (1st report), J. JSPE 62 (9) 1297–1301.
[14] Lauer-Schmaltz, H. ; Konig, W. Phenomenon of Wheel Loading Mechanisms in Grinding. Annals of CIRP, 1980, Vol. 29, pp. 201-206. [15] Konig W, Lauer-Schmaltz H (1978). Loading of the wheel phenomenon and measurement. Annals of the CIRP, 27: 217–220.
[16] Yasui H, Hiraki Y, Sakata M (2001). Development of Automatic Image Processing System for Grinding Wheel Surface. J. Japan society for prec. Eng., 67.
[17] Feng Z, Chen X (2007). Image processing of grinding wheel surface. International Journal of Advanced Manufacturing Technology, 32: 27–33. [18] Meyer, F., 1992, “Colour Image Segmentation. Maastricht,” The Netherlands in Proc. Int. Conf. Image Processing, pp. 303–306.
[19] Srivastava AK, Ram KS, Lal GK (1985). A new technique for evaluating wheel loading. International Journal of Machine Tools Des. & Res., 25: 33-38.
[20] Sakamoto H, Shimizu S, Kato D (1998). Evaluation of Loading Behaviour of Grinding Wheel Based on Working Surface Topography. Journal of the Japan Society of Precision Engineering, 64(9): 1320-1324.