ABSTRACT
DAVIS, ANNE SALLY. Improving Experimental Models for the Study of Human Influenza A Pathogenesis. (Under the direction of Jeffery K. Taubenberger and J. McHugh Law.)
Influenza A viruses cause substantial annual morbidity and mortality in the form of endemic or ‘seasonal’ epidemics and occasionally, pandemic viruses cause startling spikes in
mortality such as in 1918. To date we lack the ability to predict the emergence of pandemic strains or even the evolution of seasonal strains. Developing better techniques for predicting emergence of new human-adapted viral strains and assessing these strains’ virulence is a global public health priority.
In this dissertation, I examined the binding and entry of human influenza A viruses in both archival tissue and a primary cell line in order to further our understanding of human influenza A pathogenicity, specifically the reconstructed 1918 pandemic influenza virus. First, I addressed, tissue autofluorescence in formalin-fixed, paraffin-embedded human respiratory tissue, an issue that hampers visualization of immunofluorescent markers in respiratory tract tissue. Second, I better characterized the in vitro differentiated normal human bronchial epithelial (NHBE) cell model for analysis of human influenza infections by comparing it to formalin-fixed, paraffin-embedded human tissue samples derived from the same location in the human respiratory tract from which this primary cell line is harvested. Finally, I used the NHBE model to analyze the binding and entry of five 1918 pandemic influenza A viruses that differ only in their hemagglutinin receptor binding domain.
My research into diminishing autofluorescence in formalin-fixed, paraffin-embedded human respiratory tissues showed that Eriochrome black T, Sudan black B and sodium borohydride were differently efficacious in diminishing autofluorescence in these tissues and that the analysis techniques developed for this work are more broadly applicable to other tissue types. I also reported on the strengths and weaknesses of the NHBE model showcasing its
© Copyright 2014 Anne Sally Davis
Improving Experimental Models for the Study of Human Influenza A Pathogenesis
by
Anne Sally Davis
A dissertation submitted to the Graduate Faculty of North Carolina State University
in partial fulfillment of the requirements for the degree of
Doctor of Philosophy
Comparative Biomedical Sciences
Raleigh, North Carolina
2014
APPROVED BY:
_______________________________ ______________________________
Jeffery K. Taubenberger J. McHugh Law
DEDICATION
First and foremost, I dedicate this achievement to my husband, Richard Mark Horner, who
supports me in pursuing my dreams. They have involved a radical career change from
international computer consulting to specialized veterinary medicine. I am forever grateful
to the man who has stuck with me through my D.V.M., residency and Ph.D. It’s time to go
surfing or perhaps fly your drones, My Love.
I also dedicate this work to Zoe and Robert Horner. Born together during my residency, they
continue to inspire me daily with their individualistic fascination for our world. I re-learned
that play is as important as work. Our best discoveries come through play.
My research mentor, Jeffery K. Taubenberger, has given me license to learn, fail, and most
importantly learn from my failures on his budget, while still nagging me sufficiently to bring
me to this finish line. He has renewed my interest in classical music; I play my clarinet
again. Donna Bouley, since being assigned as my veterinary student mentor at Stanford
Medical School for the summer of 2005, has remained my constant friend and mentor
throughout, always reminding me there is a way through, so long as I set my mind to it.
Finally, I dedicate this work to my mom, dad, the rest of my family including our au pairs,
and to all of my mentors and friends, particularly Kimberly MacDonald (in memoriam)
BIOGRAPHY
A. Sally Davis was born to a New Zealander and a Brit who met on a ship in the middle of
the Pacific Ocean and settled initially in Canada. She immigrated to the United States with
her family when she was 4 years old and having explored a good number of other countries
as her home since, currently holds a US and NZ citizenship. Previously diagnosed by her
peers with Serious Sesame Street Syndrome, she is very surprised to be completing this
Doctor of Philosophy degree in as close to a single subject as she will likely ever get.
Sally is first a mother and wife, second a mentor and teacher, and third an experimental
veterinary pathologist dedicated to improving human understanding of zoonotic infectious
diseases. Her academic path has gamboled through computer science, archaeology,
education, fine and culinary arts, biochemistry, biology, then into veterinary medicine. Her
education at Dartmouth College has left her permanently interdisciplinary in her mindset.
Her athletic path first rooted in competitive swimming, entered and maintains a love for
volleyball and cycling, but has turned more recently to yoga including aerial yoga as well as
triathlons, leaving her with an unexpected passion for running, particularly cross-country.
She used to say that she would be found running only in the event that there was someone
chasing her! This has taught her that ‘never’ is a dirty word. She is at home where there are
people with whom she can do good work, share the experience, and build something new.
Her path next takes her to Manhattan, Kansas where she plans to be the best Assistant
ACKNOWLEDGEMENTS
I thank my Ph.D. committee for their support throughout the entire process of this Ph.D.,
including committee composition changes and any challenges introduced by distance. This
work would have been impossible without the support of both the NIH's Comparative
Biomedical Scientist Training Program run by Mark Simpson and Jeffery K.
Taubenberger, in whose National Institute of Allergy and Infectious Disease Intramural lab,
the Viral Pathogenesis and Evolution Section of the Laboratory of Infectious
Diseases, I was based throughout the research portion of this Ph.D. Individual contributions
TABLE OF CONTENTS
LIST OF TABLES ... vi
LIST F FIGURES ... vii
CHAPTER 1 Introduction ... 1
CHAPTER 2 Characterizing and Diminishing Autofluorescence in Formalin-fixed Paraffin-embedded Respiratory Tissue ... 14
Summary ... 15
Introduction ... 15
Materials & Methods ... 16
Results ... 20
Discussion ... 26
Acknowledgements ... 32
References ... 32
Supplemental ... 34
CHAPTER 3 Validation of Normal Human Bronchial Epithelial Cells as a Model for Influenza A Infections in Human Distal Trachea 48 Abstract ... 49
Introduction ... 50
Materials and Methods ... 52
Results ... 69
Discussion ... 75
Acknowledgements ... 87
Table ... 88
Figures ... 89
References ... 117
CHAPTER 4 Binding and entry of 1918 Pandemic Influenza Receptor Binding Domain Variants in Normal Human Bronchial Epithelial cells ... 125
Abstract ... 126
Introduction ... 127
Materials and Methods ... 131
Results ... 137
Discussion ... 140
Acknowledgements. ... 148
Tables ... 149
Figures ... 151
References ... 156
LIST OF TABLES
CHAPTER 2 Characterizing and Diminishing Autofluorescence in Formalin-fixed Paraffin-embedded Respiratory Tissue
Table 1. Treatment Abbreviations in their Order of Introduction ... 17
Table 2. Comparison of Treatments for Diminishing Green Wavelength
Autofluorescence in Human Respiratory Tissue ... 20 Table 3. ANOVA Connected Letters Reports for White Light Laser
Excitation ... 26 Table 4. ANOVA Connected Letters Reports for 458 nm ... 28 Table 5. ANOVA Connected Letters Reports for 405 nm ... 28
CHAPTER 3 Validation of Normal Human Bronchial Epithelial Cells as a Model for Influenza A Infections in Human Distal Trachea
Table. Microarray Presence/Absence Calls ... 88
CHAPTER 4 Binding and entry of 1918 Pandemic Influenza Receptor Binding Domain
Variants in Normal Human Bronchial Epithelial cells
Table 1. 1918 Pandemic Influenza HA Receptor Binding Domain
LIST OF FIGURES
CHAPTER 2 Characterizing and Diminishing Autofluorescence in Formalin-fixed Paraffin-embedded Respiratory Tissue
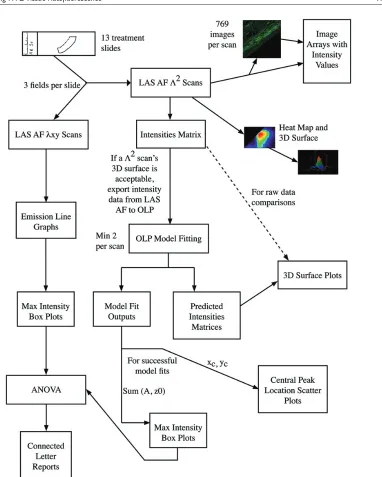
Figure 1. Reduction of autofluorescence in formalin-fixed, paraffin- embedded human tracheal tissue by three treatments ... 21 Figure 2. Λ2 data collection and analysis process flow diagram ... 23
Figure 3. Functional fit of Λ2 data to 2D Gaussian surfaces ... 24
Figure 4. Antigen retrieval and serum application do not increase autofluorescence in formalin-fixed, paraffin embedded human tracheal tissue in the 470-670 nm excitation range ... 25 Figure 5. Antigen retrieval and serum application do not increase
autofluorescence in formalin-fixed, paraffin-embedded human tracheal tissue at 458 nm or 405 nm excitations ... 27 Figure 6. Eriochrome black T with antigen retrieval shifts formalin-fixed,
paraffin-embedded human tracheal tissue autofluorescence to
the right ... 29 Figure 7. Impact of antigen retrieval with Eriochrome black T is visible
with 458 nm and 405 nm excitations ... 30 Figure 8. Sodium borohydride and Sudan black B are very effective
quenchers of autofluorescence ... 31 Figure S1. Output measurement at WLL pump power 100% vs. 60% ... 38 Figure S2. Link to image array downloads ... 39 Figure S3. Additional examples of multi-lambda data fit to 2D Gaussian
form ... 40 Figure S4. Comparison of autofluorescence in FFPE human tracheal
tissue treated with combinations of antigen retrieval and serum application ... 41 Figure S5. Antigen retrieval and serum application fail to increase
autofluorescence (additional data) ... 43 Figure S6. The effect of sodium borohydride is typically enhanced by AR
and Se ... 44 Figure S7. Treatments quench autofluorescence in frozen human liver ... 45 Figure S8. Shows the entire analysis process that was followed in this
CHAPTER 3 Validation of Normal Human Bronchial Epithelial Cells as a Model for Influenza A Infections in Human Distal Trachea
Figure 1 Normal Human Bronchial Epithelial cell types compared to
human distal trachea and carina ... 89
Figure 2. Electron microscopy of NHBEs and human carina ... 90
Figure 3. Influenza receptor lectin distributions in NHBEs and distal trachea ... 91
Figure 4. NY312-AF594 binding of NHBEs and distal trachea ... 92
Figure 5. NY312 and CA04 NHBE infections ... 93
Figure 6. Comparison of influenza antigen distribution by cell type Pandemic 2009 influenza infected NHBEs and human trachea .. 94
Figure S1. Jacalin co-localized with Muc5Ac ... 95
Figure S2. NHBE cell types, example 1 ... 96
Figure S3. NHBE cell types, example 2 ... 97
Figure S4. Distal trachea cell types ... 98
Figure S5. Carina cell types ... 99
Figure S6. Average epithelial heights of distal trachea, carina and NHBE cells ... 100
Figure S7. Neuraminidase treatment removes sialic acids from NHBEs and distal trachea ... 101
Figure S8. Sambucus nigra on NHBEs ... 102
Figure S9. Sambucus nigra on distal trachea sample 1 ... 103
Figure S10. Sambucus nigra on distal trachea sample 2 ... 104
Figure S11. Sambucus nigra on carina matched with distal trachea sample 2 105
Figure S12. Maackia amurensis II on NHBEs ... 106
Figure S13. Maackia amurensis II on distal trachea sample 1 ... 107
Figure S14. Maackia amurensis II distal trachea sample 2 ... 108
Figure S15. Maackia amurensis II on carina matched with distal trachea sample 2 ... 109
Figure S16. Maackia amurensis I on NHBE cells and distal human trachea . 110 Figure S17. NY312-AF594 binding to NHBE cells ... 111
Figure S18. NY312-AF594 binding to distal trachea ... 112
Figure S19. NY312-AF594 and SNA compete for the same receptors ... 113
Figure S20. Influenza antigen distribution by cell type in CA04 Infected NHBEs ... 114
Figure S21. Non-specific background signal with anti-influenza antibody labeling ... 115
CHAPTER 4 Binding and entry of 1918 Pandemic Influenza Receptor Binding Domain
Variants in Normal Human Bronchial Epithelial cells
Figure 1. Comparison of influenza antigen distribution by cell type for 1918 receptor biding domain variants ... 151 Figure 2. Endosomal markers with influenza antigen ... 152 Figure 3. Replications kinetics for viruses AV, NY and SC ... 153
Figure 4. Real-time PCR results for all five viruses at a multiplicity of
infection of 0.1 ... 154 Figure 5. Real-time PCR results for all five viruses at a multiplicity of
Influenza A viruses cause substantial annual morbidity and mortality in the form of endemic
or ‘seasonal’ epidemics. Occasionally, pandemic viruses cause startling spikes in mortality
such as in 1918 (Simonsen et al., 1998;Taubenberger and Morens, 2009;Wright et al., 2007).
To date we lack the ability to predict the emergence of pandemic strains or even the
evolution of seasonal strains (Taubenberger and Morens, 2006). Developing better
techniques for predicting emergence of new human-adapted viral strains and assessing these
strains’ virulence is a global public health priority.
While autopsy material can provide a rich resource for analysis of late infection, its single
time point, an individual human’s death, limits the utility of this material. Accurate
examination of stages of infections in humans via pathology is hampered by the inability to
determine the infection start time or take tissue samples at selected time points. The mouse,
ferret and to a lesser extent swine, guinea and a variety of non-human primates have been
employed as experimental animal models for human influenza infections (Crisci et al.,
2013;Louz et al., 2013;Thangavel and Bouvier, 2014). Each has its limitations.
The ferret is generally accepted as the best biological model of human influenza due to the
close resemblance of clinical course of disease, viral transmissibility, and pathology to that in
humans (Belser et al., 2011). Unfortunately, there is a dearth of ferret reagents thereby
severely limiting the downstream analyses that may be done after an in vivo infection.
Additionally, some view the ferret to be overly permissive to influenza A infection, an in
influenza A stocks (personal communication Jeffery K. Taubenberger). Therefore,
experimental results from this model should be interpreted with caution (Morens et al.,
2012).
Consequently, other animals are commonly employed to examine questions unanswerable in
ferret studies. Even though influenza transmission cannot be studied efficiently in mice,
Balb/C and other common strains of mice are often used as experimental animal models for
pathogenesis studies due to the extensive reagents available for work with them.
Additionally, with mixed success, many different non-human primates have been tried
because of their phylogenetic proximity to humans.
Prevailing hypotheses postulate that the hemagglutinin protein of avian-adapted influenza
viruses binds host cells via α2,3 sialic acid (Sia)-linked glycans and that mammalian-adapted viruses bind α2,6 Sia-linked glycans, and that host switch requires a complete change in this Sia preference (Baigent and McCauley, 2003;Suzuki, 2005). These hypotheses are difficult to
reconcile however with the frequent isolation from clinically ill patients of human influenza
viruses that have mixed α2,3/α2,6 Sia binding specificities (Liu et al., 2010;Mak et al., 2010;Memoli et al., 2012;Rogers and Paulson, 1983) or zoonotic infection with avian
influenza viruses.
A well-documented two amino acid change in the H1 hemagglutinin (HA) protein illustrates
of the tertiary structures for the 1918 H1 HA receptor binding domain (RBD) revealed the
α2,6 human form of the receptor to be more bulky than the α2,3 bird form of the receptor. A
single change in the bird form’s RBD from glutamic acid (E) to aspartic acid (D) at position
187 is crucial for viral host switch from avian to mammalian whilst a second change at
position 222 from glycine (G) to D switches sialic acid affinity from a mixed α2,3/α2,6 to completely α2,6 binding (Stevens et al., 2004). The current SIA hypothesis would predict that the 222D form would be better adapted to the mammalian host, transmit better, and may
alter virulence. Indeed, Tumpey et al.,2007 found that the 222 D form transmitted more
effectively in ferrets. However, infections of mice and ferrets with otherwise isogenic
viruses with HA 222 G or D produced equivalent pathologic changes and viral replication
(Qi et al., 2009). Furthermore, recent work on 1918 autopsy material, from which the RBD of
HA protein was sequenced, also revealed equivalent pathology regardless of D or G at
position 222 (Sheng et al., 2011).
Tumpey et al.,2007, proposed that the efficient transmission of the 222D virus is driven by
the virus’ initial binding pattern. Affinity for SIA α2,6 provides a greater ability to bind the
reportedly α2,6 dominated human upper respiratory tract. Therefore the transmission rate of
viruses with a D at position 222 should be higher than those with a G at this position. Their
ferret transmission data with the 1918 virus supports this hypothesis but the significance of
the difference is difficult to assess given the small number of ferrets used per treatment group
The comparable epidemiologic assessment for humans is the R0, the reproductive number,
which measures transmission efficiency (Wallinga and Lipsitch, 2007). Multiple studies
based on clinical data have attempted to calculate R0 for the 1918 influenza pandemic
(Andreasen et al., 2008;Mills et al., 2004). Andreason et al., 2008, estimated the R0 for the
spring-summer wave to be higher than that for the fall wave. Curiously, recent sequencing
data based on 1918 autopsy material demonstrated that 222G was more common in the
spring-summer wave case material (Sheng et al., 2011). Additionally, regardless of D or G at
position 222, influenza viral antigen distribution in the respiratory tract as determined by
immunohistochemistry (IHC) was qualitatively equivalent.
Interestingly, in three similar animal studies to those conducted by Tumpey et al., 2007, the
equivalent D to G change in the 2009 H1N1 pandemic virus revealed no differences in
transmission, viral lung titers, nasopharynx shedding, and pathology in ferrets (Belser et
al.;Chutinimitkul et al.). However, two out of three similar studies in mice showed that the
222G virus caused greater weight loss and higher viral lung titers (Belser et al.;Chutinimitkul
et al.;Zheng et al., 2010). Additionally, Zheng et al., 2010 showed that mice infected with
222G have a reduced lethal dose 50 (LD50), elevated pro-inflammatory cytokines in lung
homogenates, and more severe histopathology. They attributed this increased virulence of
the 222G virus to the virus’ mixed SIA binding capability providing a predilection for lower
respiratory tract in humans. In preliminary studies, sequencing the HA RBD from viral RNA
extracted from formalin fixed paraffin embedded (FFPE) tissue from several 2009 H1N1
tied to severity of histopathology or presence of bacterial co-infection (Taubenberger lab,
unpublished). In short, the predicted decreased transmissibility and increased lung disease
severity of a 222G virus is not consistently supported by the available data.
Additionally, several in vitro experiments bring into question the exclusivity of SIA binding
as a determinant of host cell infectivity. Stray et al., 2000 demonstrated that MDCK cells
stripped of their SIA are still permissive to influenza infection and other in vitro studies
identified other receptors that are critical for influenza infectivity regardless of the presence
or absence of SIA glycans (Chu and Whittaker, 2004;Oshansky et al., 2011;Stray et al.,
2000;Upham et al., 2010). In a study with viruses that were otherwise isogenic except for
their HA, Qi et al., 2011 showed that otherwise isogenic viruses with pandemic virus HAs
evade binding surfactant protein D, a type II pneumocyte product, regardless of their SIA
binding preference, resulting in severe pathology in mice not observed with viruses bearing
the HA of seasonal viruses (Qi et al., 2011). Sun and Whittaker, 2013 proposed that
influenza may need a specific co-receptor for viral internalization or presentation of sialic
acid on a specific protein (Sun and Whittaker, 2013). A reexamination of the role played by
influenza SIA binding models in influenza biology is warranted.
My main hypothesis was that influenza A virus binding is driven by both variations in the
receptor binding domain of the virus’ hemagglutinin protein as well as distribution of
influenza A glycan receptors on target cells’ surfaces. Receptor-binding domain changes
type distribution of viral antigen for a sufficiently human-adapted virus. This suggests that
otherwise isogenic human-adapted viruses that vary only in their preferences for α2,6 and
α2,3 Sia will produce similar disease severity because their initial sialic acid binding pattern, while possibly predictive of cell types preferentially bound by the virus, does not adequately
define the total susceptible cell population. Rather, additional mechanisms are likely at play.
Instead of employing an existing experimental animal model or developing a new one, I
chose to tackle this hypothesis using human tissue and a human primary cell line that is
differentiable into a pseudostratified epithelium in vitro resembling the tracheal epithelium.
First, I improved our abilities to use archival human respiratory tissue for
immunofluorescence work by characterizing autofluorescence that hampers its use and
determining which methods best reduce this.
Second, I better characterized the selected primary cells,normal bronchial epithelial cells
(NHBEs) for analysis of human influenza infections. Finally, I used this model to analyze a
set of 1918 pandemic influenza A viruses that differed only in their HA receptor binding
domain.
Researchers rely heavily on formalin-fixed paraffin-embedded tissue archives for research
tissue samples and formalin is used as the main preservative for surgical and postmortem
pathology tissue specimens. Tissue autofluorescence, a combination of natural tissue
fluorescence and fixative and processing induced fluorescence, is present in most every fixed
tissue autofluorescence in respiratory tissues. Therefore, I sought to characterize
formalin-fixed paraffin-embedded human respiratory tissue autofluorescence and determine treatments
that diminish it. I used both qualitative and quantitative techniques in this research.
NHBE cells are derived from the distal-most aspect of the human trachea, near the bronchial
bifurcation also known as the carina. These cells are dedifferentiated post collection from
cadavers. Researchers typically differentiate them into a pseudostratified epithelium prior to
their use. They have been used for influenza infection studies. Differences between the
source tissue from which they are derived and the redifferentiated epithelia may impact these
infection studies. Therefore, I chose to compare these cells to their source tissue. This
comparison included histologic and morphologic analysis by light and electron microscopy, a
comparison of cell type distribution using fluorescence microscopy and microarray
expression analysis, examination of influenza receptor distribution and an infection study
comparison to autopsy tissue. In so doing, I sought to identify strengths and limitations in
the NHBE model for influenza research. We hypothesized that the artificial environment in
which the NHBEs are differentiated into epithelia might induce limitations. Knowledge of
these limitations would improve experimental design capability with this model and suggest
techniques for future improvements to the model.
Finally, I returned to the study of the D to G change at position 222 in HA receptor binding
domain variants of 1918 (H1N1) pandemic influenza viruses. I compared the binding and
(187E, 222G) viruses. Additionally, within this experimental context, I examined two new
1918 receptor binding domain variants described in Sheng et al., 2011. The first,
A/VA/1/1918, has an additional change from consensus Q (glutamine) to R (arginine) at
position 189 and is predicted by molecular modeling prefer α2,6 sialic acid. The second,
A/NY/3/1918, has predominantly N (asparagine) at position 222 and its binding preference is
unknown. I hypothesized that these virus’ binding and entry profiles would align with their
Sia preferences. An α2,6 preference would provide an advantage to a virus, seen as these
References
Andreasen V, Viboud C & Simonsen L (2008) Epidemiologic characterization of the 1918 influenza pandemic summer wave in copenhagen: Implications for pandemic control strategies. J Infect Dis 197:270-278
Baigent SJ & Mccauley JW (2003) Influenza type A in humans, mammals and birds:
Determinants of virus virulence, host-range and interspecies transmission. Bioessays 25:657-671
Belser JA, Katz JM & Tumpey TM (2011) The ferret as a model organism to study influenza a virus infection. Dis Model Mech 4:575-579
Belser JA, Wadford DA, Pappas C, Gustin KM, Maines TR, Pearce MB, Zeng H, Swayne DE, Pantin-Jackwood M, Katz JM & Tumpey TM Pathogenesis of pandemic influenza A (H1N1) and triple-reassortant swine influenza A (H1) viruses in mice. Journal of Virology 84:4194-4203
Chu VC & Whittaker GR (2004) Influenza virus entry and infection require host cell N-linked glycoprotein. Proc Natl Acad Sci U S A 101:18153-18158
Chutinimitkul S, Herfst S, Steel J, Lowen AC, Ye J, Van Riel D, Schrauwen EJA, Bestebroer TM, Koel B, Burke DF, Sutherland-Cash KH, Whittleston CS, Russell CA, Wales DJ, Smith DJ, Jonges M, Meijer A, Koopmans M, Rimmelzwaan GF, Kuiken T, Osterhaus ADME, Garcia-Sastre A, Perez DR & Fouchier RaM Virulence-associated substitution D222G in the hemagglutinin of 2009 pandemic influenza A (H1N1) virus affects receptor binding. Journal of Virology 84:11802-11813
Crisci E, Mussa T, Fraile L & Montoya M (2013) Review: Influenza virus in pigs. Mol Immunol 55:200-211
Liu Y, Childs RA, Matrosovich T, Wharton S, Palma AS, Chai W, Daniels R, Gregory V, Uhlendorff J, Kiso M, Klenk HD, Hay A, Feizi T & Matrosovich M (2010) Altered receptor specificity and cell tropism of D222G hemagglutinin mutants isolated from fatal cases of pandemic A (H1N1) 2009 influenza virus. J Virol 84:12069-12074
Mak GC, Au KW, Tai LS, Chuang KC, Cheng KC, Shiu TC & Lim W (2010) Association of D222G substitution in haemagglutinin of 2009 pandemic influenza A (H1N1) with severe disease. Euro Surveill 15(14):1-2
Memoli MJ, Bristol T, Proudfoot KE, Davis AS, Dunham EJ & Taubenberger JK (2012) In vivo evaluation of pathogenicity and transmissibility of influenza A (H1N1)pdm09 hemagglutinin receptor binding domain 222 intrahost variants isolated from a single immunocompromised patient. Virology 428:21-29
Mills CE, Robins JM & Lipsitch M (2004) Transmissibility of 1918 pandemic influenza. Nature 432:904-906
Morens DM, Subbarao K & Taubenberger JK (2012) Engineering H5N1 avian influenza viruses to study human adaptation. Nature 486:335-340
Oshansky CM, Pickens JA, Bradley KC, Jones LP, Saavedra-Ebner GM, Barber JP, Crabtree JM, Steinhauer DA, Tompkins SM & Tripp RA (2011) Avian influenza viruses infect primary human bronchial epithelial cells unconstrained by sialic acid alpha2,3
residues. PLoS One 6:e21183
Qi L, Kash JC, Dugan VG, Jagger BW, Lau YF, Sheng ZM, Crouch EC, Hartshorn KL & Taubenberger JK (2011) The ability of pandemic influenza virus hemagglutinins to induce lower respiratory pathology is associated with decreased surfactant protein D binding. Virology 412:426-434
Qi L, Kash JC, Dugan VG, Wang R, Jin G, Cunningham RE & Taubenberger JK (2009) Role of sialic acid binding specificity of the 1918 influenza virus hemagglutinin protein in virulence and pathogenesis for mice. J Virol 83:3754-3761
Rogers GN & Paulson JC (1983) Receptor determinants of human and animal influenza virus isolates: Differences in receptor specificity of the H3 hemagglutinin based on species of origin. Virology 127:361-373
Simonsen L, Clarke MJ, Schonberger LB, Arden NH, Cox NJ & Fukuda K (1998) Pandemic versus epidemic influenza mortality: A pattern of changing age distribution. J Infect Dis 178:53-60
Stevens J, Corper AL, Basler CF, Taubenberger JK, Palese P & Wilson IA (2004) Structure of the uncleaved human H1 hemagglutinin from the extinct 1918 influenza virus. Science 303:1866-1870
Stray SJ, Cummings RD & Air GM (2000) Influenza virus infection of desialylated cells. Glycobiology 10:649-658
Sun X & Whittaker GR (2013) Entry of influenza virus. Adv Exp Med Biol 790:72-82
Suzuki Y (2005) Sialobiology of influenza: Molecular mechanism of host range variation of influenza viruses. Biological & Pharmaceutical Bulletin 28:399-408
Taubenberger JK & Morens DM (2006) 1918 influenza: The mother of all pandemics. Emerg Infect Dis 12:15-22
Taubenberger JK & Morens DM (2009) Pandemic influenza--including a risk assessment of h5n1. Rev Sci Tech 28:187-202
Thangavel RR & Bouvier NM (2014) Animal models for influenza virus pathogenesis, transmission, and immunology. J Immunol Methods 410c:60-79
Tumpey TM, Maines TR, Van Hoeven N, Glaser L, Solorzano A, Pappas C, Cox NJ, Swayne DE, Palese P, Katz JM & Garcia-Sastre A (2007) A two-amino acid change in the hemagglutinin of the 1918 influenza virus abolishes transmission. Science 315:655-659
Upham JP, Pickett D, Irimura T, Anders EM & Reading PC (2010) Macrophage receptors for influenza A virus: Role of the macrophage galactose-type lectin and mannose
receptor in viral entry. Journal of Virology 84:3730-3737
Wright PF, Neumann G & Kawaoka Y 2007. Orthomyxoviruses. In: KNIPE D M &
HOWLEY P M (eds.) Fields virology. Philadelphia: Lippincott Williams & Wilkins
Zheng B, Chan KH, Zhang AJ, Zhou J, Chan CC, Poon VK, Zhang K, Leung VH, Jin DY, Woo PC, Chan JF, To KK, Chen H & Yuen KY (2010) D225G mutation in
CHAPTER 2
Journal of Histochemistry & Cytochemistry 2014, Vol. 62(6) 405 –423 © The Author(s) 2014
Reprints and permissions: sagepub.com/journalsPermissions.nav DOI: 10.1369/0022155414531549 jhc.sagepub.com
Article
Introduction
The successful visualization of fluorescent markers in for-malin-fixed paraffin-embedded (FFPE) respiratory tissue sections is frequently hampered by tissue autofluorescence. Autofluorescence prevents the clean visualization of tissue-bound antibodies and lectins via immunofluorescence tech-niques, particularly when fluorochromes in the fluorescein isothiocyanate (FITC) range are used. The peak excitation of FITC is 500 nm and it emits at 75% relative intensity and greater from 506–532 nm (Life Technologies, Carlsbad, CA). Tissue autofluorescence has been attributed to many factors including endogenous tissue elements such as col-lagen, tissue processing techniques, particularly formalin
fixation, and reagents such as serum that are applied to tis-sues during immunofluorescence protocols (Baschong et al. 2001; Billinton and Knight 2001; Collins 2006; Del Castillo et al. 1989). Key sources of autofluorescence in human tis-sue are likely lipofuscin, collagen, elastin, and red blood cells as well as formalin fixation (Banerjee et al. 1999;
531549JHCXXX10.1369/0022155414531549Davis et al.Diminishing FFPE Tissue Autofluorescence
research-article2014
Received for publication August 20, 2013; accepted March 3, 2014.
Corresponding Author:
Jeffery K. Taubenberger, Viral Pathogenesis and Evolution Section, National Institutes of Allergy and Infectious Diseases (NIAID), National Institutes of Health (NIH), 33 North Dr., MSC 3203, Bethesda, MD 20892, USA.
Email: [email protected]
Characterizing and Diminishing Autofluorescence in
Formalin-fixed Paraffin-embedded Human Respiratory
Tissue
A. Sally Davis, Anke Richter, Steven Becker, Jenna E. Moyer, Aline Sandouk, Jeff Skinner, and Jeffery K. Taubenberger
Viral Pathogenesis and Evolution Section (ASD, JEM, AS, JKT); Bioimaging Section, Research Technology Branch (SB); and Laboratory of Immunogenetics (JS), Division of Intramural Research, National Institutes of Allergy and Infectious Diseases, National Institutes of Health, Bethesda, Maryland; Defense Resources Management Institute, School of International Graduate Studies, Naval Postgraduate School, Monterey, California (AR); Department of Population Health and Pathobiology, North Carolina State University College of Veterinary Medicine, Raleigh, North Carolina (ASD)
Summary
Tissue autofluorescence frequently hampers visualization of immunofluorescent markers in formalin-fixed paraffin-embedded respiratory tissues. We assessed nine treatments reported to have efficacy in reducing autofluorescence in other tissue types. The three most efficacious were Eriochrome black T, Sudan black B and sodium borohydride, as measured using
white light laser confocal 2 (multi-lambda) analysis. We also assessed the impact of steam antigen retrieval and serum
application on human tracheal tissue autofluorescence. Functionally fitting this 2 data to 2-dimensional Gaussian surfaces
revealed that steam antigen retrieval and serum application contribute minimally to autofluorescence and that the three treatments are disparately efficacious. Together, these studies provide a set of guidelines for diminishing autofluorescence in formalin-fixed paraffin-embedded human respiratory tissue. Additionally, these characterization techniques are transferable to similar questions in other tissue types, as demonstrated on frozen human liver tissue and paraffin-embedded mouse lung tissue fixed in different fixatives. (J Histochem Cytochem 62:405–423, 2014)
Keywords
406 Davis et al.
Baschong et al. 2001; Billinton and Knight 2001; Collins 2006; Monici 2005; Viegas et al. 2007). Additionally, endogenous flavins, reduced nicotinamide-adenine dinucle-otide and nicotinamide-adenine dinucledinucle-otide phosphate are common causes of autofluorescence in cell cultures, where the brighter extracellular proteins are absent (Billinton and Knight 2001; Monici 2005; Viegas et al. 2007). Additionally, serum blocking has been suspected to increase autofluores-cence (personal communication with staff at the Bioimaging Section, RTB, NIAID, NIH) and antigen retrieval tech-niques may also play a role (personal communication with multiple researchers at the NIH). The little evidence that has been reported has largely been observational data.
Because the vast majority of tissues for human and animal pathology over the last century has been treated with FFPE, this study focused on reducing autofluorescence in typical FFPE sections. Unless prospective tissue collection for a study is possible, alternative fixatives such as paraformalde-hyde, which has been reported to decrease autofluorescence in tissues (Clancy and Cauller 1998), are not generally an option. Our selection of treatments for diminishing autofluo-rescence in FFPE human respiratory tissue was guided by methods reported in the literature and recommended by other immunofluorescence practitioners for a diverse collection of tissue types (Baschong et al. 2001; Beisker et al. 1987; Callis 2006; Clancy and Cauller 1998; Collins 2006; Cowen et al. 1985; Kittelberger et al. 1989; Schenk and Churukian 1974; Schnell et al. 1999). To our knowledge, there has been no published study focused on which of these reagents work best on FFPE respiratory tissues.
This study focused on characterizing and altering the autofluorescence profile of FFPE human tracheal tissue; spe-cifically, the epithelium, lamina propria, and submucosa, as these tissue layers are of highest interest to respiratory pathol-ogists and virolpathol-ogists. We measured and modeled autofluo-rescence overall as well as endogenous, element-specific autofluorescence in FFPE human tracheal tissue, tested tech-niques for diminishing and shifting this autofluorescence, and evaluated changes to the tissue autofluorescence profile that the most promising of these techniques produced. We characterized the autofluorescence signature for FFPE tra-cheal tissue by measuring overall tissue autofluorescence using the 2 mapping technique on a Leica SP5 white light
laser (WLL) confocal microscope and performing mathemat-ical modeling; specifmathemat-ically, 2D Gaussian surface fitting. Finally, we assessed processes reported to increase autofluo-rescence as well as the most promising treatments reported to decrease autofluorescence using these same techniques.
Materials & Methods
Tissues
Anonymous donor human respiratory tissues, both lung and
MD). Briefly, tissues were harvested from human cadavers at no more than several hours post-mortem and fixed with 10% neutral-buffered formalin, dehydrated, and embedded in paraffin. Approximately 5-µm-thick sections were cut and placed on positively charged slides. Similarly sectioned slides of HistoChoice (Sigma-Aldrich, St. Louis, MO) and of formalin-fixed paraffin-embedded (FFPE) mouse lung tissue were provided by the NIH Clinical Center Critical Care Medicine Department and NIAID Viral Pathogenesis and Evolution Section, respectively. Frozen cirrhotic human liver tissue sections were provided by the NIAID Hepatic Pathogenesis Section.
Sample Preparation to Survey Techniques for Diminishing Autofluorescence
Sections of both human trachea and human lung tissue were used in this initial comparison of treatments reported to diminish autofluorescence. The nine treatments were as fol-lows: trypan blue, Eriochrome black T, Sudan black B, Chicago (Pontamine) blue, sodium borohydride, tris gly-cine, ammonium chloride, ammonia ethanol and UV trans-illumination. The first four, which are dyes, were hypothesized to either shift or mask the autofluorescence emission profile. The latter five are quenchers, hypothe-sized to decrease the intensity of the autofluorescence with-out shifting its emission. One physical and four chemical quenching techniques were tested. With the exception of the UV transillumination and ammonia ethanol treatments (detailed separately in this section), all slides were rehy-drated and antigen retrieved as previously described (Martinez-Anton et al. 2013). The treatment of interest was then applied, 1× TBSt with 0.02% Tween-20 washes were performed to remove the reagent at the end of the treatment, and slide was mounted in SlowFade Gold antifade reagent with DAPI (Molecular Probes; Carlsbad, CA). For all treat-ments, a volume sufficient to cover the tissue throughout the incubation time (approximately 200 µl) was applied.
tis-Diminishing FFPE Tissue Autofluorescence 407
followed by additional washing. Chicago blue was prepared at 0.5% in 1× TBS and then applied to tissues for 10 min (Collins 2006; Cowen et al. 1985). Sodium borohydride (NB) was prepared at 1 mg/ml in 1× TBS and kept on ice. It was applied to tissues for three consecutive 10 min incuba-tions without any intermediary washes (Baschong et al. 2001; Beisker et al. 1987; Clancy and Cauller 1998; Collins 2006). Tris-glycine was prepared from 0.1 M glycine in TBS, adjusted to pH 7.4 using Tris, and applied to slides for 30 min (Callis 2006; Collins 2006). Ammonium chloride (50 mM) in 1× TBS was applied to tissues for 10 min (Callis 2006). After rehydration in 70% EtOH, a solution of 70% EtOH with 0.5% ammonia was applied for 1 hr, and then rehydration was resumed with the addition of a 50% EtOH step followed by distilled water. Slides then underwent anti-gen retrieval and finally were washed in 1× TBS and mounted as described for the other treatments (Baschong et al. 2001). UV treatment consisted of either 8- or 24-hr trans-illumination of the dehydrated tissue on a UVB transillumi-nator (Ultra Lum, Inc.; Claremont, CA), with a range between 280–320 nm. The tissues were covered with foil prior to rehydrating and mounting as per above (Neumann and Gabel 2002). Slides were reviewed and compared with an untreated slide using a Leica SP5 WLL confocal system (Leica Microsystems, Wetzlar, Germany).
Sample Preparation for Analysis of Baseline Autofluorescence
In the following analyses, all human trachea slides were serially sectioned from the same FFPE tissue block so that variation in tissue fixation and processing was held con-stant across treatment comparisons. In order to rule out the possibility that antigen retrieval or serum application increased tissue autofluorescence and to establish a pic-ture of baseline autofluorescence in human tracheal tissue,
the following human tracheal tissue slides were evaluated: no antigen retrieval (AR) without serum (No AR No Se), no AR with serum (No AR Se), AR with serum (AR Se), AR without serum (AR No Se). All treatment abbrevia-tions used in the human tracheal tissue portion of this study are listed in Table 1. Regardless of treatment, all slides were rehydrated as per above. Slides that received AR and/or serum were processed as described followed by a 5 min 1× TBSt wash with several fluid exchanges in order to simulate washes that would occur during typical immunofluorescence protocols. Slides were maintained in 1× TBSt between treatments. Slides were mounted in ProLong Gold Antifade Reagent (Molecular Probes) as per vendor’s instructions. This change from SlowFade Gold with DAPI to Prolong Gold was deliberate, as the latter enables longer-term preservation of fluorescence. Additionally, samples were not stained with DAPI so that autofluorescence spectra could be collected with 405 nm excitation.
Sample Preparation to Measure Effect of a Select Number of Treatments
In order to examine the possibility that AR and serum appli-cation might interact with a downstream treatment, AR and serum application were continued in conjunction with the next two treatments, EBT and NB, which are targeted at diminishing autofluorescence.
We applied EBT treatment to human tracheal sections in conjunction with AR and serum, which resulted in four combinations of treatments (see Table 1). The same proce-dure as detailed in the last section was followed for this slide production with the addition of the application of freshly prepared 1.65% EBT for 5 min after the serum application stage. Slides were then mounted in ProLong Gold. NB treatment was analyzed with the following Table 1. Treatment Abbreviations in their Order of Introduction.
Abbreviation Treatment
No antigen retrieval and no serum No AR No Se
No antigen retrieval and serum No AR Se
Antigen retrieval and serum AR Se
Antigen retrieval and no serum AR No Se
Eriochrome black T, no antigen retrieval and no serum EBT No AR No Se
Eriochrome black T, No antigen retrieval and serum EBT No AR Se
Eriochrome black T, antigen retrieval antigen retrieval and serum EBT AR Se
Eriochrome black T, antigen retrieval and no serum EBT AR No Se
Sodium borohydride, antigen retrieval and serum NB AR Se
Sodium borohydride, no antigen retrieval and no serum NB No AR No Se
Sudan black B, antigen retrieval and serum SB AR Se
408 Davis et al.
combinations: NB AR with serum (NB AR Se) and NB No AR without serum (NB No AR No Se). We also looked at the effect of SB in conjunction with AR and serum (SB AR Se) to compare with EBT AR Se. Additionally, some com-bination treatments were explored, including NB with EBT (NB EBT AR Se) and NB with SB (NB SB AR Se) both with AR and serum. In the above preparations, serum was applied after NB whilst serum was applied before EBT and SB, as per previous recommendations (Baschong et al. 2001; Clancy and Cauller 1998; Kittelberger et al. 1989; Schenk and Churukian 1974; Schnell et al. 1999). Finally, in order to separate tissue-dependent results from treatment-dependent results, serial and/or step sections of AR Se, EBT AR Se, NB AR Se and SB AR Se were made.
Data Capture on the Leica SP5 White Light Laser Confocal System
Three fields, each always including regions of epithelium, lamina propria and submucosa, were analyzed for each of the 13 treatment combinations listed in Table 1. An addi-tional experiment on triplicate sections with four of the treatments—AR Se, EBT AR Se, NB AR Se and SB AR Se—was also conducted in order to account for tissue section-dependent changes in the results. Data were col-lected with a 40×, 1.25 NA oil immersion objective at 600 Hz, bidirectional capture, 512×512 pixels, 387.50×387.50 µm field-of-view, pinhole 1 AU without any averaging or accumulation.
The WLL pump power was set at 60% directly on the laser unit. This compensation was done so that the measure-ments for the peak intensity of autofluorescence for all treatments fell within the range of the initial data and conse-quently was amenable to mathematical modeling. For more information on the WLL pump power, please see the Supplemental Methods.
2 WLL data was gathered in the xyλΛ acquisition mode
(Leica Microsystems 2010), with the following excitation/ emission scan settings: excitation range 470–670 nm,
Λ-excitation step size 5 nm, detection range 480–780 nm, detection bandwidth 10 nm, and λ-detection step size 10 nm. During all sessions, the smart gain was 1020.8 and the smart offset -3.4%. Accompanying fluorescent images were collected for each data point. Post-data acquisition, excita-tion/emission scan contour plots and 3D views were pro-duced in LAS AF Software (Leica Microsystems) for the
2 data; this data was then exported for further processing
in Origin Lab Pro version 9.0 (OLP) (OriginLab Corporation; Northhampton, MA) and Microsoft Excel (Microsoft Corp.; Redmond, WA).
Emission data at 405 nm and 458 nm were gathered using the UV diode and Argon lasers at 11% and 18%, respectively, and the xyλ acquisition mode. For the 405 nm excitation, the following λ-scan range properties were
employed: detection range, 415-775 nm; detection band-width, 10 nm; and detection step size, 10 nm. The 458 nm
λ-scan settings were detection range, 470-770 nm; band-width, 10 nm; and step size, 10 nm. The 405 and 485 nm lambda data were also reviewed in LAS AF using the Quantify functionality and then exported for further analy-sis in Excel.
Images demonstrating autofluorescence levels in the green wavelengths and their change due to treatments were taken with a 40× oil objective, NA of 1.25 using the follow-ing settfollow-ings on the WLL: pinhole, 1 AU; 387.50×387.50 µm field-of-view; 1024×1024 pixel format; line averaging, 4; HyD gain of 100%;. An additional set of images demon-strating representative autofluorescence for AR Se, No AR Se, No AR No Se, and AR No Se were taken on a Leica SP8 confocal system with the following settings: pinhole, 1 AU, 387.50×387.50 µm field-of-view; 1024×1024 pixel format; line averaging, 4; HyD gain of 100%, with a 40× oil objec-tive, NA of 1.25. For a given panel, the images were taken during a single session on serial sections of the same tra-cheal tissue. This was done in a separate session from the
2 data capture because the images taken during those
ses-sions are only 512×512 pixels. However, all 2 session
images and intensity data are provided in the form of image arrays produced in OLP from the LAS AF data.
Mathematical Modeling of 2 Data
Diminishing FFPE Tissue Autofluorescence 409
the variations of model fit possible with the given data, two models at a minimum were fit for each data set collected. The models were created by progressively eliminating the low intensity levels, wherein the greatest noise was observed. For example, the first model would be fit using all of the available data; the second model would be fit using only data with an intensity greater than 1; and the third model would be fit only using data with an intensity greater than 2. If a model failed to converge, the next level of intensity would be eliminated and the model would be fit again. Because of this fitting procedure, the floor of the model (z0) would rise by necessity and hence, to obtain emission intensity levels, it is necessary to add this floor to the peak emission. As, for each treatment, three fields of data were captured, a total of at least six model fits were made per treatment. For each of these fits, the four model fit parameters were exported to Excel for further analysis. Additionally, graphics were created in OLP using both the raw data and the fitted models (as detailed in the next section).
Examination of Fixed Mouse Lung Tissue Autofluorescence
In another set of experiments, we compared otherwise untreated mouse lung tissue fixed with HistoChoice (Sigma-Aldrich; St Louis, MO) with mouse lung tissue fixed with 10% neutral-buffered formalin. We used the 2 data
collec-tion techniques detailed above and then analyzed the result-ing raw 3D data in OLP.
Effect of Eriochrome Black T and Sudan Black B on Frozen Human Liver Tissue
Experiments with cirrhotic human frozen liver tissue sec-tions were used to examine the effect of EBT and SB on this tissue type. Three slides were prepared: untreated, EBT and SB. Frozen tissue slides were incubated in 100% ethanol for 10 min at -20C. Without waiting for them to dry, they were rehydrated by washing in PBS with 0.01% Tween-20 (PBSt) twice for 5 min each. The slides were then blocked for 20 min with 10% normal goat serum diluted in PBSt, washed in PBSt for 20 min, followed by two washes in PBS only. EBT or SB was applied as per the earlier described methods or the slide was left in PBS. Finally, slides were mounted in ProLong Gold. Similar to the mouse tissue analysis above, we used the 2 data techniques to analyze the effect of the
EBT and SB on this tissue type.
Data Analysis
Once the 2 model data was imported into OLP the mean,
standard deviation, and standard error emission intensity level were calculated for each treatment and plotted in a
boxplot. In addition, scatter plots were created to permit comparison of the locations of the central peak of emission intensity (xc, yc) for each model fit for each treatment. Smaller intensity levels equated to less autofluorescence with a value of zero representing an absence of autofluores-cence detection at a given excitation/emission pairing. Relative emission intensity is unitless, but for presentation it is scaled and expressed using an 8-bit scale (0–255). Emission intensity is a function of both laser power and efficiency of excitation. The WLL output is not constant across all wavelengths. In order for the sample to be excited by constant power at each wavelength, the output of the laser is automatically adjusted. Therefore, the relative emis-sion across the spectrum can be compared.
3D surface plots of raw WLL 2 data as well as model
output virtual matrices were created in OLP using Open GL 3D Surface Plot functionality. They enabled visual comparison of raw to modeled data for individual treat-ments, inter-field comparison for a single treatment and comparison of treatments in the form of 3D surfaces. Specifically, hybrid graphs composed of multiple color fill and matrix scatter surfaces were used to improve visual discrimination of this data. The choice of color fill vs. matrix scatter has no other significance with the exception of graphs that display raw data vs. model output, for which the former is a color fill surface and the latter a matrix scatter surface.
Data at 405 nm and 458 nm xyλ were directly imported into OLP for all analyses. Emission data for each excitation was graphed for three fields for each treatment slide and visually examined for differences in the shape of the emis-sion intensity spectrum. The x and y-axes for these graphs were standardized within each laser excitation group. Because the 405 nm and 458 nm data were generated through the use of two different lasers, their intensity values were not comparable to each other. In addition, the maxi-mum emission intensity was calculated for each field and the mean, standard deviation, and standard error for the maximum emission intensity was calculated for each treat-ment. Boxplots permit comparison of this data. Finally, the y-axes for the 405 nm, 458 nm and WLL intensity plots have different ranges on their y-axes. These are reflective of individual laser-dependent intensity ranges, which are also non-comparable between data sets.
410 Davis et al.
Intensities were compared among the 13 treatment groups (Table 1) using one-way ANOVA with Tukey post-hoc tests for multiple comparisons. This analysis was done in JMP 10.0.0 64-bit edition (SAS Institute; Cary, NC). As this is a comparison of all possible treatment pairs, we pres-ent the results in the form of a connected letters report (in Tables 3, 4, and 5), which shows the mean (average) maxi-mum intensity for each treatment as well as the groupings into which each of the treatments were categorized. Treatments not sharing a letter are significantly different from each other; treatments sharing a letter are not signifi-cantly different.
Confocal images presented in figure panels were post-processed in Imaris 7.6.3 (Bitplane; Zurich, Switzerland). However, 2 session images, which were exported in TIFF
format from the Leica software and uploaded directly into OLP for image array assembly, were not post-processed in Imaris.
Results
Three Treatments Significantly Diminish Green Wavelength Autofluorescence
Nine treatments, previously reported to reduce autofluores-cence in a diverse range of cells and tissue types, were semi-quantitatively graded for their ability to reduce auto-fluorescence in FFPE human respiratory tissue. These treat-ments were also assessed for their level of interference with visualization on other channels such as DAPI (75% inten-sity emission range 431–492 nm) and rhodamine red (75%
as well as ease of preparation and reproducibility of the treatment (Table 2). A 0–3 scale was used to grade the reduction in autofluorescence, from no appreciable reduc-tion (0) to marked reducreduc-tion (3); to describe degree of inter-ference with other channels including bright field visualization, from marked interference (0) to no interfer-ence perceived (3); and to present the ease of preparation and reproducibility of the treatment, from time consuming or complex to prepare, with high variability in treatment effect (0) to easy to prepare and a readily repeatable effect on autofluorescence (3).
EBT diminished tissue autofluorescence in the green wavelengths (Fig. 1A, 1B). However, it shifted (i.e., moved the highest intensity components of) this autofluorescence from the green to red wavelengths. NB was the most effec-tive quencher, diminishing yet not shifting the autofluores-cence (Fig. 1C). SB, although more labor intensive in its preparation and its application, also showed promise (Fig. 1D). It appeared to mask the autofluorescence rather than shifting it. UV treatment showed minimal change, likely because the range of UV exposures did not adequately over-lap with that of the tissue autofluorescence. The other quenchers and dyes either failed entirely, despite titrations of concentration and extensions of incubation time, or had only minimal effect, markedly less than the three aforemen-tioned treatments.
EBT, NB and SB, the most promising treatments for diminishing autofluorescence on human respiratory tissue, were thus selected for further study. We also added steam antigen retrieval and serum application to our study set because both are frequently used in immunofluorescence Table 2. Comparison of Treatments for Diminishing Green Wavelength Autofluorescence in Human Respiratory Tissue.
Treatment AutofluorescenceReduction in Interference with Other Channels Ease of Preparation and Reproducibility
Trypan blue 0 3 3
Eriochrome black T 3 1 (faint black residue visible on bright field, rhodamine red autofluorescence increased, DAPI visibility decreased)
3
Sudan black B 3 0 (black residue obvious, bright field clarity poor, DAPI visibility decreased, boils under MP)
0
Chicago (Pontamine) blue 2 2 (DAPI visibility decreased) 3
Sodium borohydride 3 3 2
Tris glycine 1 3 2
Ammonium chloride 0 3 2
Ammonia ethanol 2 3 3
UVB transillumination 1 3 2
Diminishing FFPE Tissue Autofluorescence 411
them contributing to an increase in autofluorescence. The full set of treatments for this section of the study and their acro-nyms is listed in Table 1. Finally, because the differences between autofluorescence level change on lung and tracheal tissue were minimal, the tissues to be tested were narrowed to human tracheal tissue for the remainder of the study.
Mathematical Modeling of 2 Data is a Valid
Technique for Comparing Treatment Effects
In order to compare treatment-induced changes in human tracheal tissue autofluorescence, we captured autofluores-cence intensity images using Leica 2-technology on the
412 Davis et al.
Leica SP5 WLL confocal system (Leica Microsystems 2010). For each excitation, a full series of emission mea-surements was made for the entire field. A 2D intensity map and corresponding image was constructed for each excita-tion/emission combination so that all the intensity data could be reviewed in a single 3D surface graph. With this approach, for each pixel, the full photonic range was cap-tured, not just the peak intensity. Given our data collection settings (as described in the Materials & Methods), for each field analyzed, we generated 769 images of autofluores-cence with all possible excitation/emission combinations. We provide these images paired with their intensity values in image arrays, one per field measured (Supplemental Fig. S2A–2NN). In order to compare these data in a more quan-titative fashion than direct visual inspection of individual images or via the 3D surface generated for each field, we fitted the data to 2D Gaussian surfaces and focused on model outputs with biological significance. All model fit reports are provided as supplemental data (Supplemental file: “Model Fits.docx”). The model fit outputs of biological significance were central peak of emission intensity (xc, yc) and the overall intensity of the emission, which was calcu-lated from the floor of the functional form (z0) and the peak intensity from this floor (A). The overall process of data collection and analysis for a single field on one treatment slide is summarized in Figure 2 (and in Supplemental Fig. S8).
The raw 2 data for both AR Se fields and EBT AR Se
fields fit the 2D Gaussian model (Fig. 3A, 3B; Supplemental Fig. S3A–S3D), and the model fit similarly across raw data sets within a treatment (Fig. 3C, 3D). This demonstrated that the model fit the most disparate treatments reasonably well (i.e., no treatment and EBT). We, therefore, compared treatment results at the model level instead of at the raw data level.
In order to determine if inter-slide variation would neces-sitate the use of multiple tissue sections per treatment, we compared multiple slides (non-serial sections) from the same tissue block for a sub-set of treatments: AR Se, EBT AR Se, NB AR Se and SB AR Se. We found that the intra-slide field variation was, at times, greater than the inter-slide field variation. Therefore, we considered a single tissue section heterogeneous enough to represent autofluo-rescence ranges expected for a given treatment on multiple sections cut from the same tissue block.
Steam Antigen Retrieval and Serum Application Have Minimal Effect on Tissue Autofluorescence
As we suspected from our visual review of images, model-ing and analysis revealed that AR and Se application did not impact the autofluorescence signature on otherwise untreated tissues across the channels analyzed: 470–670 nm
WLL, 458 nm and 405 nm excitations. Representative green wavelength tissue autofluorescence images for these four treatments are shown in Supplemental Figure S4A– S4D. 3D surface plots of representative model fits of the 2
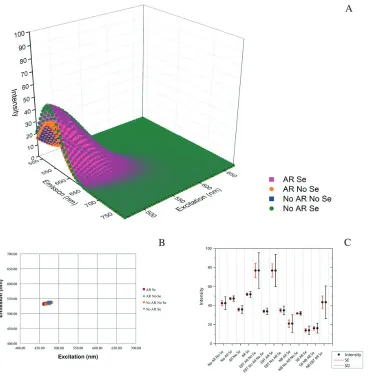
data for each of the four treatments—AR Se, No AR No Se, AR No Se and No AR Se— showed minimal variation in model fit (Fig. 4A). A scatterplot of xc vs. yc revealed that the central peaks of emission intensity were tightly grouped and overlapping for all four treatments; two model fits for all three fields from each treatment are shown (Fig. 4B). A box plot of intensity levels (sums of z0 and A) also showed overlap for these four treatments (Fig. 4C) consistent with the ANOVA results showing no statistical difference (Table 3). The increased intensity in the serum application surfaces seen in the representative model comparison (Fig. 4A) aver-aged out to no difference across all data sets (Fig. 4C; Supplementary Fig. S5A–S5D) and was therefore not sig-nificant (Table 3). Additionally, there was little variance in the central peak of the autofluorescence emission and inten-sity levels at 458 nm and 405 nm excitations (Fig. 5A–5D and Tables 4, 5).
Eriochrome Black T Shifts Tissue
Autofluorescence with Antigen Retrieval Only
We found the role of AR to be critical when using EBT but that serum application made no appreciable difference. 3D surface plots of representative model fits of the 2 data for
Diminishing FFPE Tissue Autofluorescence 413
Figure 2. 2 data collection and analysis process flow diagram. The flow chart depicts the entire analysis process that was followed
in this research. The process starts in the upper left hand corner with the creation of the treatment slides. Following the arrows leads to two different scanning processes that were used to analyze the slides. For each of the scanning processes, different assessments and evaluation techniques were employed. One scanning process created 2-dimensional data which was analyzed with line graphs and box plots of the maximum intensities. The other scanning process created 3-dimensional (3D) data. The scanning software itself produces several images and output arrays (the two right-most arrows out of “LAS AF 2 scans”) and the data were also analyzed by mathematical
414 Davis et al.
but no shift in those treated with EBT with no AR (Fig. 7C, 7D). Additionally, this right shift was an obvious shift from baseline for the EBT AR treatments; e.g., AR No Se vs. EBT No AR No Se vs. EBT AR No Se at both excitations (Fig. 7E, 7F).
Sodium Borohydride Dampens Autofluorescence Universally
As demonstrated in representative 3D surface plots, NB markedly dampened autofluorescence across the spectra, regardless of the presence of AR and Se (Fig. 8A). Moreover, AR and Se applications appeared to enhance this effect (Fig. 4C and Supplemental Fig. 6); however, this finding was not significant (Table 3). Although, the central peak of intensity did not move, grouping with AR Se (Fig. 8B), the change in mean intensity following NB treatment was sig-nificant, along with SB AR Se (see below) (Fig. 4C). These treatments grouped statistically separately from AR Se and
there was no significant difference in the two NB treat-ments’ groupings (Table 3). The line graphs of 458 nm and 405 nm excitation emissions also revealed decreases in autofluorescence (Fig. 8C, 8D) and the intensity averages for both NB treatments grouped together (Tables 4, 5).
Sudan Black B Quenches Autofluorescence, and Combined Treatments Yield Mixed Results
SB AR Se had a similar result as NB, with a greater mag-nitude of autofluorescence intensity change (Fig. 8E, 8B, and 4C). However, there was no significant difference between SB AR Se and the two NB treatments (Table 3). Similar changes to those above for NB were also seen with 458 nm and 405 nm excitations (Fig. 5C, 5D), where SB clearly lowered autofluorescence intensity more than that seen for any of the single treatments; yet it still grouped statistically with the two single NB treatments (Tables 4, 5). Finally, the excitation of the SB-treated Figure 3. Functional fit of 2 data to 2D Gaussian surfaces. Three-dimensional (3D) surface plots of raw 2 data fit to the 2-dimensional
Diminishing FFPE Tissue Autofluorescence 415
slide with an MP laser resulted in boiling of the SB during excitation, an effect not observed with the EBT- or the NB-treated slides.
Combining SB and NB was no better than either treat-ment alone while combining EBT and NB appeared to result in further dampening of autofluorescence compared with these treatments alone, albeit, this latter finding was not statistically significant, as NB EBT AR Se grouped con-sistently with NB AR Se (Tables 3-5).
Treatments Tried on Frozen Liver Show Similar Results, and Mouse and Human Lung Have Similar Autofluorescence Profiles