ISSN (Online) : 2319 - 8753 ISSN (Print) : 2347 - 6710
I
nternationalJ
ournal ofI
nnovativeR
esearch inS
cience,E
ngineering andT
echnology Volume 3, Special Issue 3, March 20142014 International Conference on Innovations in Engineering and Technology (ICIET’14)
On 21st & 22nd March Organized by
K.L.N. College of Engineering, Madurai, Tamil Nadu, India
Copyright to IJIRSET www.ijirset.com 265 ABSTRACt-The rising demand for electric power,
inadequate power generation and scarcity of transmission facilities forces the power system to be operated under stressed conditions. At heavily loaded conditions the power system must be provided with sufficient reactive power reserves in order to avoid voltage instability. Minimizing real power loss in transmission lines and the voltage deviation at the load buses in a power system is also essential. So optimization of reactive power plays a vital role in maintaining voltage stability and reducing real power losses of the power systems. In deregulated electricity market, reactive power provision needs to be made by Independent System Operator (ISO) in order to meet contracted transaction in a secure manner. So optimization of reactive power becomes essential in a deregulated power system environment because ISO chooses the optimum bidders based on real power cost characteristics and the reliability of power being delivered. In this paper reactive power flow problem is solved and Particle Swarm Optimization (PSO) technique is used for optimizing the values of generator voltage,transformer taps and switchable VAR sources. MATLAB is used for performing optimal power flow and formulating the algorithm for optimization of reactive power flow using PSO. IEEE-30 bus system has been used to evaluate the effectiveness of proposed system.
KEYWORDS-Reactive power management, Restructured power system,
I.INTRODUCTION
Main objective of a power system is to meet the connected load to the maximum extent with the available generation in a secure, economic and reliable manner. The load consists of both active and reactive components.
The transmission of power over AC circuits
involvesreactive components. The generation of power too contains the reactive participation. Hence it is
important and vital to monitor and controlreactive power resources and reactive power consuming elements to maintain proper voltages in the grid within safe and secure limits. Reactive power management thus forms the prime concern of power systems.The majority of the reactive power management objectives were to provide the least cost and less real power loss. Variants of this objective include the cost of real power losses, cost of VAR installation, voltage stability index and voltage deviation. However, the goal of RPM is to provide the system with efficient VAR compensation to enable the system to be operated under a balanced condition between security and economic concerns.Conventional power flow algorithms that were used in earlier days do not automatically minimize anyobjective functions such as fuel cost or real power transmission losses. They only obtain a single feasible solution. All the conventional methods have disadvantages such as time consumption, slow convergence, less accuracy, etc., and so the researchers moved towards intelligent techniques like Genetic Algorithm (GA), Simulated Annealing(SA), Tabu Search (TS), Particle Swarm Optimization (PSO), etc.,
In [1] optimal reactive power flow problem is analyzed using Back Propagation Neural Network in MATLAB. Results of this multi objective problem show that this method can be used for large power systems. Wei Yan [3] used a hybrid method based on GA and Interior Point Method (IPM). Ying Li [4] introduced a novel method in which Message Passing Interface based parallel computation and PSO algorithm were combined to form the Parallel Particle Swarm Optimization method for solving the Dynamic Optimal Reactive Power Dispatch problem. Optimization process is implemented on a
multi-processor supercomputer to reduce the
computational time drastically.Differential Evolution algorithm is used in [5] whereresults illustrate that in some cases even with reduction of losses, the impact on the stability is negative.
Power System Reactive Power
Optimization Using DPSO
Mahalakshmi.G
#1, Bhavani.M
*2#1PG Scholar, Department of Electrical & Electronics Engineering, Anna University Regional Office, Madurai,
India
A PSO based optimal reactive power flow management with the incorporation of TCSC is proposed in [7]. PSO is used to determine the best location for TCSC with a level of compensation being considered as it sometimes leads to worst solution. In [8], [9] Modified Immune PSO and Gravitational Search Algorithm are usedrespectively for solving the reactive power flow problem and results are compared with the performance of GA, BOX algorithm, DE and classical PSO.
LashkarAra [11] implemented Mixed Integer Non Linear Programming which is solved using ε-constraint method. General algebraic modeling system GAMS is used to solve the optimal model and MATLAB is used to feed parameters to the GAMS routineMandal 12] used a combination of Teaching Learning Based Optimization and Quasi Opposition Based Optimization which is known as QOTLBO both single and multi-objective functions are solved using IEEE 30 and IEEE 118 bus systems. Badar in [13] had optimized reactive power flow using dynamic PSO where active power loss is reduced by 20% and voltage profile is also improved.
The optimization techniques like GA, EA, PSO, Big Bang – Big Crunch (BB-BC) algorithm and EP are used for reactive power optimization problem in [3], [14], [15], [17] and the comparative results are shown. Though the existing methods show better results there are some drawbacks such as slowconvergence, worst solution, and violation of limits. To overcome these drawbacks the proposed method of this paper used dynamic PSO and Bacterial Foraging Algorithm which results in attainment of good result along with fast convergence rate.
II.REACTIVEPOWER MANAGEMENT
Reactive power management is one of the important tasks in the operation and control of the power system. Reactive power control problem can be formulated as a
non-linear constrained optimization problem.
Minimization of real power loss is the main objective of this reactive power optimization problem. However minimization of voltage deviation, real power cost and shunt reactor installation cost is also added to the objective function. The optimization part is solved by the PSO algorithm. The purpose of reactive power dispatch is mainly to minimize the real power transmission loss of the system and to improve the voltage profile while satisfying the unit and system constraints.The objective of this paper is to minimize the real power cost, real power loss, and reactive power source installation cost and voltage deviation of the IEEE 30 bus test system.
Minimize 𝐅 = 𝐧𝐢=𝟏 𝐚𝐏𝐆𝐢𝟐 + 𝐛𝐏𝐆𝐢+ 𝐜 + 𝐊𝐂𝐢𝐐𝐂𝐢+
𝐕𝐢+𝐕𝐢𝐬𝐩∗𝐏𝐅𝟏+𝐏𝐋𝐎𝐒𝐒 (2.1)
Where PGi : Real power generated at bus i QCi : Shunt power source at bus i Vi : Voltage magnitude of bus i Visp : Desired voltage at bus i
PLOSS : System loss
a,b,c : Cost coefficients PF1,PF2: Price penalty factor
In vertically integrated power systems reactive power facilities are operated under monopoly by the ISO to meet technical requirements such as improving voltage profile, reducing losses of transmission lines, etc., and so there is no clear competition for providing reactive power as ancillary services.In normal operation state, the reactive power balance must be kept in such a way that the voltages are within acceptable limits.
The inequality between reactive power generation and consumption does not exist and the reactive power generated and consumed is always equal. Therefore, an improper reactive power generation and consumption level in the system will result in inappropriate voltage profile.
Unlike the active power ancillary services (frequency control reserves), the reactive power cannot be transmitted efficiently through long distances because it leads to additional active and reactive power losses. The reason is that the large reactive impedance of the high voltage transmission system causes reactive power loss. So the reactive power generation and consumption have to be as close as possible to each other to avoid excessive reactive power transmission.Inderegulated power systems there is more space for a utility to act as an ancillary service provider unlike the vertically integrated power systems. So if a utility chooses to provide ancillary service then it has the responsibility to manage the reactive power flow effectively. As reliability, cheap tariff and uninterrupted power supply are the major motives of deregulated power system, optimization of reactive power flow is an important task to be done in order to satisfy the needs of customers and be profitable to the utilities also.
III.POWER FLOW EQUATIONS
Equality Constraints, Real power constraint
𝐏𝐆𝐢− 𝐏𝐃𝐢− 𝐕𝐣 (𝐆𝐢𝐣𝐬𝐢𝐧𝛉𝐢𝐣+ 𝐁𝐢𝐣𝐬𝐢𝐧𝛉𝐢𝐣) 𝐣≠𝟏
= 𝟎 𝐢 ∈ 𝐍
(2.2)
Where N : Number of buses except swing bus PGi : Real power generated at bus i PDi : Real power load at bus i
θij : Phase angle difference between bus i and j Gii : Self conductance of bus i
Bii : Self susceptance of bus i
Reactive power constraint
𝐐𝐆𝐢− 𝐐𝐃𝐢− 𝐕𝐢 (𝐆𝐢𝐣𝐬𝐢𝐧𝛉𝐢𝐣− 𝐁𝐢𝐣𝐬𝐢𝐧𝛉𝐢𝐣) 𝐣≠𝟏
= 𝟎 𝐢 ∈ 𝐍
(2.3)
Where N : Number of buses except swing bus QGi: Reactive power generated at bus i QDi: Reactive power load at bus i
Power System Reactive Power Optimization using DPSO
Copyright to IJIRSET www.ijirset.com 267 Bus voltage magnitude constraint
𝐕𝐢𝐦𝐢𝐧≤ 𝐕𝐢≤ 𝐕𝐢𝐦𝐚𝐱 𝐢 ∈ 𝐍(2.4)
Where N : Total number of buses Vimin,Vimax: Voltage limits at bus i Vi : Voltage magnitude of bus i
Generator bus reactive power constraint
𝐐𝐆𝐢𝐦𝐢𝐧≤ 𝐐𝐆𝐢 ≤ 𝐐𝐆𝐢𝐦𝐚𝐱 𝐢 ∈ 𝐍𝐏𝐕, 𝐍𝟎 (2.5)
Where NPV : Number of PV buses N0 : Swing bus
QGimin,QGimax : Reactive power limits of generator at bus i
Reactive power source capacity constraint 𝐐𝐂𝐢𝐦𝐢𝐧≤ 𝐐𝐂𝐢 ≤ 𝐐𝐂𝐢𝐦𝐚𝐱 𝐢 ∈ 𝐍𝐂(2.6)
Where NC : Number of reactive power sources QCi : Reactive power source at bus i
QCmin,QCmax : Reactive power source limits
Transformer tap position constraint
𝐓𝐢𝐦𝐢𝐧≤ 𝐓𝐢≤ 𝐓𝐢𝐦𝐚𝐱 𝐢 ∈ 𝐍𝐓(2.7)
Where NT : Number of tap setting transformers Timin,Timax : Tap position limits
Ti : Tap position at transformer i
IV.PARTICLE SWARM OPTIMIZATION
Particle Swarm Optimization is one of the AI techniques, inspired by the social foraging behavior of some animals such as flocking behavior of birds and the schooling behavior of fish. Particles in the swarm fly through a space of solutions. Particles follow the fittest member of the swarm and generally biasing their movement toward historically good areas of the provided space. To have all the particles being located in the optimal position in a multi-dimensional hyper-volume is the goal of this optimization technique. This is achieved by initiallyassigning random positions to all the particles in the provided space and small initial random velocities. On executing the algorithm the position of each particle is advanced based on its velocity, the best known global position in the problem space and the best known individual position of a particle. The objective function is evaluated after each position update.
In this paper PSO had been used to optimize the values of control variables (generator voltage, transformer tap position and shunt reactor rating) and these are defined as the particles of PSO.Each particle tries to modify its position using the following information:
Current positions,
Current velocities,
Distance between the current position and pbest,
Distance between the current position and gbest.
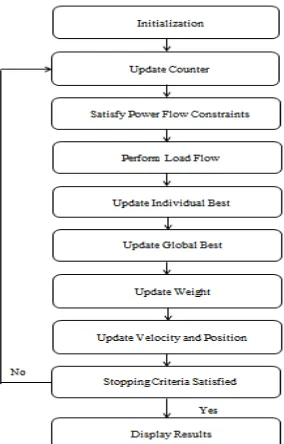
Minimum and maximum values for control and state variables are set and random particles are generated. The counter is initialized to 1 and it is incremented each iteration. Power flow constraints are verified. OPF is executed for each and every particle using Interior Point
Algorithm in MATPOWER4.1. This gives the values of active power loss, voltage deviation, real power cost and VAR installation cost which will be added to get the value of objective function or the fitness value for each particle.
The individual best is updated for better fitness value of a particle. After updating all individual best, the global best is also updated. Based on the values of individual best, global best and random velocities, each particle is assigned a new position. On the end of iterations the results are displayed.The movement of the particle is governed by updating its velocity and position attributes. The velocity of particle is updated as,
𝒗𝒊 𝒕 + 𝟏 = 𝒘𝒊 𝒕 + 𝒄𝟏× 𝑹𝟏( ) × 𝒑𝒊𝒃𝒆𝒔𝒕− 𝒑𝒊 𝒕
+ 𝒄𝟐× 𝑹𝟐( ) × 𝒑𝒈𝒃𝒆𝒔𝒕− 𝒑𝒊 𝒕
+𝒄𝟑× 𝑹𝟑( ) × 𝒏𝒃𝒆𝒔𝒕(4.1)
Where vi(t + 1) : the new velocity for the i th
particle, c1, c2,c3 : acceleration factors
pi(t) : ith particle’s position at time t
pibest :ith particle’s best known position
pgbest : best position known to the swarm.
nbest :previous best experience of the best
nearest neighbor
𝒏𝒃𝒆𝒔𝒕=
𝑭𝒊𝒕𝒏𝒆𝒔𝒔(𝑷𝒋)−𝑭𝒊𝒕𝒏𝒆𝒔𝒔(𝑿𝒋)
𝑷𝒋−𝑿𝒋 (4.2)
The R1, R2, R3 function generates a uniformly random variable ∈[0, 1]. Variants on this update equation consider bestpositions withina particles local neighborhood at time t.Nowthe particle’s velocity update is influenced by
Previous best experience, pbest of the panicle.
Best global experience, gbestconsidering the best
Previous best experience of the “best nearest” neighbor pbest of all panicles, nbest
A particle’s position is updated using
𝒑𝒊 𝒕 + 𝟏 = 𝒑𝒊 𝒕 + 𝒗𝒊 𝒕 (4.3)
Where pi(t+1) : new position of the ith particle
pi(t) :ith particle’s position at time t
vi(t) :ith particle’s velocity at time t
The weights that change on each iteration is given as
𝒘𝒊+𝟏= 𝒘𝒊−𝟎.𝟒 ×(𝒈𝒔𝒊𝒛𝒆−𝒊) 𝒈𝒔𝒊𝒛𝒆+𝟎.𝟒 (4.4)
Where w(i+1): updated weight
wi: weight at ith iteration
gsize:number of generations for which the algorithm is
TABLE IPARAMETERS USED IN DPSO
S.No Parameter Value
1 Population size 30
2 Number of iterations 100
3 Acceleration constant (C1, C2, C3)
2.1, 2.0 and 2.0
4 Constriction factor 0.729
5 Max. and Min. inertia weights Adaptive
6 Max. and Min. velocity of
particles
executed
The parameters being used in the DPSO algorithm have to be predefined. Initial value of weight is defined as one. However as the weight is dynamic in DPSO it changes in every iteration based on the equation.
Fig.1Flowchart for reactive power optimization using PSO
TABLE III CONTROL VARIABLES
VI.RESULTS
Effectiveness of the proposed method has been tested using the standard IEEE 30 bus test system. Implementation of this method is done using MATLAB 2012 and MATPOWER 4.1 programs for performing optimal power flow. Line data and bus data are taken from [9] to perform optimal power flow. The limit of control variables is shown in Table II.
Table III shows the values of the control variables generator bus voltage, transformer tap ratio and shunt reactor capacity at initial state and after optimization. From Table III it is clear that the optimized values of all the control variables reside within their corresponding limits. It has been observed that better results are obtained on setting these optimized values of control variables.
The value of objective function is reduced on using these particular values. As well as real power loss, voltage deviation and real power cost are also reduced individually.
Control Variables Initial State Optimized Values
Vg1 1.0600 1.0092
Vg2 1.0600 1.0113
Vg5 1.0600 1.0129
Vg8 1.0600 1.0157
Vg11 1.0600 1.0396
Vg13 1.0600 1.0378
T6-9 1.0780 0.9836
T6-10 1.0690 0.9502
T4-12 1.0320 1.0059
T27-28 1.0680 0.9795
Q10 0.0045 0.2494
Q12 0.0000 3.6553
Q15 0.0000 3.8246
Q17 0.0000 3.7687
Q20 0.0000 4.3981
Q21 0.0000 4.3631
Q23 0.0000 2.5524
Q24 0.0000 2.2793
Q29 0.0000 2.4531
Control Variable
Lower limit Upper limit
V1 0.95 1.1
V2 0.95 1.1
V5 0.95 1.1
V8 0.95 1.1
V11 0.95 1.1
V13 0.95 1.1
T11 0.90 1.1
T12 0.90 1.1
T15 0.90 1.1
T36 0.90 1.1
Qc10 0.00 5.0
Qc12 0.00 5.0
Qc15 0.00 5.0
Qc17 0.00 5.0
Qc20 0.00 5.0
Qc21 0.00 5.0
Qc23 0.00 5.0
Qc24 0.00 5.0
Qc29 0.00 5.0
Power System Reactive Power Optimization using DPSO
Copyright to IJIRSET www.ijirset.com 269
Fig.2 Convergence characteristics of objective function
Fig.2 shows the characteristics of objective function for the settings of optimized values of control variables. The value of objective function is reduced from 19504$/hr(base case) to183505$/hr(Dynamic PSO).
Fig.3 Convergence characteristics of real power loss
Fig.3 shows the characteristics of real power loss which is reduced from 9.507MW to 8.7623MW after using the optimized values of control variables.
Fig.4 Convergence characteristics of voltage deviation.
The above graph plotted for iterations and voltage deviation shows that there is a reduction in voltage deviation is reduced to 0.03V.Though the reactive power control and voltage control are difficult to perform simultaneously in this paper both the power loss and voltage deviation are reduced concurrently.
Fig.5 Convergence characteristics of real power cost
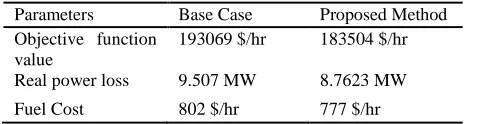
TABLE IV
RESULTSOF BASE CASEAND PROPOSED METHOD
Results obtained before and after optimization are shown in TABLE IV. Results of base case power flow are taken into account to evaluate the effectiveness of the proposed method. The convergence graphs Fig.2, Fig3, Fig.4, Fig.5 and TABLE IV clearly indicate that the objective of this paper is achieved.
V.CONCLUSION
The proposed method has been implemented using IEEE 30 bus system to evaluate the performance of it. From the results it is seen that the objective function value, real power loss and real power cost have been reduced by 4.9%, 8.4% and 3.1% respectively on comparing with the base case results. Voltage deviation is also reduced to an acceptable value. It is clear that as the real power loss is reduced and voltage deviation is controlled, usage of reactive power is optimized using Dynamic PSO.
REFERENCES
[1] Jalal M. Abdallah and Abdullah R. Al-Zyoud, “Voltage and Reactive Power Control Simulations Using Neural Networks”, IJSSST, 2000, Vol. 10, No. 4
[2] Farahani,MehdiNikzad, “ Using Tabu Search for Reactive Power Planning in Power Systems”,International Journal of Natural and Engineering Sciences,2011,Vol5.pp 57-60
[3] Wei Yan, Fang Liu,” A Hybrid Genetic Algorithm–Interior Point Method for Optimal Reactive Power Flow”, IEEE Transactions on Power Systems, 2006, Vol. 21, No. 3,1163-1169
[4] Ying Li, Yijia Cao, “Dynamic Optimal Reactive Power Dispatch Based On Parallel Particle Swarm Optimization Algorithm”, Elsevier, Computers and Mathematics with Applications, 2009, 1835-1842
[5] Juan M. Ramirez, Juan M. Gonzalez, “An Investigation About The Impact of The Optimal Reactive Power Dispatch Solved by DE”, Elsevier , Electrical Power and Energy Systems, 2011, 236–244 [6] P.R.Sujin, Dr.T.Ruban Deva Prakash, “Particle Swarm
Optimization Based Reactive Power Optimization”, Journal Of Computing, 2010, Vol 2, pp 73-78
[7] S.Sakthivel ,D.Mary.”Particle Swarm Optimization Algorithm for Voltage Stability Enhancement by Optimal Reactive Power Reserve Management with Multiple TCSCs”,International Journal of Computer Applications,2010, Vol. 11, No.3 19-27
[8] DingPing LI, GuoLiang SHEN, “Power System Reactive Power Optimization Based on MIPSO “, Elsevier, Energy Procedia, 2011, pp788 – 793
[9] Duman and Guvenc, “Optimal Power Flow using Gravitational Search Algorithm”, Elsevier, 2012, pp 86-95.
[10] PianZhaoyu, Li Shengzhu, “The Application of Adaptive PSO in Power Reactive Optimization”, Elsevier, Proceedia Engineering, 2012, pp 747 – 753
[11] A.LashkarAra, A.Kazemi, “Optimal Reactive Power Flow Using Multi-Objective Mathematical Programming”, Elsevier, ScientiaIranica, 2012, pp 1829-1836.
[12] BarunMandal, Provos Kumar Roy, “Optimal Reactive Power Dispatch Using Quasi-Oppositional Teaching Learning Based Optimization”, Elsevier, 2012, pp 123-134
[13] Altaf Q.H. Badar, B.S. Umre, “Reactive Power Control Using Dynamic Particle Swarm Optimization for Real Power Loss Minimization”, Elsevier, Electrical Power and Energy Systems 2012, pp 133–136
[14] Kwang. Y. Lee, “Optimal Reactive Power Planning Using Evolutionary Algorithms: A Comparative Study for Evolutionary Programming, Evolutionary Strategy, Genetic Algorithm, and Linear Programming”, IEEE Transactions on Power Systems, Vol. 13, No. 1
[15] S. Sakthivel, M. Gayathri, V. Manimozhi, “A Nature Inspired Optimization Algorithm for Reactive Power Control in a Power System”, International Journal of Recent Technology and Engineering, 2013, Vol.2, No.1, pp 29-33.
[16] ThanmayaPeram, KalyanVeeramachaneni and Chilukuri K. Mohan, “Fitness-Distance-Ratio Based Particle Swarm Optimization”, IEEE, 2003
Parameters Base Case Proposed Method
Objective function value
193069 $/hr 183504 $/hr
Real power loss 9.507 MW 8.7623 MW