SpecWare 9
Pro and Basic Software
PRODUCT MANUAL
Item #’s
3654P9, 3654P9U, 3654P9X,
3654B9, 3654B9U, 3654B9X
CONTENTS
1. Computer Interface
1.1 Software License Agreement 4
1.2 Software Installation/Upgrading from a Prior Version of SpecWare 5
1.3 Testing the Com Port 6
2. Specware Interface
2.1 Preferences 7 2.2 Toolbar 12 2.3 File Menu 133. Logger Communications
3.1 WatchDog Manager 143.3 Launching/Configuring Stations with the WatchDog Manager 19
3.4 Logger Menu 21
3.5 Downloading Original WatchDog Data Loggers 22
3.6 Launching Original WatchDog Data Loggers 23
3.7 Real-Time Weather Monitor 25
4. Data Management
4.1 Data Management 27
4.2 Opening Files 28
4.3 Saving Data 29
Using Data in Other Applications 29
4.4 Converting Archived Data into the Current SpecWare Format 30
4.5 Importing Data 31
5. Tools
5.1 Tools Menu
35
5.2.1 Select Report
35
5.2.2 Where and When
36
5.2.3 Options
36
5.2.4 Forecast
37
5.2.5 View Report
38
5.3 Standard Reports
39
5.3.1 Degree Days
39
5.3.2 Chill Hours
40
5.3.4 PAR Light DIF/DLI
41
5.3.5 Temperature/RH Hours
41
5.3.7 Day, Month, or Year Summary
42
5.3.8 NOAA/Irrigation Report
43
5.4 Custom Reports
44
5.5 Disease and Insect Models
47
5.6 Evapotranspiration
48
5.3.3 Leaf Wetness Hours
40
5.3.6 Soil Temperature Hours
42
5.2 Reports
35
Copyright The SpecWare software product (SOFTWARE) is owned by Spectrum Technologies, Inc. and is protected by United States copyright laws and international treaty provisions and all other applicable national laws. You may not copy the user documentation accompanying the software without Spectrum’s permission.
Grant of License This license agreement permits you to use one copy of the enclosed version of the SOFTWARE on a single computer and make one copy for archival purposes.
Other Restrictions You may not reverse engineer, decompile or dissemble the software.
Support Support for the SOFTWARE is provided by the company that sold you the software.
No liability for consequential damages To the maximum extent permitted by applicable law, in no event shall Spectrum Technologies or its suppliers be liable for any direct or indirect damages whatsoever, arising out of the use or inability to use this product. In any case, Spectrum and its supplier’s entire liability is limited to the amount actually paid by you for the SOFTWARE.
IMPORTANT: The disease and insect models used by SpecWare have been validated by state university plant pathologists for the regions of the United States in which they were developed. To determine the validity and appropriate use of a particular disease model for your specific growing region, please consult with your State Agricultural Extension S
ervice.
System Requirements
SpecWare requires a 486 (or better) processor with at least 8 megabytes of RAM running Windows 95 or better. Windows 2000 or later is required for operations that require auto-scheduling (Autodownload, Frost alerts, and web publishing). You will also need a mouse and a free serial port to connect the
logger to the computer. SpecWare requires a screen resolution of at least 640x480. If the screen resolution is only 640x480, then the Windows Taskbar Properties must be set to "Auto hide" so SpecWare can use the bottom 1/2" of the screen. To change the Taskbar Properties, right-mouse click on any empty area of the Taskbar (the gray bar at the bottom of the screen). Click on "Properties." Ensure that "Auto hide" has a check mark next to it. When "Auto hide" is checked, it is generally recommended that "Always on top" also be checked. Click "OK" to save any changes.
Installing SpecWare on a Hard Drive
To install SpecWare software onto your hard drive, insert the SpecWare CD into the appropriate drive of your computer and follow the on-screen instructions. If auto-start is not enabled on your computer, select Run from the Start menu and type D:\setup (Substitute the appropriate drive letter for your CD or floppy drive.) The default location for program installation is C:\Specware, but you can specify a different location if desired.
Connecting to Your IBM Compatible
The logger is connected to your computer with an interface cable. The PC-3.5 cable is designed to connect directly between the IBM compatible’s DB-9 (9-pin) serial port and the data logger. A USB-Serial adapter (available from Spectrum or at your local computer store) may be needed if your computer does not have an available DB-9 port.
Upgrading from Prior SpecWare Versions
If you have SpecWare version 6 or earlier already installed on a given computer, it is recommended that SpecWare 9 be installed in the same directory as the existing version. Multiple versions of SpecWare can co-exist without interfering with one another. Data files from earlier versions must be imported into SpecWare 9 before they can be viewed and manipulated. SpecWare cannot convert SpecWare 9 data files to a format compatible with earlier versions.
1.3 Testing the Com Port
Identifying the Correct Com Port
The computer Communications Port to which the PC interface cable is connected can be identified by using a paper clip. This test is performed with the cable disconnected from the logger.
1. Go to the Communications tab of the Preferences screen (see p. 8).
2. Select the com port to be tested and click on the Test Port button. If the message “Connection OK” is displayed, another device (such as a modem) is probably connected to that port. If the message “No Connection” is displayed, this port may be the one connected to your serial cable and you can proceed to the next step.
3. Place the smallest side of a standard size paperclip (about 1 3/8” long) on the end of the serial pin so that it touches BOTH the tip of the pin and the metal area between the two black rings. Again click on the Test Port button. If the message “Connection OK” now appears, this is the com port connected to your serial cable.
NOTE: The original data loggers do not short-circuit the serial pin. Therefore, when the Test Port button is clicked while the logger is connected, a “Bad Data Returned” message will be displayed.
Testing a Connection to a 1000 or 2000-Series Logger or Station
In addition to testing the PC interface cable, the connection to a 1000 or 2000-Series logger or station can easily be checked by plugging the cable into the station’s data port and hitting the
2000 button in the Preferences screen. Refer to the Communications tab of Preferences
screen p. 8).
USB-Connection
With newer personal computers, an RS-232 serial port may not be available. If you cannot es-tablish communication with the serial port, a USB-RS232 serial port adapter (item # 3661USB) is the best option. The adapter requires a driver to be installed on your machine and will work out of a different Com Port than the RS-232 port.
2.1 Preferences
Preferences must be specified when the software is first installed to allow the computer, the software and the data logger to work together harmoniously. The Preferences screen can be accessed from the File Menu option (See p. 13). The Preferences screen is divided into 5 separate tabs: General, Communications, Data Storage, Graph and Monitor. Features not available in SpecWare Basic appear grayed out.
General
Units
Allows you to choose whether data output is in English or Metric units.
Degree Day Calculations
The degree day calculation method specified here will be used in the reports and the insect and disease models. The Actual Degree Day Method calculates degree days using the temperatures from each logged interval. The Single Sine Method applies a smooth sine curve to estimate degree days using the daily high and low temperatures. The Growing Degree Day Method
considers only the high and low temperatures for the day to compute the total number of degree days acquired (See
Degree Days, p. 39).
Location (for ET Calculation)
T h e e v a p o t r a n s p i r a t i o n a l g o r i t h m incorporates specific information on weather
station location. Enter latitude and altitude information in the appropriate boxes. Integer values of latitude and longitude will give sufficient accuracy.
Growing Season Begins in Month
SpecWare allows you to produce graphs and reports at the user-defined beginning of the growing season. To correctly compute reports for an entire growing season, it must also know whether or not the season spans 2 calendar years. This is relevant mainly for growers in the southern hemisphere. Entering the month when the growing season begins allows SpecWare to make any necessary adjustments.
Dew Point
Dew point will automatically be selected and its data will be saved along with the Temp and RH.
Device Support
All of the devices supported by SpecWare by default will be selected, unless otherwise directed by Spectrum support.
Date and Time Display
The date/time displayed on graphs can be in U.S. or international format. 24- and 12-hour clock format must be selected as well as whether the date will be shown in standard format or as a Julian Date.
Language
If the Spanish-language version has been activated, the language option to be used is selected here.
Communication
Direct Connection
Allows you to select the port that SpecWare will use to communicate with the logger. It also allows you to test the connection to a 2000-Series station. You must select the communications port connected to your serial cable (See Testing the Com Port, p. 6)
A-Series Loggers
Allows you to select the port that SpecWare will use to communicate with A-Series logger. It does not use the standard gray PC interface cable that accompanies SpecWare Software. Instead, use the A-Series PC Connection Cable. This cables is a serial USB cable and requires that you install its USB driver prior to use.
Wireless
Allows you to select the port that SpecWare will use to communicate with a WatchDog Weather Station connected via a wireless connection. In most cases, this will be the same port that connects to the gray direct connection cable.
Modem Dial-Out
If you are connecting to the weather station via telephone, the Port field is used to select the Com Port associated with your computer’s internal modem. The Modem Initialization String
field is set to a common default string. Two of the more complete sites on the internet for modem information (including initialization strings) are www.modemhelp.org or www.modemhelp.net. Please reference these for other brands if the default string does not help.
Specify whether dialing is via touch-tone or pulse. Touch-tone is generally the correct option, though some phone systems use pulse dialing to minimize costs. If you hear a long series of clicks after dialing, you will need to specify “pulse” dialing.
The Wait after Connect time should generally be left as zero (the default). If the modem seems to connect, but the weather station connection fails, try setting the delay to 1 (second) to allow the modems time to finish handshaking before they are asked to
transmit data.
Advanced Features
In general, you should not be changing any parameters on the Advanced options page.
Direct Connect
In the Advanced Options, Hardware Flow Control RTS should be checked, unless you are connecting to the weather station via a Short-Range Modem Pair. The Slowdown factor
should be kept at 100% unless otherwise directed by Spectrum support. USB should be checked if you encounter problems with a USB-to-Serial conversion more reliable. The USB
checkbox slows down communication slightly in order to make the USB to Serial conversion more reliable.
Download Options
Allows you to specify how the software handles the data downloaded from the WatchDog loggers or shuttle (See
Downloading Original WatchDog Data Loggers, p. 22). The options are Normal, Auto Download for Shuttles only or Auto Download for all loggers. The Auto Download options retrieve the data from the loggers or shuttles and automatically save the data to the appropriate, already-created Logger Locations(s) (See pp. 27 and 29). By checking the Auto Relaunch after Auto Download box, the previously used name and recording interval are retained during the automatic launch. All
Auto options proceed without user intervention.
NOTE: Its recommended that you choose
Normal and confirm each step of the
download, save, and relaunch process until you are familiar with how the software manages data and the data logger. This option does not apply to 2000-series weather or mini stations.
Com Port Open
The power-saving features on some PCs (especially laptop computers) will power down the serial port until it is needed. The delay in the power-up can hinder SpecWare’s ability to communicate through the Com Port. The Always option tells SpecWare to open the serial port and keep it open until the software is closed. This option, however renders the Com Port unavailable for Alert and AutoDownload function until SpecWare is shut down. This situation is remedied by selecting the Fast or Pause options. For PCs that do not have energy-saving features, the Fast option tells SpecWare to immediately begin communication through the Com Port as soon as it is opened. The default option, Pause with a delay of 1 second, provides a compromise solution with minimal delay while still functioning properly on almost all PCs. The number of seconds to pause can be changed if necessary.
Data Storage
Data Folder Location
Initially displays the directory where SpecWare was installed and where
Logger Location directories are being saved. The default storage location is in the SpecWare directory. This screen also allows you to specify whether or not data can be saved to diskettes (See Saving Data, p. 29).
Data File Locations
In this section, you can decide whether or not to limit the length of Logger Location names.
Palm Shuttle Hotsync File Location
When a Palm Pilot is used to download loggers in the field, SpecWare will remember the first location where Hotsync files are stored. If you want to change the Hotsync file storage location, press the Reset Location button and enter the new location in the field. Check the box if you want these files automatically deleted after they have been imported. Deletion will prevent files from being imported multiple times to SpecWare.
Graph
Initially Display
In this section, the user can select the 2 d e f a u l t p a r a m e t e r s t h a t a r e automatically graphed. If nothing is checked then the user must select the parameters to be graphed every time a file is opened.
Within Intervals
If the redisplay interval is longer than the measurement interval, SpecWare can display the mean value of all included data points (Display Mean) or the actual data point closest to each of the given time points (Display Closest).
Limits
For each graphed parameter, the user can specify the data range for the
vertical axis. By default, the software will set the range based on the maximum and minimum values in the data set. But, for example, it may be desirable to have the horizontal axis pass through zero rather than the minimum data value. To set a maximum or minimum, select parameter of interest from the menu, enter the desired values and click the Change button.
Appearance
Show X (Vertical) grid lines
This will cause vertical lines to appear on the graph at regular intervals.
Show Y (Horizontal) grid lines
This will cause horizontal lines to appear on the graph at regular intervals.
Show Both X and Y Cursor Lines
Checking the box will add a horizontal tracker bar to the graph when it is displayed (See View, Print, and Edit Menus, p. 32).
Mark Points on Printed Graphs
If this box is checked, SpecWare will put individual data points onto the graphed line.
Data Redisplay Intervals
A Default Interval can be specified when displaying a graph from saved data files (the initial default is 60 minutes). SpecWare can graph a maximum of 8000 points, and the interval between data points depends on the time period displayed. A Minimum Interval can also be specified (the initial default is 15 minutes). This should be set to match your normal logger recording interval. Setting the Minimum Interval to the interval at which data was recorded prevents SpecWare from graphing more data points than you actually measured. This should be set to match your normal logger recording interval. For example, using data that was recorded every 30 minutes to create a graph that has a 15 minute Minimum Interval will cause SpecWare to display two points on the graph, 15 minutes apart, to represent the single recorded data point. In this case, specifying a 30 minute Minimum Interval will make the graph and text data display match your recorded data. (See View, Print, and Edit Menus, p. 32).Change button.
Monitor
This screen is used to configure your computer to automatically read and process a weather station’s current conditions. This feature uses the Windows AutoScheduler and requires Windows 2000 or greater to run.
Weather Station Real Time Monitor
Weather stations with continuous direct connections have the ability to create a separate log file using the Weather Monitor Program. This file is separate from the data recorded in the data logger. This program will only log while the Weather Monitor Program is running (See Advanced Features manual for more details).
2.2 Toolbar
After starting SpecWare, the menu bar will initially offer File, Logger View and Help menu options. The quick-buttons, from left to right, are Exit SpecWare, Open File, Save Logger Data, WatchDog Manager, Launch/Set Propertes for WatchDog 1000 or 2000, Get data from WatchDog 1000 or 2000 Series, Launch a WatchDog A-Series Logger, Get data from a WatchDog A-Series Logger, Launch Original WatchDog Logger, Get data from Original WatchDog Logger, Shuttl, (Original) Weather Station Monitor, View Logger Data as Text, Reset Zoom, Zoom Out, Change Graph Parameters and specify Large/Small Toolbar Buttons.
After a file is opened or a logger is downloaded, the Edit, Print, and Tools menu
options will appear and the View Data as Text and Change Graph Parameters quick-buttons will be activated.
Two additional quick-buttons, Reset Zoom and Zoom Out, will be activated if the graph zoom feature is used (see pp. 33-34).
Open File: Allows the user to open previously saved data files.
Save File: Allows the user to save data to a Logger Location if one is not chosen immediately after downloading a data logger.
Import Files:
♦ Importing PDA Shuttle File: Allows the user to import data files collected remotely by a portable, handheld computer. Contact Spectrum Technologies for information obtaining the software required for this option.
♦ Importing Raw Data File: Imports and interprets data files collected using SpecWare diag-nostic tools.
♦ Convert SpecWare v 3-6: Converts data from SpecWare versions 3 through 6 to a format usable in SpecWare (See Converting Archived Data into the current SpecWare Format
pg. 30).
♦ Import Generic Weather Data Files: This option allows you to import data files created by other weather collecting systems.
♦ Import WeatherLink Data Files: This option imports data collected using WeatherLink Software.
Preferences: Allows the user to select various graph, communication, data storage, and gen-eral configuration options (see Preferences p. 7)
Exit: This terminates the SpecWare session.
Introduction
The WatchDog Manager screen is brought up with the quick button on the SpecWare toolbar (see Toolbar, p. 12) or from the Logger menu (p. 21). SpecWare software divides the Watch-Dog family of data loggers into 4 categories; 1.) 1000 or 2000-Series Logger or Stations, 2.) Original WatchDog loggers (100/200/400 series mini data loggers and 525 - 900ET weather stations), 3.) Button loggers, and 4.) A-Series Loggers (WatchDog Model A110/125/130/150 Data Logger). For the sake of brevity, in this section, the term “station” will refer to all types of WatchDog products unless a specific type of WatchDog data logger is being referred to explic-itly. The WatchDog Manager screen can be used with all 4 types of loggers but it must be used for all communications with a remote weather station via a telephone modem or with mul-tiple stations connected via a wireless multi-point setup. This screen allows you to download and relaunch a specific station as well as add and delete a station to your network.
It is possible that you will have Logger Locations available in SpecWare that do not appear in the WatchDog Manager screen. The WatchDog Manager screen is only used to communi-cate with stations. It is not used for viewing existing data files (See Opening Files, p. 28). De-leting a station will have no effect on data that has already been downloaded and saved from that station. Likewise, establishing a new station will not automatically create a Logger Loca-tion. A Logger Location will be created when that station is first downloaded.
Generic Station Options
The last 4 options in the WatchDog Manager screen’s list of stations are generic options. The generic options are shown in parentheses. They do not refer to a specific station but rather to
3.1 WatchDog Manager
each of the 4 logger categories (1000 or 2000-Series, Original, Button and A-Series). The ge-neric option allows you to establish contact with a station even if you don’t know its name. Af-ter selecting a generic option, you can then perform any operation available for that logger type. SpecWare is able to read the name of the station from its electronic header and carry out readout, relaunch and reconfiguration operations as if that station had been selected explicitly from the list of available stations in the WatchDog Manager screen (see Fig. 1). If you are downloading a station whose name is not on the list of stations, SpecWare will ask if you want to add that station to the list.
WatchDog Manager Toolbar Buttons New Station
The New Station button is used to add stations to the list of available stations. After clicking this button, a blank WatchDog Properties screen will appear (see Properties section below for details).
Delete Station
This button allows you to delete an existing station from the list of available stations. Even af-ter a station has been deleted, data downloaded from that station will be available from the SpecWare Logger Location directory.
Autodownload Scheduler
This button allows you to bypass the WatchDog Properties screen and go directly to the
AutoDownload Scheduler screen (see Advanced Features manual). Get Current Conditions
This option will bring up the WatchDog Real-Time monitor (see Real-Time Monitor, p. 25). This option is only available for WatchDog weather stations and 1000 or 2000-Series weather or mini stations that are in contact with the PC via a direct-connection, radio- or telephone con-nection. This option is grayed out for WatchDog button loggers and A-Series loggers.
Relaunch Only
Click this option if you want to launch a station without first downloading the data. This option may be desirable if the station is being put back into service after a period of being idle. The station will be launched with the same configuration it had the last time it read data. This op-tion is grayed out for the 1000 or 2000-Series logger or staop-tions because their data logging function is not interrupted by a download so the station never needs to be relaunched.
Readout or Readout and Relaunch
This button is used to download data from a station. For Original, Button-style and A-Series WatchDog data loggers, this option will appear as Readout and Relaunch. For the 1000 or 2000-Series logger or station, this option will appear as Readout. The data is saved to the
Logger Location that matches the logger name. If this location does not exist, SpecWare will prompt you before creating it. Original, Button-style and A-Series loggers are relaunched with the same configuration they had when they were downloaded. With the WatchDog Manager, it is not possible, during the download process itself, to create a new location where data
should be saved. Data will always be saved to the location defined by the station name. Exit
Exits the WatchDog Manager screen. Properties
The Properties button brings up the WatchDog Properties screen. This screen is the gate-way to all the WatchDog Manager configuration functions. It is used to configure a new sta-tion or to edit the configurasta-tion of an existing stasta-tion. No configurasta-tion changes on this partial screen will be transferred to the station until the fully expanded WatchDog Properties screen (see More button, p. 19) has been brought up and the OK button has been pressed. The op-tions for this screen are described below.
Logger/Station Name
Enter the name of the Logger Location where data will be saved. When creating a new sta-tion, this field will initially be blank. A name can only be entered for new stations. The name of an existing station cannot be changed. To change the name of an existing weather station or logger, a new station must be created with the new name. This name will then be transferred to the logger header. Caution must be exercised when changing the name of an existing sta-tion because all subsequent downloads of the stasta-tion will be saved to a new Logger Location
and it is possible all data will be erased (see Clearing Data from a 2000-Series Station, p. 18). The old station name will still be visible in the list of available stations. If the name change is permanent, this old station (not the Logger Location) can be deleted from the list of stations.
WatchDog Type and Connection Type
Select the appropriate options on this screen. For the 1000 Series, Original, Button and A-Series loggers, changes in logger configuration can only be performed with loggers that are directly connected. 2000-Series stations can be reconfigured through phone or radio connec-tions as well. Configuration of remote staconnec-tions can be most easily handled by directly connect-ing them to the PC and usconnect-ing the Generic Direct-Connect options (See Generic Station Op-tions, p. 14) That way the existing connection info is not changed.
Number
If you are using a dial-out modem, enter the phone number in the text box. When entering a telephone number, be sure to include any additional, preceding digits required by your phone system. When using the wireless transceivers, enter the radio address in the Number text box. For 2000-Series weather or mini stations, the radio address is the same as the serial number of the station. If sending data to SpectrumWeather.com enter the 9 digit model and serial number of your station.
AutoDownload Schedule button
Brings up the AutoDownload Scheduler screen (see Advanced Features manual).
Alert Schedule button
Brings up the Weather Station Alert Configuration screen (see the Advanced Features
manual).
More button
Clicking the More button causes SpecWare to initiate communication with the station. The
WatchDog Properties screen is then expanded to display specific details about the station’s logging configuration (see Launching/Configuring Stations with the WatchDog Manager, p. 19). The expanded screen can only be brought up when a station is connected to a PC. A 1000 Series, Original, Button or A-Series logger cannot be configured or launched with a radio or telephone connection.
3.2 Clearing Data from a
2000-Series Station
Data is not routinely erased from the memory of a 2000-Series station. If you are moving the logger from one location to another and want to delete the station history without deleting the station, you can do so by going to WatchDog Manager and highlighting the appropriate sta-tion.
Click on the Advanced button, then on the Clear button. The following screen will appear:
Click the OK button.
SpecWare will begin erasing data. The process will take several minutes and, at this point, cannot be reversed. It is not necessary for the station to be connected to the computer once the erasure process has begun
Click OK, exit out of the Advanced Communications feature by clicking on the Exit button. SpecWare will return to the WatchDog Properties screen.
3.3 Launching/Configuring Stations
with the WatchDog Manager
WatchDog 1000 or 2000-Series and A-Series loggers, can be re-configured through the
WatchDog Properties screen of the WatchDog Manager, or the Launch/Properties toolbar button. These stations are not launched and relaunched like the original WatchDog data log-gers. Original WatchDog data loggers and weather stations can be launched through the
WatchDog Manager as well as through the Logger menu or toolbar quick buttons (see
Launching Original WatchDogLoggers, p. 23). The WatchDog Manager screen is brought up with the quick button on the SpecWare toolbar (see Toolbar, p. 12) or from the Logger
menu (p. 21).
Note: This screen is dynamically created and its appearance will depend on the type of logger connected.
Configuring/Launching a Station
The 1000-Series, Original, Button and A-Series stations can only be reconfigured when the station is connected to the PC via a direct-connect cable. The WatchDog Manager uses the old launch process to change the logger’s properties. 2000-Series stations can be configured with any connection type. Bring up the WatchDog Manager screen, select the station of inter-est (or the appropriate generic option), and click the Properties button. This will bring up the
WatchDog Properties screen which will display the entire configuration of the station The various fields are described on the following pages.
Data Collection Interval
The data collection interval is the amount of time that elapses between measurements. Report (2000-Series only)
The LCD can be programmed to display additional calculated parameters by selecting that pa-rameter from the dropdown menu of the WatchDog Properties screen. The Plant Growth re-port requires PAR light and air temperature sensors. The Heating Degree Day rere-port requires an air temperature sensor or an external temperature sensor on channel D (model 2400 only). If you have purchased optional disease models for SpecWare, the dropdown menu in the Re-port section will show these options as well. For 1000 Series, Original and A-Series data log-gers, this feature will be grayed out. The model, serial and firmware number for the logger ap-pear to the right of the dropdown menu field.
Sensor/Units
These boxes allow you to select which parameter each external channel will measure. Click on the arrow to display the list of possible parameters. Rain gauges connected to external channels of the data loggers and 2000-Series mini stations must be assigned to Port A. NOTE: There are several different soil moisture sensors that can be connected to WatchDog data loggers. Ensure that the appropriate type of soil moisture sensor has been selected. Update
While connected to the computer, the Update button will instruct the logger to take a reading. It will take about 2 seconds for the reading to appear. If no sensor is connected to a particular port, “N/A” will appear for that port. With the exception of the Button and A-Series loggers, the battery status will also be displayed. The battery should be replaced when battery power drops to 25%. If a sensor type is changed for a 2000-Series station, it will be marked “Pending” and cannot be read by Update until the change is completed (by clicking “OK”) Wrap Around
In the Wrap around when full box, you can determine how data will be handled if the logger is not downloaded before it reaches its data holding capacity. (The A-Series logger is the only one without this capability) Click in this box if you want the logger to write over the oldest data and continue reading new data. For example, if you launch for a 30 day duration, but do not recover the logger until much later, the data will reflect the most recent 30 days. If Wrap around when full is not checked, the logger will turn itself off when it is full and await recovery and readout. Wrap Around is always enabled for the 2000-Series stations and is optional for the 1000-Series loggers.
Delayed Start
This option is available for all of the data loggers. It allows the logger to begin logging at a later, pre-specified time (up to 45 days after launching your logger). Insert the date in the first box. In-sert the starting time in the next box. The date/time formats should match the format selected in
Preferences.
Alarm
This option is only available for Weather Stations and 2000-Series weather or mini stations. The Alarm feature works with the Alarm Output Module. Select the desired channel or parameter in the first field. A target value is entered into one or both of the other 2 fields to indicate whether an alarm is triggered if the measured value goes Above or Below the target value. Original weather
See the Alarm Output Module User’s Guide
3.4 Logger Menu
for more details.WatchDog Manager
This option brings up the WatchDog Manager screen (see WatchDog Manager p. 14). This screen can be used for communicating with 1000 or 2000-Series weather or mini stations and A-Series loggers. It can also be used to readout and relaunch Original and Button loggers.
Launch/Set WatchDog 1000/2000 Properties
This establishes a connection with the 1000/2000 Series and displays the Launch Optrions
screen. This option is equivalent to clicking on the Launch/Set WatchDog 1000/2000 Properties
quick buttons.
Get WatchDog 1000/2000 Data
This established a connection with the logger and downloads data accumulated. This option is equivalent to clicking the Get WatchDog 1000/2000 Data quick button on the toolbars.
Launch WatchDog A Series
This establishes a connection with the WatchDog A-Series Data Logger and displays the Launch Options screen. This option is equivalent to clicking on the Launch WatchDog A-Series quick button on the toolbar.
Get WatchDog A-Series Data
This establishes a connection with the WatchDog A-Series logger and downloads data accumulated since the logger was launched. This option is equivalent to clicking the Get WatchDog A-Series Data quick-button on the toolbars.
Launch Original WatchDog
This establishes a connection with a WatchDog Original or Button logger and displays the Launch Options screen. This option is equivalent to clicking on the Launch WatchDog Logger quick-button on the toolbar (See Launching Original WatchDog Data Loggers, p. 23).
Get Original WatchDog Data
This establishes a connection with the logger and downloads the data accumulated since the logger was last launched. This option is equivalent to clicking the Get WatchDog Data quick-button on the toolbar (See Downloading Original WatchDog Data Loggers, p. 22).
Original Weather Station Real-Time Monitor
This launches the Weather Monitor screen (see p. 25). This is equivalent to the Original Weather Station Monitor toolbar button.
3.5 Downloading Data
WatchDog data loggers and weather stations can be downloaded with the WatchDog Man-ager (see p. 14) or with the Quick Button on the SpecWare toolbar (see p. 12). The Quick But-ton download procedure is described below.
Before downloading data, you must establish a connection between the data logger and your computer. For 1000-Series, data loggers and data shuttles, this is done with a direct connect cable. For the WatchDog button loggers, use the docking station. For weather stations, a con-nection can be made with the concon-nection cable, a 75-ft direct connect cable, a short-range mo-dem pair, a remote wireless connection or with a landline or cellular telephone connection. For the A-Series logger a connection can only be made using the WatchDog A-Series USB cable connection to PC .
Click the Get WatchDog 1000/2000, A-Series, or Original WatchDog Data quick-button or use the Logger menu to contact the WatchDog and initiate the download sequence.
As the logger is downloading, a SpecWare Progress dialog box will be visible. When the data transfer is complete, a dialog box will appear indicating that readout and translation is complete. You may then disconnect the logger from the connection cable.
SpecWare will automatically prompt you to save the logger data (See Saving Data, p. 29). All new dataloggers require that you create a new Logger Location the first time the logger is read out. Once this Logger Location is established, subsequent logger data readouts can be appended to this Logger Location. For weather stations connected via telephone modem or a multi-point wireless system, the data will automatically be downloaded into the Logger Location with the same name entered in the ID/Location Name field of the logger header (See Launching Original WatchDog Data Loggers, p. 23) or the name given to it when it was created in the WatchDog Manager screen (see WatchDog Manager, p. 14).
After downloading WatchDog loggers, SpecWare will display a screen (see Opening Files, p. 28) that allows you to select which parameters will be graphed as well as on which vertical axis the data scale for a given parameter will be displayed. Up to 2 parameter types can be se-lected and all data files of that type will be displayed. The data will be displayed in a graph with the logger reading on the vertical scale and time on the horizontal scale.
IMPORTANT: Until the logger is relaunched, the data remains on the logger and can be downloaded again. Once you have retrieved data, you must relaunch the logger to continue making measurements. Clicking Start to relaunch the logger erases the previously recorded data from the logger.
3.6 Launching Original
WatchDog Data Loggers
Original WatchDog Loggers can be launched with the Quick Button on the SpecWare toolbar (see p. 12). The Quick Button launch procedure is described below.
Initiating Contact
With the logger connected to the interface cable, initiate the launch process by using the Logger menu or by selecting the appropriate logger type and clicking the
Launch Original WatchDog quick-button (See p. 12). The Launch Options screen will appear. Initially, the screen will display the current launch configuration. Any of the launch configuration parameters can be changed except whether the data is output in English or metric units (See Preferences,p. 7).
To launch the logger, click on the Start button. When the logger is actively reading, the LCD will indicate the logger status. On loggers lacking an LCD, a red LED will flash. (It will flash only dimly every four seconds during the delay period of a delayed launch.) Click the Cancel
button to exit the Launch Options screen without launching the logger.
CAUTION: Clicking the Start button erases previously recorded data from the logger. Until
Start is clicked, that data is available for download.
NOTE: Do not unplug the logger from the interface cable until SpecWare has indicated that the launch has been completed.
Launch Options Screen Header
The top field of the dialog box gives a description of the logger and its serial number. Neither the description nor the serial number can be changed. The header will also show the current date and time on your computer. This information will be transferred to the logger when it is launched.
ID/Location Name
The text in this box can be used to identify the Logger Location. Up to 40 characters can be written in this area. The logger location entered will become the default location for saving the data.
Measurement Interval and Maximum Duration
The interval is the amount of time that elapses between measurements. After selecting the interval, the maximum duration (time it will take to completely fill the logger) is calculated and displayed by SpecWare, this feature is only available on the Original Data Loggers.
Port Enabled
On the WatchDog data loggers you can enable or disable the ports by checking or unchecking the appropriate boxes of their external ports. The sensors that come standard (including the solar radiation sensor on the 900ET station) are always enabled.
Sensor/Units
These boxes allow you to select which parameter each logger channel will measure. Click on the arrow to display the list of possible parameters. Rain gauges connected to external channels of the 1000/2000 Series or mini data loggers must be assigned to Port A.
NOTE: There are four different soil moisture sensors that can be connected to WatchDog data loggers. Ensure that the appropriate type of soil moisture sensor has been selected.
Update
While connected to the computer, the Update button will cause the logger to take a reading. It will take about 2 seconds for the reading to appear. If no sensor is connected to a particular port, “N/A” will appear for that port. For the WatchDog (except model 100), the battery status will also be displayed. The battery should be replaced when battery power drops to 25%.
Alarm
The Alarm feature is only active with Weather Stations connected to an Alarm Output Module. Select the desired channel or parameter in the first field. Indicate in the second field whether the alarm module is triggered when the measured parameter Goes Above or Goes Below the target value entered in field 3. See the Alarm Output Module User’s Guide for more details.
Wrap Around
In the Wrap around when full box, you can determine how data will be handled if the logger is not downloaded before it reaches it’s dataholding capacity. Click in this box if you want the logger to write over the oldest data and continue reading new data. For example, if you launch for a 30 day duration, but do not recover the logger until much later, the data will reflect the most recent 30 days. If Wrap around when full is not checked, the logger will turn itself off when it is full and await recovery and readout.
Delayed Start
The Delayed Start box will appear for those loggers that are capable of using this option. It allows the logger to begin logging at a later, pre-specified time (up to 45 days after launching your logger). Insert the date in the first 3 boxes in the format mm/dd/yyyy. Insert the starting time in the next 3 boxes. The time uses a 12-hour format; you must enter “am” or “pm”.
3.7 Real-Time Weather Monitor
WatchDog Original Weather Stations
The first launch of a station will enable the
Original Weather Station Real-Time
Monitor
option in the
Logger
menu and the
Original Weather Station Monitor
quick-button on the SpecWare
Toolbar
screen (see p. 12). Clicking either the menu option
or the quick-button will display one of the first two monitor screens shown on p. 26.
(Note: once the
Original Weather Station Real-Time Monitor
is initialized, SpecWare
does not have to remain open to display the monitor screen.) The monitor screen
displays the current weather conditions including readings from the sensors that are
plugged into the external ports of the weather station.
IMPORTANT:
For the Real-Time Weather Station Monitor to work correctly, the
weather station must be connected to the computer using the optional hardwire or
remote PC connections.
The data on the monitor screen is updated by clicking on the
Refresh
button on the
lower left part of the screen. Clicking the
Repeat Refresh
button will cause the
monitor screen to update every five minutes.
The amount of
Rain
since the last download/launch and current
Rain
amount since the
last
Reset
are displayed on the lower right corner of the monitor screen. There may be
several rainfall events between the times that data is downloaded to the computer (see
Downloading Original WatchDog Data Loggers
, p. 22). Click the
Reset Rain
button
to zero the currently accumulated
Rain
amount.
The bar graph is composed of
Air
temperature,
Dew
point and wind
Chill
. The green
and blue horizontal lines on the bar graph are the daily high and low temperatures.
NOTE
:
If SpecWare cannot make a connection when trying to bring up the Real Time
Monitor, the user may need to end the task (SpecWSM8) in the Task Manager. You
can bring up the Task Manager by simultaneously clicking the Cntrl-Alt-Delete buttons
on the keyboard.
1000 or 2000-Series Data Stations
The monitor screen for the 1000 or 2000-Series stations can only be activated by
clicking the
Get Current Conditions
option in the
WatchDog Manager
. A sample
screen is shown on p. 26.
Monitor screen generated by
tool-bar quick-button for a Model 800
station.
Monitor screen generated by toolbar
quick-button for all Original stations
(except the model 800).
Monitor Screen generated by
WatchDog Manager screen. Note:
This is the only option available for
the 1000 or 2000-series mini– and
the weather station.
4.1 Data Management
SpecWare offers significant advantages in data information management and
decision-making tools. SpecWare simplifies your database with
Logger Location
directories.
This permits easier analysis of trends and historical data.
The database is the permanent record of data stored on your hard drive. When you
download the logger, SpecWare transfers all information in the logger memory to the
computer and you have the option of saving to an existing
Logger Location
. For
Original WatchDog data loggers and weather stations, it is also possible to create a
new location to save the logger data. Suggestion: Use the “ID/Location Name” box
that appears in the logger “Launch Options” screen as your
Logger Location
(e.g.
North Orchard). Each
Logger Location
in SpecWare is a subdirectory in
C:\Specware. If you choose to save your downloaded logger data to a floppy diskette,
it is important to use a separate floppy diskette for each location because of the way
data files are built by SpecWare.
The software stores data to disk in monthly files. All parameters are recorded in the
same file in a subdirectory named for the
Logger Location
. As new data is
downloaded from the logger, it is appended to the appropriate month for the location
you have specified. The name of the data file indicates the year and the month of the
data. For example, SD201002.swd is the data for February 2010. Each
Logger
Loca-tion
directory must contain an index file (index.swd). This index file is used by
SpecWare to identify which parameter is associated with each column in the data files.
For this reason, care must be exercised when transferring or copying data files from
one
Logger Location
to another.
CAUTION
:
The files in each
Logger Location
are given the same names as those in
other
Logger Locations
. Therefore, it is important to carefully choose the
Logger
Location
when adding new data to existing locations or to floppy diskette to avoid
mixing the data from separate locations.
4.2 Opening Files
Open File
Click the
Open Logger File(s)
toolbar button or the
Open File
option from the
File
menu
to bring up the
Open Logger Files
screen. From the upper box, select the
Logger Location
where the file is located. Data files saved on a floppy disk can also
be retrieved (A: drive).
Data Redisplay Options
SpecWare offers 3 data redisplay options. These options are shown in the
Select
Time Period to Display
field in the lower right corner of the
Open Logger Files
screen.
The first option allows you to view only the most recent data in the selected
Logger
Location
. Enter the time interval of interest in the two text fields. The dropdown menu
allows for time increments of days, weeks, or months. It is possible to exclude the
current week or month of data. This may be desirable if the data has just been
downloaded or if you want to look at data from the last complete time interval.
The second option instructs SpecWare to display all data from the beginning of the
growing season defined in the
General
tab of the
Preferences
screen (see p. 7).
The third option allows you to select a specific range of months. The months are
selected from the list in the lower left corner of the
Open Logger Files
screen.
Multiple months can be selected by holding down the left mouse button and dragging
the cursor or by selecting the first month and, while holding the shift key, selecting the
other months with the arrow keys.
The third option is SpecWare’s default mode. One of the other options can be set as the default by clicking the box at the bottom of the screen. The newly selected default setting will not be universal but will only apply to the specific Logger Location
for which it has been selected.
After selecting the Logger Location and data redisplay interval options, clicking the Open button will bring up the Change Graph Parameters screen (shown to the right). This screen allows you to select which parameters will be graphed as well as the vertical axis that will be used. Only 1 parameter can be plotted on the Y1 axis, but multiple parameters can be plotted on the Y2 axis. The data on the graph will also be visible under the horizontal axis. This is especially useful when multiple parameters are plotted on the Y2 axis (See View, Print and Edit Menus, p. 32).
4.3 Saving Data
Data downloaded from 1000 or 2000-Series weather or mini station is automatically saved to a
Logger Location with the same name as the Logger/Station Name assigned in the Proper-ties screen (see WatchDog Manager, p. 14).
Saving Files Downloaded from Original Watch-Dog Stations
When you download the data from an original logger, the Save Logger Data box will appear. Choose the directory where you want to save the file. You may append the data files into an existing
Logger Location, save them to a newly created
Logger Location, or save to a floppy disk. If you decide to create a new location, you will be prompted to name this location. Generally, the data will be saved to a logger location in the SpecWare directory on the drive where the
software was installed. Files can also be saved to the floppy disk drive (A: or B: drive) if this option is selected in the Data Storage tab of the Preferences screen (see pg. 9). If you choose to not save your data at this time, click on the Cancel button to go directly to the graph screen. You can save the data later by selecting the Save File option from the File menu. Otherwise, you will be reminded to save the file if you attempt to open another file or exit from the program.
Using Your Data in Other Applications
SpecWare creates an ASCII file for use in other applications as soon as a downloaded file is saved. The file is tab-delimited for use in spreadsheets, word processors and other applications. These raw data files are located in the SpecWare directory in a folder named for the Logger Location.
4.4 Converting Archived Data into
the Current SpecWare Format
NOTE: If a data file is changed is changed by a different application (i.e. Excel), do not save to this application with the original file name. By default, the format will be changed and SpecWare will be unable to read the modified file.
IMPORTANT: All new data loggers require that you create a new Logger Location. Once this
Logger Location is established, subsequent logger data readouts can be appended to this
Logger Location.
The data file format for SpecWare versions 6 and earlier is different than the current format. Instead of having a unique monthly data file for each pa-rameter, all data collected in a given month is in-cluded in one master data file. This file has a .swd extension associated with it. An index.swd file is also included in the Logger Location folder to allow SpecWare to process these data files into reports and graphs.
Data files created in earlier versions of SpecWare can be converted into the current file format used by SpecWare. Select Convert SpecWare v3-6 Files from the Import Files menu within the
File menu (Fig. 5). This will bring up the file conversion screen (Fig. 6). All Logger Locations
from the SpecWare directory will be visible. Select the location that contains the data you wish to convert. By default, every month of data will be converted. If you wish to only convert cer-tain months of data, check the Convert
Specific Month(s) box and use the mouse to select the desired months.
Click the Convert button to initiate the con-version. SpecWare will create the new data files and the index.swd file. The new data files are added to the directory and the old data files are left intact.
NOTE: If the index.swd file is removed, SpecWare will automatically recreate it the next time that Logger Location is opened.
4.5 Importing Data
There are several instances when it may be necessary to import data files into SpecWare. All import functions are accessed from the Import Files option in the File menu (see p. 13). After the files to be imported have been selected, the Save Logger Data box will appear. If more than one file has been selected, each file will be imported in succession. You may append the data files into an existing Logger Location, save them to a newly created Logger Location or onto a floppy disk (see Saving Data p. 29). The various input options are listed below.
Importing .wdr Files
Palm/PDA Files
Files that have been transferred to a PC from a Palm Pilot or other PDA device must be im-ported into SpecWare. Select Import PDA Shuttle File from the Import Files dropdown menu. This will bring up a screen that allows you to browse to the location of the saved data files.
Raw Data Files
Some files that have been created by using WDTest to extract raw data from a data logger or weather station may be imported directly into SpecWare. This will not be possible if the files need to be repaired by Spectrum Technologies before they can be imported. Select Import Raw Data File from the Import Files dropdown menu. This will bring up a screen that allows you to browse to the location of the saved data files.
Importing Weather Data Files
WeatherLink Data Files
SpecWare is able to import and process files that were initially downloaded with WeatherLink software. These files will have a suffix of .wlk. Select Import WeatherLink Data Files from the Import Files dropdown menu. This will bring up a screen that allows you to browse to the location of the saved WeatherLink data files.
Note: WeatherLink considers midnight to be the last data point of the day. SpecWare consid-ers midnight to be the first data point of the day. Therefore, if a WeatherLink file has a data point for midnight, SpecWare will create a SpecWare file for the same month, plus a file for the following month containing only the last midnight record.
Generic Weather Data Files
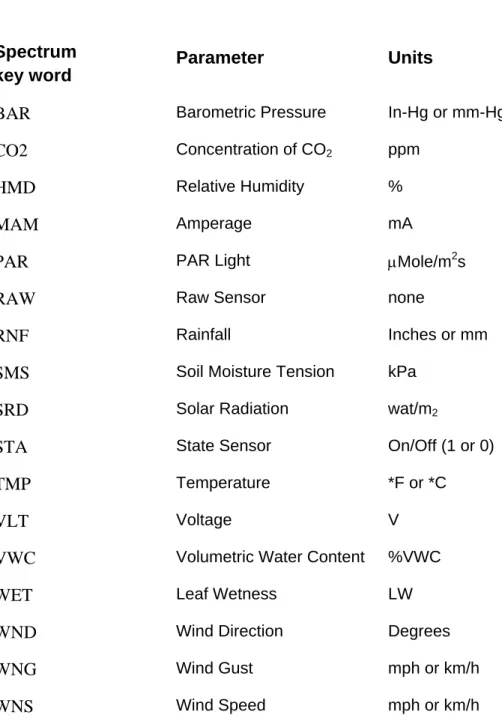
SpecWare is able to import and process weather data files that were initially created with other data logging software. The data must be text files in tab-delimited format. One line in the file must con-tain SpecWare-specific keywords that identify which weather parameter is contained in each column of data. The date and time information must be in the first one or two columns. Select the Import Generic Weather Data Files option from the Import Files dropdown menu. This will bring up a screen that allows you to browse to the location of the saved weather data files. Select one or more files and click Open. In the
SpecWare File Import Options screen, specify
how the data file is configured. This configuration can be stored as the default by clicking the
Save as Default button. Otherwise, click the OK button and proceed with saving the data in SpecWare. Refer to Appendix 1, (p. 50) for details on creating generic data files.
4.6
View, Print
,
and
Edit
Menus
Viewing Your Data as a Graph
Upon downloading data or opening an existing file, you must select the parameters to view. SpecWare will display the Change Graph Parameters screen (see p. 34). This screen will also appear when opening new files (see Opening Files, p. 28). Select which parameters will be graphed and on which vertical axis (Y1 or Y2) the data scale for a given parameter will be displayed. The data will be displayed in a graph with the logger reading on a vertical scale, time on the horizontal scale and the legend shown underneath the graph. As the cursor is moved across the graph, the time and data values are displayed at the bottom of the screen.
Only 1 parameter can be plotted on the Y1 axis. The data scale on the Y1 axis will be in the units of the parameter being displayed. The Y2 axis, however, can be used to plot multiple parameters. If only one parameter is being plotted using the Y2 axis, the data scale will be in the units of that parameter. However, if the Y2 axis is being used to plot more than 1
reference axis will, therefore, be normalized to a scale of 0 to 100. Each parameter has a default range that is used to do the normalization. The default ranges encompass most data values that will be seen in the field. This range can be modified in the Graph tab of the
Preferences screen (p. 10). When more than 1 parameter is plotted on the Y2 axis, the actual numerical values of each plotted point can be still be seen beneath the graph. The following example is given for illustration:
Example: The default range for solar radiation is 0 to 1,250 W/m2. Assume, during a given month, the peak solar radiation was 550 W/m2. If solar radiation is plotted on the Y2 axis along with one or more other variables, its maximum normalized value will be 44 [because 100 x (550/1250) = 44]. However, if in the Preferences screen, the default range is changed to 0 to 600 W/m2, the normalized graph of solar radiation will then have a peak of 92 [because 100 x (550/600) = 92]. In both cases, “550 W/m2 will be displayed as the value beneath the graph.
Viewing Your Data as Text
Click on the View Data as Text quick-button or on the
View Data as Text command in the View menu. A WordPad or Notepad window (depending on what is available on your computer) will overlay the graph and display the numerical data for that graph.
Printing Your Graph
Click on the Print Graph command under the Print menu to print the graph displayed on the screen.
Printing Your Data as Text
Click on the Print Text File command under the Print menu on the Graph/Data Screen to print the numerical data for the graph displayed on the screen.
NOTE: The data displayed using the View Data as Text or Print Text File commands may not always be the raw data as recorded by the data logger. The data displayed has been adjusted to fit uniform time periods for the purpose of graphing (See Data Redisplay Intervals, p. 10 and Using Your Data in Other Applications, p. 29).
Zooming in on any Plot Selection
You can zoom in on any section of the plot. This function is particularly useful when the plot encompasses a large data set. Note that when the cursor is within the graph box, a Tracker Bar appears. A vertical Tracker Bar is always present. It is also possible to display a horizontal Tracker Bar by setting this option in the Graph tab in the Preferences screen (see
Graph p. 10). As the Tracker Bar is repositioned on the graph, the corresponding date, time, and associated data values appear in the status bar below the graph. To zoom in on a particular section of a graph, position the cursor at one end of the time interval of interest. While holding down the left mouse button, drag the Tracker Bar to the other end of the time interval. After releasing the mouse button, the software will display a graph of the chosen region.
Zooming Out One Level
To return to a previous graph after zooming in on your graph, click on the Zoom Out quick-button (magnifying glass without the red circle) or the Zoom Out One Level command in the
View menu. Each time this button is clicked, the screen will return to the previous screen developed during the zooming-in process.
Returning to the Original Plot View
After zooming in on the data displayed in the graph screen, click on the Reset Zoom quick-button (magnifying glass with red circle) or the Reset Zoom command in the View menu to return to the original graph.
Copying Graph
To copy the graph as a bitmap for use in other applications, select Copy Graph from the Edit
menu.
Change Graph
Selecting this option from the Edit menu will bring up the Change Graph Parameters screen. This screen can also be accessed from the Change Graph Parameters quick-button on the SpecWare toolbar. When this option is selected, the Change Graph Parameters screen will appear. Select the parameter(s) of
interest and click the Redraw button to produce the new chart.