Lucrări ştiinţifice Zootehnie şi Biotehnologii, vol. 42(2) (2009), Timişoara
INFLUENCE OF STARCH ADDING ON THE BEEF
COMPOSITIONS VISCOSITY
INFLUEN
Ţ
A AD
Ă
UG
Ă
RII AMIDONULUI ASUPRA
VÂSCOZIT
ĂŢ
II COMPOZI
Ţ
IILOR DIN CARNE DE VIT
Ă
DANIELA IANIŢCHI, LUCICA NISTOR, LAURA URDEŞ, CAMELIA HODOŞAN , CRISTIANA DIACONESCU
Faculty of Animal Sciences, Bucharest, Romania [email protected]
Animal raw material processing is directly influenced by the physical and chemical characteristics of their. The various combinations and status of the raw materials used in the food industry determine specific behaviours that may influence the processing equipment performance and construction. The study on meat composition viscosity depending upon the added components, temperature and mixing time length, has shown that viscosity is increasing with lower mixing temperature , higher mixing time length and higher added starch percentage.
Keywords: beef composition, viscosity, starch
Introduction
In order to study the behaviour of meat under the action of external forces, it is important to know its initial structure. From a physical point of view, meat structure is predominantly aggregate, and has two phases: solid and liquid. The solid phase consists in the proteins that are the basis for the muscle fibers and fascicles; the liquid phase consists in the cell juice while the fibers and fascicles make up a multiple-phase system.
The solid-liquid meat system is not stable as it is influenced by external conditions. Thus, the water in the meat freezes at low temperatures and the meat has the characteristics of a solid body. When minced, it turns into a colloidal system which, macroscopicall speaking, partially behaves like a liquid.
meat composition viscosity and their behaviour under the action of external forces. The compositions of meat viscosities cited literature are varied, depending on the type and means of investigation. Thus, the composition of beef and pork were recorded between 18-22 Pas (Banu, 1982), and the compositions of turkey and starch investigated by Brookfield-R7 were found between 66-97 Pas (Dexter, 1993).
Materials and Methods
The study made use of a composition consisting in beef, fatness, water, salt, polyphosphates and starch. The beef, fat and cooled water were finely minced and mixed with the other components. Mixtures were based on the starch as variation factor (1%, 2% and 3% starch), whereas the other components remained constant (50,7% muscle tissue, 27,3% fat tissue, 22% water, 2.5% salt and 0.5% polyphosphates).
The parameters that varied during processing were: mixing temperature (5°C, 10°C, 15 °C) and mixing time (2,5 min., 5 min.).
For the laboratory measurements, a Brookfield DVII equipment was used, withand viscosity was expressed in Pas. The vascosity was measured with sprindl R7 and different revolutions (1 rpm- 12 rpm).
The experiments led to different behaviours in the dynamic viscosity of the meat compositions.
Results and Discussion
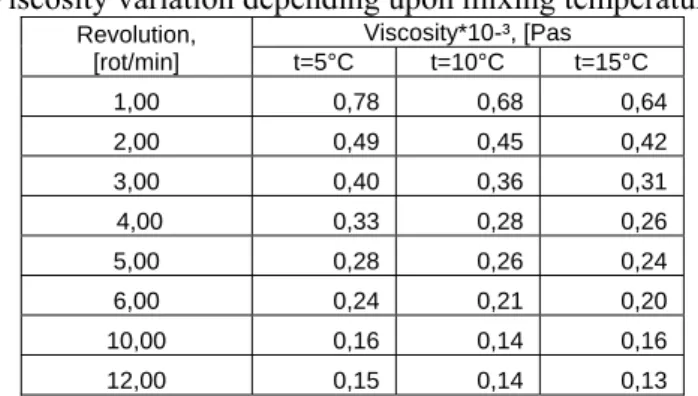
Table 1.
Viscosity variation depending upon mixing temperature
Revolution, [rot/min]
Viscosity*10-³, [Pas
t=5°C t=10°C t=15°C
1,00 0,78 0,68 0,64
2,00 0,49 0,45 0,42
3,00 0,40 0,36 0,31
4,00 0,33 0,28 0,26
5,00 0,28 0,26 0,24
6,00 0,24 0,21 0,20
10,00 0,16 0,14 0,16
12,00 0,15 0,14 0,13
Figure 1. Vicosity variation depending upon mixing temperature
0,00 0,10 0,20 0,30 0,40 0,50 0,60 0,70 0,80 0,90
1,00 2,00 3,00 4,00 5,00 6,00 10,00 12,00
Revolutions,[rot/m in]
V
isco
si
ty
*0
.001,
[P
as]
A
B
C
A-
Viscosity variation at 5°CB-
Viscosity variation at 10°CC-
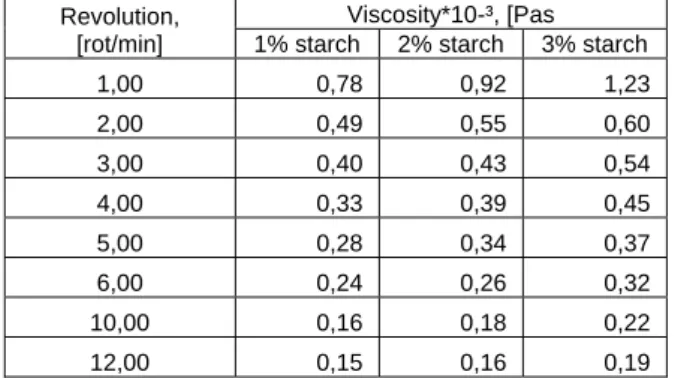
Viscosity variation at 15°CViscosity variation depending upon the starch content of the composition
Revolution, [rot/min]
Viscosity*10-³, [Pas 1% starch 2% starch 3% starch
1,00 0,78 0,92 1,23
2,00 0,49 0,55 0,60
3,00 0,40 0,43 0,54
4,00 0,33 0,39 0,45
5,00 0,28 0,34 0,37
6,00 0,24 0,26 0,32
10,00 0,16 0,18 0,22
12,00 0,15 0,16 0,19
Figure 2. Viscosity variation depending upon the starch content of the composition
0,00 0,10 0,20 0,30 0,40 0,50 0,60 0,70 0,80 0,90 1,00
1,00 2,00 3,00 4,00 5,00 6,00 10,00 12,00
Re volutions ,[rot/m in]
V
isc
o
s
it
y
*0.
00
1
,[
P
as
]
A
B
C
A- Composition of 1% added starch B- Composition of 2% added starch C- Composition of 3% added starch
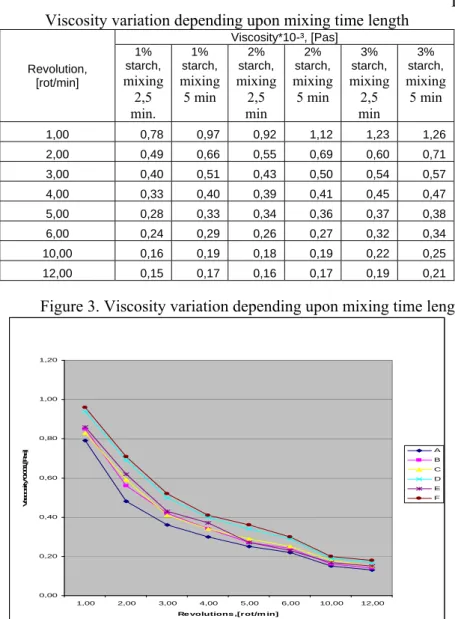
Table 3.
Viscosity variation depending upon mixing time length
Revolution, [rot/min] Viscosity*10-³, [Pas] 1% starch, mixing 2,5 min. 1% starch, mixing 5 min 2% starch, mixing 2,5 min 2% starch, mixing 5 min 3% starch, mixing 2,5 min 3% starch, mixing 5 min
1,00 0,78 0,97 0,92 1,12 1,23 1,26
2,00 0,49 0,66 0,55 0,69 0,60 0,71
3,00 0,40 0,51 0,43 0,50 0,54 0,57
4,00 0,33 0,40 0,39 0,41 0,45 0,47
5,00 0,28 0,33 0,34 0,36 0,37 0,38
6,00 0,24 0,29 0,26 0,27 0,32 0,34
10,00 0,16 0,19 0,18 0,19 0,22 0,25
12,00 0,15 0,17 0,16 0,17 0,19 0,21
Figure 3. Viscosity variation depending upon mixing time length
0,00 0,20 0,40 0,60 0,80 1,00 1,20
1,00 2,00 3,00 4,00 5,00 6,00 10,00 12,00
Re volutions ,[r ot/m in]
V as co s it y *0 .001 ,[ P as ] A B C D E F
Conclusions
Research shows that the variation in chemical composition results in changes of the structural and mechanic characteristics, while more starch added leads to higher viscosity of the meat mixtures.
The variation in the forces operating on the materials generates changes in their behaviour, the increased number of revolutions of the viscosimeter leading to lower viscosity.
Also, the technical parameters applied have their own influence, as higher mixing temperature results in lower viscosity due to decreased fat viscosity, whereas longer mixing time length leads to higher viscosity induced by the hydration and distension starch particles and decrease the free water.
References
1. Banu C., Mircea C., Bejan D., 1982, Unele caracteristici fizice ale cărnii, Universitatea ‘‘Dunărea de Jos ‘‘, Galaţi.
2. Dexter D.R., Sofos J.N., Schmidt G.R., 1993, Quality characteristics of turkey bologna formulated with carrageenan, starch, milk and soy protein, Journal of MuscleFoods, 4, 207-223.