Fuzzy Temporal Patterns for Analyzing Stock Market
Databases
Girish Keshav Palshikar
Tata Research Development and Design Centre,
54, Hadapsar Industrial Estate,
Pune 411013.
Tel. 91-20-687 1058
[email protected]
Arun Bahulkar
Tata Consultancy Services,
54, Hadapsar Industrial Estate,
Pune 411013.
Tel. 91-20-687 1058
[email protected]
ABSTRACT
Stock exchanges collect vast amounts of temporal time-stamped data regarding various business transactions like quotations, trading, payment, delivery etc. A number of subtle, carefully executed long-term mal-practices are often committed in such transactions. On-line surveillance systems are unable to detect or prevent them due to the short-term data they can analyze due to time constraints. Usually the individual transactions are innocuous and the mal-practice is visible only when the transactions are appropriately grouped together. Evidence for such mal-practices is often hidden deep in databases. Surveillance of stock market transactions for detecting (and gathering evidence of) mal-practices is an important, complex and knowledge-intensive task. We propose a pattern recognition based approach for surveillance based on the premise that each type of mal-practice leaves a telltale trace in the trading databases, which can be approximately specified as a temporal pattern by investigation experts. Various instances of the pattern describing the same mal-practice have similar but not identical traces in the databases. We describe a fuzzy temporal logic notation to specify such pattern and a tool called SNIFFER, which detects where and how strongly the given surveillance pattern occurs in the given temporal databases. We also describe a few simple patterns that partially characterize some specific mal-practices.
1.
INTRODUCTION
It is a well-known unfortunate fact that there are unscrupulous organizations and groups of individuals, which attempt to manipulate or influence the activities on stock exchanges with the intent of making profits through illegal or unfair means. We focus our attention on those mal-practices, which are subtle, carefully planned and executed over long periods of time. Continued prevalence of such mal-practices can have disastrous long-term consequences for the stock exchange, businesses,
investors, financial institutions, the government and economy, in general.
In this paper, we ignore the mal-practices related to payment, delivery etc. and focus on trading related mal-practices like circular trading, price manipulation, price hammering, price propping, insider trading, takeover bids, market cornering, collusion etc. To facilitate fair transactions, the competent authorities keep developing various laws and guidelines (e.g., Securities and Exchange Board (SEBI) guidelines in India) to be followed by all participants in stock market activities.
Stock exchanges collect vast amounts of temporal (i.e., time-stamped) data regarding the various business transactions like quotations, trading, payment, delivery etc. Enforcing the laws and guidelines requires continuous surveillance of stock market activities through analysis of the associated temporal databases. On-line surveillance systems are unable to detect or prevent the long-term mal-practices due to only the short-term data they can analyze due to time constraints. Usually the individual transactions are innocuous; the mal-practice is visible only when the transactions are appropriately grouped together. Evidence for such mal-practices is often hidden deep inside databases. That is why surveillance of stock market databases for detecting (or gathering evidence of) mal-practices is an important, complex and knowledge-intensive task.
Surveillance by analyzing temporal databases is the focus of this paper. Such surveillance could be preventive involving early detection and prevention of mal-practices or retroactive involving detection and investigation of suspects and mal-practices in the past. We ignore non-database activities in the complete surveillance process e.g., follow up actions like interviews, raids, prosecution etc. We make the following assumptions.
1. Each mal-practice leaves a telltale trace (i.e., a sequence of transactions) in the associated temporal databases.
2. Investigative experts often characterize each type of mal-practice in terms of approximate, high-level (i.e., away from table designs etc.) and temporal patterns - each such pattern describes the dynamic behaviour (i.e., the trace) of data values expected in the temporal databases.
3. Various instances of the pattern describing the same mal-practice have similar but not identical traces in the temporal databases.
4. The background business and market knowledge used to eliminate spurious instances is also often stated in fuzzy temporal terms.
Ability to define and detect such patterns and knowledge is important for surveillance. A pattern is a qualitative summary of vast temporal data, in terms of basic domain concepts. Patterns are organized hierarchically and are composed using intuitive logical and temporal connectives and given domain-specific primitive patterns or features. Examples of such patterns are: • whenever the price of a stock is very high or very low,
trading in it is rather low
• large buying of a stock within a small time interval leads to a sharp rise in the price
• as the market price of a stock increases, so does the volume traded
• selling tendency increases whenever stock price goes above the previous maximum
Exceptions to such normal patterns are alarms that need to be investigated. Early warnings can be similarly defined in terms of patterns. In this paper, we define a fuzzy temporal logic FzPLTL, which is a standard propositional fuzzy logic with the addition of usual temporal modalities adapted for fuzzy applications. We propose a view that such a fuzzy temporal notation is appropriate for the specification of temporal patterns in temporal databases. Domain-specific features are used to define the primitive fuzzy temporal propositions. These fuzzy temporal propositions are then used to compose complex patterns using standard logical and temporal connectives. Thus, in this paper, a temporal pattern is a formula in FzPLTL. Temporal logic like FzPLTL abstracts away the details of actual time instants/periods and allows one to focus on inter-relationships between events. It provides a variety of temporal and logical connectives for pattern composition. Fuzziness in the notation allows specification of inexact patterns. However, in this paper, we use the notation mainly to express syntactic pattern structure; we do not explore issues like inferences among patterns. We do not directly employ the common techniques of statistical pattern recognition (e.g., classification, clustering etc.). Also, this work is oriented towards model-guided pattern detection, rather than unsupervised pattern recognition.
In section 2, we provide a survey of some of the related work. In section 3 we define the basic framework of fuzzy propositional linear temporal logic FzPLTL and show how it can be used to define patterns. In section 4, we address the problem of matching the given pattern to the given temporal databases and detecting where and how strongly it matches. In section 5, we discuss the SNIFFER tool and illustrate its use for stock market trading surveillance. Section 6 discusses conclusions and further work.
2.
RELATED WORK
The need to use patterns, rather than precise queries and reports, for comprehending the data is recognized as important for effective management information systems [7].
The ideas of incorporating fuzzy logic into the framework of temporal logic appeared in our work [16, 17] and in [9], which differ in the temporal operators provided. Our work also contains new averaging temporal operators. The work of [Brusoni et al 1999] deals with specifying qualitative (non-fuzzy) and quantitative temporal constraints over temporal databases.
Coupling of logical languages with databases is an active research area. [15] discusses an interesting stream based approach to this problem. Our work is closely related to that in the temporal deductive databases, in particular, to TempLog and DatalogLS [21, Ch. 13]. To keep things simple, we stick to a
propositional temporal logic; however, we allow general formulae, not necessarily in any specific clausal or IF-THEN form. Moreover, the introduction of fuzzy propositions makes FzPLTL a different formalism. Finally, the classical notions of satisfiability, validity and logical consequence are more or less irrelevant in FzPLTL (just as in fuzzy logic); hence, the emphasis here is not on proof-procedures or other related formal issues. The basic formalism of propositional linear temporal logic, as used here, is from [4].
This work is also related to the standard syntactic pattern recognition framework [6] except that the patterns are not specified in grammar but in logic. [18] demonstrates the use of fuzzy context free grammars for recognition of X-ray patterns. For specification and matching of simple patterns over databases, fuzzy (non-temporal) query languages ([12], [8], [19]) can be used. Temporal query languages like TSQL, HSQL or TQuel [21, Ch. 4, 5, 6] can be used for (non-fuzzy) queries of temporal databases. [14] provides a logic-based time calculus for temporal reasoning system over temporal databases.
[3] discuss various applications of fuzzy rule-base systems, in particular to time series data. [11] discusses a similar approach for the stock market regulator application; their stress is on data mining and knowledge discovery and they have not used any formal fuzzy temporal logic framework. [5] discusses a more algorithmic approach to matching sub-sequences in time-series databases. [20] discuss an application of automatic trend recognition of time series databases to plant operations. Pattern recognition has also been recognized as a valuable approach to data mining [10].
patterns) computed from the databases; and (b) powerful and abstract facilities for composing patterns composed from features and other patterns. Logical notations appear to be better at these tasks. Moreover, FzPLTL is a general notation and can also be used in applications other than surveillance; e.g., diagnosis, battlefield situation analysis etc.
3.
A FUZZY TEMPORAL LOGIC
This section contains an informal and gradual presentation about how fuzzy and temporal logic can be used to analyze stock market databases. The exact syntax and semantics of the underlying fuzzy propositional linear temporal logic FzPLTL are defined in [16, 17].
3.1
Non-temporal Fuzzy Patterns
Consider a very simplified temporal stock market trading database having the following structure:
Trading
(1) CompanyID (2) Timestamp (3) BuyerBrokerID (4) SellerBrokerID (5) Price (6) Volume
A simpler view (including only company-wise trading) over the CompanyTrading tables is as follows:
CompanyTrading
(1) CompanyID (2) Timestamp (3) Price (4) Volume
A record in the CompanyTrading table is constructed by adding all transactions for that company (irrespective of the buyer or seller) at that instant and averaging the price used in these transactions. We assume that timestamps are suitably converted to integers. We also assume that the identity of the final seller or buyer is not revealed in the trading databases.
Many primitive features can be defined in such a system. A primitive feature is a function from timestamp (and possibly other parameters) to a set of numbers; e.g., the primitive features
price : TIMESTAMP × COMPANY_ID → + volume : TIMESTAMP × COMPANY_ID →
moving_avg_price : TIMESTAMP × COMPANY_ID → + moving_avg_volume : TIMESTAMP × COMPANY_ID →
respectively return the price, volume and (appropriately computed) moving averages of the price and volume for the given company at various timestamps; COMPANY_ID and TIMESTAMP are respectively the set of values for the company IDs and timestamps that occur in the given tables. An appropriate computational subroutine is assumed to be available which will return the value of a given primitive at the given instance of time. We assume that TIMESTAMP denotes a finite linear discrete timeline consisting of an ordered sequence of (not necessarily equally spaced) time instants. Note that each feature is based on a continuity assumption, which specifies the values at timestamps where they cannot be directly computed. For example, if there are no transactions at timestamp t (in CompanyTrading tables) for a specific company, then for feature price, we can either return (a) the price used in the last
transaction (b) the average price of the last and the next transaction (c) return a special failure value like say 0.0 or –1.0 and so on.
An interesting class of features consists of fuzzy features. A fuzzy feature is a feature whose return value is a real number in the closed interval [0, 1]. For example:
price_high, price_low : TIMESTAMP × COMPANY_ID → [0,1] price_increasing, price_decreasing :
TIMESTAMP × COMPANY_ID → [0,1]
The value v of the fuzzy feature price_high for a given company c and a given timestamp t denotes the degree of truth of the proposition (or statement) “price of company c is high at time t”. Similar fuzzy features can be defined for volume. It is important to note that each fuzzy feature is in some sense a parameterized fuzzy set.
Now one can easily form fuzzy expressions using the usual fuzzy logical connectives ¬ (not), ∧ (and), ∨ (or), → (implies) etc. Each such expression has a fuzzy degree of truth, which is a real number in the closed interval [0,1]. We use relational expressions involving non-fuzzy primitive features and fuzzy features as building blocks (i.e., fuzzy propositions). Obviously, Boolean expressions (which have the degree of truth as 0 or 1 only) are special cases of the fuzzy expressions; e.g., price(101) < 35.5 is a Boolean expression either true or false at any instant. We omit the timestamp argument from fuzzy expressions to indicate that the fuzzy expression can be evaluated at different times. For example,
• prices of companies 101 and 103 are nearly equal price(101) ≈ price(103)
• if the price of a stock 101 is very high or very low, trading in it is rather low
(very price_high(101) ∨ very price_low(101)) → fairly volume_low(101)
Let TV(F) denote the degree of truth of a formula F. We assume the standard semantics for the fuzzy logical connectives (although many other variations are possible):
TV(¬p) = 1 - TV(p) TV(p ∧ q) = min( TV(p), TV(q) ) TV(p ∨ q) = max( TV(p), TV(q) )
TV(p→q) = TV(¬p ∨ q) = max( 1 - TV(p), TV(q))
Here, ≈ is fuzzy equality defined for stock prices and very, fairly are the well-known truth modifiers:
TV(very p) = TV(p) * TV(p) TV(fairly p) = TV(p)1/2
3.2
Fuzzy Temporal Patterns
Let TIMESTAMP = <t0, t1, …, tN> denote the finite, linearly
ordered timeline consisting of the timestamps that occur in the given temporal databases, where ti < ti+1 for 0 ≤ i < N. Intuitively,
the formula p is true at time instant ti, if p is true at ti and p is true at ti+1 and … and p is true at tN. Generalizing this for fuzzy
propositions is easy:
TV( p) at ti = TV(p) at ti∧ TV(p) at ti+1∧ … ∧ TV(p) at tN
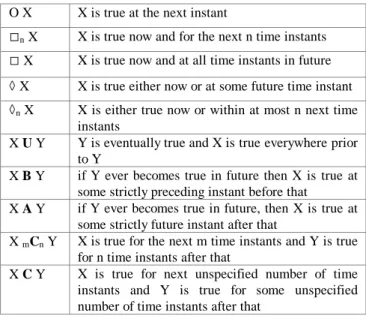
Similarly, the meaning of other future temporal operators can be easily defined. Due to these definitions, since ∧, ∨ are fuzzy connectives, so are the temporal operators in Table 1.
Table 1. Future time connectives in linear temporal logic.
O X X is true at the next instant
n X X is true now and for the next n time instants X X is true now and at all time instants in future
X X is true either now or at some future time instant
n X X is either true now or within at most n next time
instants
X U Y Y is eventually true and X is true everywhere prior to Y
X B Y if Y ever becomes true in future then X is true at some strictly preceding instant before that
X A Y if Y ever becomes true in future, then X is true at some strictly future instant after that
X mCn Y X is true for the next m time instants and Y is true
for n time instants after that
X C Y X is true for next unspecified number of time instants and Y is true for some unspecified number of time instants after that
TV(O p) at ti = TV(p) at ti+1 if i < N
TV(O p) at ti = TV(p) at ti if i = N
TV( n p) at ti = TV(p) at ti∧ TV(p) at ti+1∧ … ∧ TV(p) at tk if i+n≤ N then k = i+n else k=N
= min(TV(p) at ti, TV(p) at ti+1, …, TV(p) at tk)
TV( p) at ti = TV(p) at ti∨ TV(p) at ti+1∨ … ∨ TV(p) at tN
= max(TV(p) at ti, TV(p) at ti+1, …, TV(p) at tN)
TV( n p) at ti = TV(p) at ti∨ TV(p) at ti+1∨ … ∨ TV(p) at tk
if i+n≤ N then k = i+n else k=N
= max(TV(p) at ti, TV(p) at ti+1, …, TV(p) at tk)
Note that if TV( p) = 0.0 if there is even one instant where TV(p) = 0, even though p may have very high values at other instants in future. To reduce the influence of such outliers, we can use the averaging and fuzzy connective defined (in the simplest case) by TV(p ∧ q) = [TV(p) + TV(q)] / 2. However, the averaging and connective is not associative. The meaning of fuzzy temporal connectives can be defined in other ways to take
into account the difference between the instants, rather than implicitly treat all instants as equidistant. Moreover, it is possible to define variations of the connectives like n that refer
to time length rather than number of instants.
Now we are in a position to define fuzzy temporal expressions (which are patterns) using both the fuzzy logical as well as fuzzy temporal connectives and using the given features as building blocks. We assume the existence of suitable features and truth modifiers to construct these patterns. Note that some of these patterns are written better using the past temporal connectives. Obviously, there is no unique way of writing a pattern.
• Broker 5003 does not sell shares of a company 101 until he accumulates roughly 50,000 shares.
( high sell_volume(5003,101)) → (low sell_volume(5003,101) U (accumulated_volume(5003,101) ≈ 50,000) )
• Between the time that the overall trading in a company 101 is low and its price is low and its price is quite steady and the time that its price is increasing sharply, broker 5003 has heavily accumulated the shares of company 101 and buying of others (except broker 5003) in company 101 is fairly low. ( (price_low(101) ∧ volume_low(101) ∧
very low price_fluctuating(101)) ∧ ( very price_increasing(101)) ) → ((high accumulated_volume(5003,101) ∧
low relative_accumulated_volme(5003,101)) U very price_increasing(101) )
3.3
Meta-temporal Facilities
Note that in many patterns we are concerned about stating qualitative relationships among the time intervals that various sub-patterns have a strong presence. For example, Table 2 shows the 13 possible relationships between 2 intervals, as defined in Allen’s interval algebra [1]. One approach to this problem would be to use interval temporal logics like the duration calculus [13], suitably adapted for fuzzy temporal propositions. Another way, discussed here, would provide meta-logical facilities to extract intervals during which a formula is true and also provide suitably fuzzified versions of Allen’s interval algebra, as part of the pattern specification notation. We model a closed time interval as a tuple [ti, tj] as a sub-sequence of the given timeline and say that
it consists of the time points ti, ti+1, …, tj. We introduce the
expression [[ F ]]α to denote the maximally extended time interval where a fuzzy temporal formula F has the average degree of truth above the given threshold α. That is, if [[ F ]]α = [ti,tj]
then ([ TV(F) at ti + TV(F) at ti+1 + … + TV(F) at tj ] / n ) ≥α ,
where n is the number of time instants in the interval [ti, tj]. The
interval [[F]]α is maximally extended in the sense that no time instant can be added to it (say tj+1) without reducing the average
value of F over the extended to interval to less than α.
[a,b] fz_overlaps [c,d] = (b-c) / (d-a)
if [a,b] overlaps [c,d] or [a,b] finishes [c,d] = 0 otherwise
For example, [10,20] fz_overlaps [18,30] = (20 – 18) / (30-10) = 2/20 = 0.1 and [10,20] fz_overlaps [12,20] = (20-12) / (20-10) = 8/10 = 0.8. Other interval relations can be similarly fuzzified [17].
Using these facilities, we can define several useful patterns.
• Large buying tendency within a small time interval leads to a sharp rise in the price
small [[ high buying_tendency(101) ]]0.8 →
(very price_increases(101) U high price_change(101))
Table 2. 13 Relationships in Allen’s Interval Algebra [1].
Relation Example
X before Y [20, 30] before [40,60]
X meets Y [20,30] meets [31,50]
X overlaps Y [20,30] overlaps [25,40]
X during Y [20,30] during [10,50]
X starts Y [20,30] starts [20,50]
X finishes Y [20,30] finishes [10,30]
X equals Y 20, 30] equals [20,30]
X after Y [40,60] after [20,30]
X met_by Y [31,50] met_by [20,30]
X overlapped_by
Y [25,40] overlapped_by [20,30] X contains Y [10,50] contains [20,30]
X started_by Y [20,50] started_by [20,30]
X finished_by Y [10,30] finished_by [20,30]
4.
MODELING TRADING
MALPRACTICES
We now describe some well-known mal-practices in stock market trading in terms of telltale fuzzy temporal patterns in trading databases. Note that the description of mal-practices in this paper is incomplete in the following sense. Not all instances where the trading behaviour matches the patterns necessarily indicate an actual mal-practice; there may be perfectly normal explanations to satisfy the investigators.
We also illustrate how FzPLTL can be used to define fuzzy temporal patterns characterizing the trading for two of these mal-practices. Such patterns can be stated in the SNIFFER tool (see below) and it finds the maximal intervals where the given pattern is present with at least the given strength. We use fuzzy relations
fz_after, fz_during, fz_equal etc. which are fuzzy versions of the corresponding crisp binary relation between intervals (Table 2).
4.1
Price Manipulation
We consider one specific way in which price manipulation of a stock may take place. The individuals try to artificially (and maliciously, with a view to profit making) manipulate the price of a scrip. This is typically achieved by circulating false information or by creating an artificial demand or supply for the scrip. A simple hypothetical instance of the latter strategy is as follows.
(a) A small coterie of influential persons engages in large-scale buying of a company’s shares within a short time period. The company is carefully chosen by the coterie based on certain criteria that make it “nondescript”; e.g., low technology, low traded, low profit making etc. In general, there may be several buying “spurts” by the coterie in this time so that the price rises “sufficiently” in (b). After a well-chosen time point, the coterie stops buying. The investigators look at the large buyers of a non-descript company (whose price was low and steady prior to this buying). They look for a positive correlation between the large buying of these buyers and an increasing trend in the company’s price in the same period. The investigators also verify that buying by the rest of the investors is low in this period.
(b) This price rise leads to a false sense of expectation and consequently a large demand for the scrip is created by the unsuspecting or naïve investors. Then, for a time period, the price and trading of the scrip do not reflect its true value and the price keeps rising and trading by others (i.e., non-coterie investors) also increases. The non-coterie’s buying or selling activities are very low during this period. The investigators look for a negative correlation between the buying of the large-scale buyers in step (a) and the buying by the rest of the investors during this period as well as the increasing trend in the company’s share price.
(c) At an appropriately chosen time point, the coterie sells its stocks at these artificially heightened prices and makes profits. The investigators also verify that the same buyers in (a) are involved in this dumping, that the dumping is done in a short time and that the volumes sold by the coterie are roughly same as those bought by them in (a). They may also have a more specific characterization of the selling point by the coterie (e.g., the selling is done just before the price approaches the last high price).
(d) Partly due to the large scale selling by the coterie and partly because there was to economic basis for the initial price rise, the trading and the price of the company’s shares soon turns downward to reflect its true value. The other investors who bought the stocks at higher prices now suffer a loss. The investigators look for a large drop in the company’s share price immediately following the dumping by the coterie.
market trading, the observed pattern has to be strikingly different from the previous patterns of trading in the target company and it has to be demonstrated that it cannot be easily explained by normal stock market trading phenomena. Additionally, the investigators have to rule out any causal influence of external business and economic conditions. Also they need to make a convincing case that there was no economic basis for the large-scale buying by the coterie and that the price rise was influenced by this large-scale buying by the coterie and not by any external factors. Similar arguments need to be presented for the price crash phase. The investigators’ task becomes particularly tedious when the changes (rise and fall) in price are not overwhelmingly large; in such a case they need to demonstrate that the coterie has made a sufficiently large amount of money by the sheer number of shares they bought and sold. Additional evidence (e.g., rumours, announcements by the company, the lengths and relationships of the periods involved etc.) that can strengthen the hypothesis about the influence of the coterie is often needed. Evidence about the means employed for the manipulation (e.g., sources of shares and funds, the details of the actual transactions involved) is also needed to set up a case. Finally, the investigators need to describe how this instance of price manipulation is a convincing violation of the appropriate fair-trade practice rules and regulations.
It is easy to appreciate that the investigations of mal-practices is a complex, time-consuming and tedious activity and requires great deal of knowledge of finance, economics, stock market trading, business practices, law etc. A comprehensive investigative and surveillance business process (set up by a particular investigative agency) often includes a number of steps and activities: alarms, reports, statistical analysis based on a large number of built-in features, data visualization, background knowledge, data mining etc. The work described here is only a small step in this process. Its aim is to assist the investigators to gather part of the evidence by analyzing the trading databases using fuzzy temporal patterns that they can state as characterizing the mal-practices.
Sub-patterns (a), (b), (c), (d) are defined below. We assume that the identity of the insider coterie is known. In (a) we assume that the coterie indulges in only one buying spurt, whereas in reality they may give several “push” to the market.
steady =def [x0,y0] = [[price_steady ∧ low_price]]0.8
coterie_buying =def [x1,y1] = [[price_increasing ∧
high_coterie_buying_volume ∧ low_relative_buying_volume]]0.8
∧ short [x1,y1] ∧ [x0,y0] fz_before [x1,y1]
price_rises =def [x2, y2] = [[high_price ∧ high_volume ∧
low_coterie_buying_volume]]0.3∧ [x1,y1] fz_before [x2,y2]
coterie_sellout =def [x3,y3] = [[high_price ∧
high_coterie_sell_volume]]0.8 ∧ very short([x3,y3] ∧ [x2,y2]
fz_before [x3,y3]
crash =def [x4,y4] = [[high_volume ∧ price_decreasing]]0.4 ∧
[x3,y3] fz_before [x4,y4]
Overall description of the price manipulation pattern is:
price_manipulation =def steady ∧ coterie_buying ∧ price_rises ∧
coterie_selling ∧ crash
4.2
Insider Trading
Insider trading is characterized by trading activities, which are motivated by and based on information not available to the general public. Typically, the price and volumes traded for a specific company are sensitive to such confidential information; e.g., information related to bonus or rights shares, dividend declarations, board meetings for taking important decisions and finalizing financial results, signing of new contracts, confirmation of large new orders, signing MoUs or partnership deals. This information is usually available, before it is made public, only to the company “insiders” viz., directors, senior managers in the company, large stockholders or even partners like suppliers and clients. In violation of the positions of trust, some of these insiders may indulge either themselves or through proxy and dummy fronts, in buying or selling of the company’s shares. This is done so that after the announcement making the information available to the public, the insiders make profits by the resulting profitable conditions like increased demands or price.
One problem in detecting insider trading concerns the detection of the identities of the insiders involved in the trading transactions. Secondly, insider trading is generally characterized, for example, by the following sequence of activities: (a) significant buying of the company’s shares by a small group of investors within a short time interval (b) availability of an important information to the general public; e.g., through press releases (c) favourable market conditions for the company’s shares; e.g., increased demand and increased price (d) significant selling of the company’s shares by the small group of investors involved in (a) within a short time interval. The number brokers involved in the trading transactions of the insiders is usually not too large.
We now demonstrate the utility of FzPLTL to state some aspects of the insider trading patterns. Sub-patterns (a), (b), (c), (d) are defined as below. We assume that the identity of the insider coterie is known. In (a) we ignore complications like possibility of multiple buying spurts by the coterie. The primitive features price_steady, price_increasing, dividend_declared, high_volume, high_coterie_sell_volume and high_coterie_buy_volume are appropriately defined functions that return a value at each instant.
coterie_buying =def [x1,y1] = [[price_steady]]0.8 ∧ [a1,b1] =
[[high_coterie_buying_volume]]0.8 ∧ short [a1,b1] ∧ [a1,b1]
fz_during [x1,y1]
info_public =def [x2,y2] = [[dividend_declared]]0.9 ∧ [x2,y2]
fz_after [x1,y1]
price_rises =def [x3, y3] = [[price_increasing ∧ high_volume]]0.6
∧ [x1,y1] fz_after [x2,y2]
coterie_sellout =def [x4,y4] = [[high_coterie_sell_volume]] ∧
short [x4,y4] ∧ [x4,y4] fz_during [x3,y3]
insider_trading =def coterie_buying ∧ info_public ∧ price_rises ∧
coterie_sellout
The coterie sellout is generally not followed any price crash.
4.3
Circular Trading
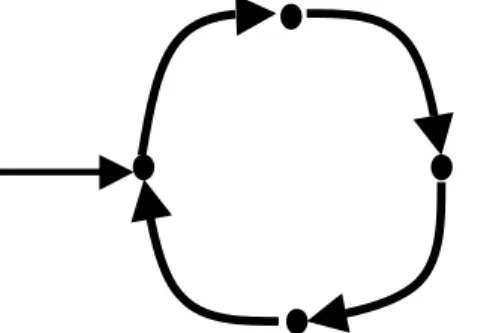
Let σ = T1, T2, …, Tn be a sequence of temporally ordered
transactions for a specific company. That is, for each i, 1 ≤ i < n, Ti.timestamp ≤ Ti+1.timestamp and Ti.Company-ID =
Ti+1.Company-ID. Then σ is said to be a circular transaction if
for each i, 1 ≤ i < n, Ti.Sell-Broker-ID = Ti+1.Buy-Broker-ID and
Tn.Sell-Broker-ID = T1.Buy-Broker-ID (see Figure 1). Note that
we do not require that the quantities involved be the same in the successive transactions. Also, we do not place any restriction on the price paid in successive transactions.
There are several difficulties with this idealized view of circular trading. First, all transactions in a stock exchange, at a broker-level, are bound to be circular, since only brokers are assumed to trade on the stock exchange (i.e., identities of the final buyer or seller are not recorded in the trading databases). Also, such precise circularity is not likely to occur frequently. A more “diffused” circularity is more likely to happen, where a source broker B releases some Q number of shares of a company to a group of dummy brokers B1, B2, …, Bk, who trade this quantity Q
more or less randomly among each other as well as with B and finally (nearly) the same quantity reaches back to B. Some other characteristics of a circular trading which may be significant from a mal-practice point of view are that:
1. The number n of dummy brokers is not too large; and
2. the circular trading may take place in a relatively short time period; and
3. the circular trading involves a significant number of shares of a company; and
4. the price of the shares of the company increase in both the circular trading transactions as well as other transactions by other parties.
Finally, more often, the source broker may itself be a small group, rather than a single broker.
4.4
Takeover Bids
Following patterns characterize the takeover of a company C by a group of brokers G. A small group G of brokers acquires a significant number of shares of a (generally low-priced and low traded) company C in the period under observation. During this period, there is insignificant selling of the shares of company C by this group G. There is not much price fluctuation (in fact, price rise) for shares of company C in this period. At the end of this period, there is a substantial fraction of the issued capital in the hands of G. Moreover, the acquisition is more or less evenly spread over the entire period. Additionally, there may be discernible relationships between the price level, price changes and volume bought by G: in the intervals where price is high or increasing, the volume bought by G reduces and conversely.
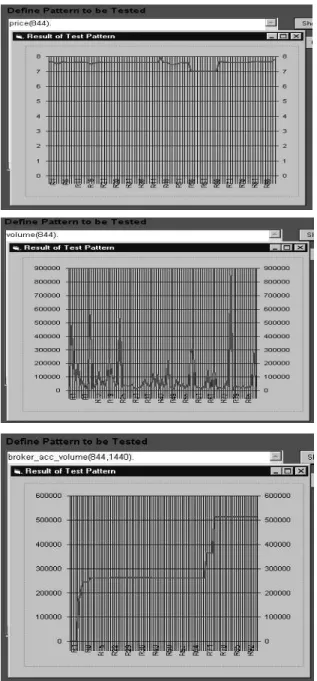
Figures 2 (a) and (b) show the graphs of the primitive features price and volume traded for a specific company over time, as obtained from some actual trading data using the SNIFFER tool.
Note the remarkably steady price and very large trading volumes. It is surprising that such large volumes do not seem to affect the price at all! Note the surges in volumes. Figure 2 (c) shows the relative accumulation of the shares of this company 844 by some broker 1440 over time. The initial 2 spikes in the volume are probably caused by him. Note that during the third spike of his buying, the price was actually lowered! Such patterns, if observed over a long time, may perhaps indicate an attempt at a takeover.
5.
THE SNIFFER TOOL
The SNIFFER research project has the following aims: 1. define the syntax and semantics of a fuzzy temporal logic
2. build a prototype system to define such patterns
3. build a prototype pattern recognition engine that will detect where and how strongly the given pattern is present in the given temporal databases.
SNIFFER provides integrated facilities to define and freely mix (a) crisp domain knowledge in terms of sets, relations etc. and crisp predicate logic rules (b) fuzzy sets (c) fuzzy temporal patterns not necessarily in IF-THEN form. It also has a tabular front end to define fuzzy temporal patterns in IF-THEN form. A prototype version of SNIFFER has been implemented on MS-Windows platform using C and Prolog; a back-end ODBC interface to relational databases is also provided. A small number of built-in features have been provided. Two-weeks of trading data was used to test the SNIFFER prototype tool. The results are encouraging and we plan to enhance the tool further.
6.
CONCLUSIONS AND FURTHER WORK
A comprehensive investigative and surveillance business process includes a number of steps and activities: alarms, reports, statistical analysis, more built-in features, visualisation, background knowledge, data mining etc. SNIFFER is only a stand-alone prototype tool that can handle only a part of these steps. Further work is needed before SNIFFER can support the investigation experts in all steps in such a process.Figure 1. Simplified depiction of circular trading. There may be more complex trading patterns among the partners.
Dots indicate trading partners; arrows indicate trading activities.
An important limitation of SNIFFER is that currently the patterns require the user to supply the identities of the suspects, say company ID or broker ID. This can be an arduous task, requiring significant skills and data analysis. We are exploring the ways in which SNIFFER can be augmented to detect (i.e., search for) such suspects, as characterized by suspicious or alarm patterns. A lot of investigative and financial expertise as well as much tedious tuning are needed to arrive at satisfactory models of various mal-practice in terms on fuzzy temporal patterns. Considerable domain and market knowledge is needed to explain / eliminate spurious instances of characteristic patterns. The descriptions of various mal-practices as well as their characteristic patterns given in this paper are only indicative and by no means complete. Real life instances of such mal-practices are far more complicated; more investigations are needed to build satisfactory pattern-based models of them.
A number of further extensions to this work are possible. FzPLTL is an instance oriented temporal logic. However, an interval-oriented fuzzy temporal logic (e.g., based on Duration Calculus [13]) would perhaps be more useful for specifying patterns in some applications. A facility to freeze the context of a proposition (i.e., to explicitly refer to the instance when it becomes true) [2] would also add some expressive power to the notation. Another useful extension would be the incorporation of the historical (or past oriented) temporal operators. FzPLTL appears to be satisfactory as a general pattern specification mechanism for several applications other than surveillance (e.g., diagnosis), that we are currently investigating.
7.
ACKNOWLEDGMENTS
We sincerely thank Prof. Mathai Joseph for his support and encouragement throughout this research work. We thank Prof. K. V. Nori, Dr. Anantaram, Dr. S. K. Mohanty, Sanjay Pande, Sandip Sharma and other colleagues at TRDDC for useful discussions and feedback. The first author would like to thank Dr. Manasee Palshikar for her tenacity, hope and confidence.
8.
REFERENCES
[1]
Allen J.F., “Towards a General Theory of Action and Time”, Artificial Intelligence, 23(2), Feb. 1984, pp. 123-154.[2]
Alur R., Henzinger T., “A Really Temporal Logic”, Journal of ACM, vol. 41, no. 1, Jan. 1994, pp. 181-204.[3]
Bardossy A., Duckstein L., Fuzzy Rule-based Modeling with Applications to Geophysical, Biological and Engineering Systems, CRC Press, 1995.[4]
Emerson E.A., “Temporal and Modal Logic” in J.V. Leeuwen (ed.), Handbook of Theoretical Computer Science - volume B, Elsevier Science, 1992.[5]
Faloutos C., Ranganathan M., Manolopoulous Y., “Fast Sub-sequence Matching in Time Series Database”, Proc. 1994 ACM SIGMOD, 1994[6]
Fu K.S. Syntactic Pattern Recognition and Applications, Prentice-Hall, 1982.[7]
Inmon W.H. and Osterfelt S., Understanding Data Pattern Processing, QED Technical Publishing Group, 1991.[8]
Kacprzyk J. and Zadrozny S., “Fuzzy Queries in Microsoft Access V.2”, in Fuzzy Information Engg., D. Dubois, H. Prade, R.R. Yager (eds), John Wiley, 1997, pp. 223-232.[9]
Kartalopoulos S.V., Understanding Neural Networks and Fuzzy Logic, Prentice-Hall, 2000.[10]
Kennedy R.L., Lee Y., Roy B.V., Reed C.P., Lippman R.P., Solving Data Mining Problems Through Pattern Recognition, Prentice-Hall PTR, 1998.[11]
Kirkland J.D., Senator T.E., Hayden J.J., Dybala T., Goldberg H.G., Shyr P., “The NASD Regulation Advanced Detection System (ADS)”, Proc. Spring 1999 AAAI Conf., pp. 55-67.[12]
Klir G.J., Folger T.A., Fuzzy Sets, Uncertainty and Information, Prentice-Hall, 1988.[13]
Liu Z., “Specification and Verification in Duration Calculus”, in M. Joseph (ed.), Real-time Systems: Specification, Verification and Analysis, pp. 182-228. Prentice-Hall, 1996.[14]
Maidchhi R., Pernici B., barbie F., “Automatic Deduction of Temporal Information”, ACM Trans. Database Systems, Vol. 17, No. 4, Dec. 1992, pp. 647-688.[15]
Parker D.S., “Stream Data Analysis in Prolog”, in Sterling L. (ed.), The Practice of Prolog, pp. 249-302, MIT Press, 1990.[16]
Palshikar G.K., “A Fuzzy Temporal Notation and Its Application to Specify Fault Patterns for Diagnosis”, To be published in Pattern Recognition Letters.[17]
Palshikar G.K., “Representing Fuzzy Temporal Knowledge”, TRDDC Tech. Report, 2000.[18]
Pathak A., Pal S.K., “Fuzzy Grammars in Syntactic Recognition of Skeletal Maturity from X-Rays”, IEEE Trans. Systems Man Cybernetics, vol. SMC-16, no. 5, Sep./Oct. 1986, pp. 657-667.[19]
Rasmussen D., Yager R.R., “A Fuzzy SQL Summary Language for Data Discovery”, in Fuzzy Information Engg., D. Dubois, H. Prade, R.R. Yager (eds), John Wiley, 1997, pp. 253-264.[20]
Shimakawa H., Kikkawa K., “Trend Recognition with Time Series Database”, Proc. 2nd Far East Workshop on Future Datasbase Systems (Future Databases ’92), World Scientific, 1992.Figure 2. Graphs of the values of the primitive features over time: (a) price of company 844 (b) total traded volume
![Table 2. 13 Relationships in Allen’s Interval Algebra [1].](https://thumb-us.123doks.com/thumbv2/123dok_us/8195462.2172614/5.918.74.444.438.787/table-relationships-allen-s-interval-algebra.webp)