1/28
Title: Microbial residence time is a controlling parameter of the taxonomic composition and
functional profile of microbial communities
1
Running Title : Microbial residence time effects on community
2 3
Authors: Cresten Mansfeldt1*, Stefan Achermann1,2*, Yujie Men3, Jean-Claude Walser4, Kris Villez5,
4
Adriano Joss5, David R. Johnson6, Kathrin Fenner1,2,7
5 6
*These authors contributed equally to this work
7 8
1. Department of Environmental Chemistry, Swiss Federal Institute of Aquatic Science and Technology,
9
Eawag, Überlandstrasse 133, 8600 Dübendorf, Switzerland
10
2. Institute of Biogeochemistry and Pollutant Dynamics, ETH Zürich, 8092 Zürich, Switzerland.
11
3. Department of Civil and Environmental Engineering, University of Illinois, 205 N. Mathews Ave.,
12
Urbana Illinois 61801, USA
13
4. Department of Environmental Systems Science, Genetic Diversity Centre, ETH Zürich,
14
Universitätstrasse 16, 8006 Zürich, Switzerland
15
5. Department of Process Engineering, Swiss Federal Institute of Aquatic Science and Technology,
16
Eawag, Überlandstrasse 133, 8600 Dübendorf, Switzerland
17
6. Department of Environmental Microbiology, Swiss Federal Institute of Aquatic Science and
18
Technology, Eawag, Überlandstrasse 133, 8600 Dübendorf, Switzerland
19
7. Department of Chemistry, University of Zürich, Winterthurerstrasse 190, 8057 Zürich, Switzerland
20 21
Keywords: Diversity, richness, microbial residence time, taxonomic profiling, functional profiling, RNA
22
sequencing, Monod kinetic modelling, activated sludge
23 24
This document is the accepted manuscript version of the following article:
Mansfeldt, C., Achermann, S., Men, Y., Walser, J. C., Villez, K., Joss, A., … Fenner, K. (2019). Microbial residence time is a controlling parameter of the taxonomic composition and functional profile of microbial communities. ISME Journal.
2/28 Abstract:
25
A remaining challenge within microbial ecology is to understand the determinants of richness and
26
diversity observed in environmental microbial communities. In a range of systems, including activated
27
sludge bioreactors, the microbial residence time (MRT) has been previously shown to shape the microbial
28
community composition. However, the physiological and ecological mechanisms driving this influence
29
have remained unclear. Here, this relationship is explored by analyzing an activated sludge system fed
30
with municipal wastewater. Using a model designed in this study based on Monod-growth kinetics, longer
31
MRTs were shown to increase the range of growth parameters that enable persistence, resulting in
32
increased richness and diversity in the modelled community. In laboratory experiments, six sequencing
33
batch reactors treating domestic wastewater were operated in parallel at MRTs between 1-15 d. The
34
communities were characterized using both 16S ribosomal RNA and non-target messenger RNA
35
sequencing (metatranscriptomic analysis), and model-predicted monotonic increases in richness were
36
confirmed in both profiles. Accordingly, taxonomic Shannon diversity also increased with MRT. In
37
contrast, the diversity in enzyme class annotations resulting from the metatranscriptomic analysis
38
displayed a non-monotonic trend over the MRT gradient. Disproportionately high abundances of
39
transcripts encoding for rarer enzymes occur at longer MRTs and contribute to the disconnect between
40
taxonomic and functional diversity profiles.
41 42
Introduction: 43
Environmental microbial communities often house a rich and diverse set of species and expressed
44
enzymes1,2. A remaining challenge within microbial ecology is to understand the mechanisms driving the
45
differences in metabolic and taxonomic diversity between communities3. Of the influencing mechanisms,
46
the microbial residence time (MRT; the average amount of time a microorganism resides in a system) has
47
been postulated to be a key parameter influencing microbial diversity4,5. Recent investigations in
48
engineered systems showed that as MRT increases, the diversity and richness of the community increases
49
as well. However, specific studies exploring the relationship between MRT and community composition
3/28
have shown opposing or more confounded trends6,7 (albeit with differing experimental setups and analysis
51
methods), suggesting that the relationship between MRT of a system and community composition is
52
complex. The influence of MRT is also relevant in natural8 and host-associated systems9 suggesting that
53
more clearly identifying the influence of this parameter on community composition in engineered
54
environments may provide insights that are also relevant to other systems.
55 56
In addition to the influence on taxonomic diversity and composition, communities also express
57
more functions at longer MRT4. In wastewater treatment, functions related to substrate transformation
58
have been demonstrated to emerge at longer MRT, e.g., nitrification and the biotransformation of trace
59
organics10,11. In a survey of 10 wastewater treatment plants, functional richness was positively associated
60
with taxonomic richness, and both parameters were in turn positively associated with plant performance in
61
terms of trace organic contaminant removal12. By contrast, additional studies have noted that expressed
62
functional richness and diversity may not be directly related to taxonomic parameters13-15. In streams16,
63
forests17,18, and host associated communities19, the monitored functional signals were independent of the
64
parameters controlling the taxonomic profiles. Both the taxonomic and functional profiles must be
65
monitored to understand further the linkage between community structure and function and to characterize
66
more accurately the influence of an external variable (such as MRT) on the community20.
67 68
In this study, the influence of the MRT on the observed taxonomic composition and functional
69
profile of microbial communities cultivated in six parallel lab-scale sequencing batch reactors (SBR)
70
treating domestic wastewater was explored experimentally and described using a Monod-model.
71
Wastewater bioreactors provide a controllable experimental system21 with available established
72
computational models22-24 that have provided previous insights into microbial ecological concepts
73
including novel niches and community assembly13. Experimentally, the microbial communities were
74
monitored using 16S-ribosomal RNA (rRNA) and messenger RNA (mRNA) metatranscriptomic
non-75
target sequencing. Recently, 16S-rRNA sequencing has become an established method for analyzing
4/28
bacterial communities25,26 in biotechnological applications, with detailed sample preparation and
data-77
processing pipelines available27. To complement the taxonomic survey, mRNA sequencing (RNAseq) was
78
performed to determine the functional profiles of the communities, for which Enzyme Commission (EC)
79
numbers were used as a proxy for an expressed function. Numerically, Monod growth kinetics were
80
employed in a simplistic MRT-diversity model to provide a concrete mechanistic basis for the connection
81
between the MRT and the community composition within the SBR. This model uniquely investigates the
82
underlying available range of growth parameters that result in persistence within the community.
83
Organisms must survive through substrate-rich and –poor conditions within the SBR, suggesting the main
84
tradeoff in survival strategies available to the organism is the ability to capture resources versus the ability
85
to withstand starvation. Therefore, individual distinctive combinations of the maximum growth rate (μmax) 86
and endogenous decay rate (be) are modelled and considered to be bounded in an ecological range of 87
permissible values. Critically, allowing be, a parameter that has been previously shown to be species-88
specific28, to vary between community members allows for the coexistence of multiple μmax values within 89
a given community. This novel approach permits observing how the MRT, the independent factor in the
90
model, influences the available set of μmax and be values. This simplified view of community composition 91
leads to a better conceptual understanding of the influence of the MRT on the richness and diversity of
92
microbial communities in the studied system.
5/28 Materials and Methods
94
Activated Sludge Reactor Configuration 95
Briefly, six automated sequencing batch reactors (6 × 12 L) treating local municipal wastewater
96
after primary clarification were operated in parallel at MRTs of 1, 3, 5, 7, 10, or 15 days (d) as detailed
97
previously29 and summarized in Supplemental Table 1. Forty-eight days (time-point 1; TP1) and 187 days
98
(time-point 2, TP2) after start-up, activated sludge samples were collected for DNA (at the start of the
99
previously described biotransformation experiment29) and RNA (5 hours after the start of the experiment)
100 extraction. 101 102 Sample Collection 103
To collect samples, culture (two 20-mL samples for TP1 and a 20-mL and 40-mL sample for TP2
104
for DNA and RNA analysis, respectively) was withdrawn and centrifuged at 3,345 x g for 10 min at 4ºC.
105
The supernatant was then discarded and the pellets were stored at -80ºC until further processing.
106 107
DNA/RNA Isolation 108
The total RNA and genomic DNA isolation protocol consisted of a
109
phenol:chloroform:isoamylalcohol extraction followed by either a DNA PowerCleanup PRO Kit (Qiagen,
110
Venlo, Netherlands) or MoBIO RNA Pro Clean-Up Kit (MoBio, Carlsbad, CA, USA) and purification
111
with a TURBO DNase step (ThermoFisher Scientific, Waltham, MA, USA) as detailed in the
112
Supplemental Materials and modified from Johnson et al. 2015. The RNA pellet was re-suspended with
113
diethyl pyrocarbonate (DEPC) treated RNase-free water to a total volume of 50 μl. DNA samples were
114
quantified on a Qubit (Invitrogen, Waltham, MA, USA) analyzer following the manufacturer’s
115
instructions, whereas RNA samples were quantified on a Nanodrop (Invitrogen) and quality-checked on a
116
Bioanalyzer 2000 (RNA 6000 kit; Agilent Technologies, Santa Clara, CA, USA).
117 118 119
6/28 16S Library Preparation and Sequencing
120
In preparation for the 16S sequencing, The total RNA was reverse transcribed into complementary
121
DNA (cDNA) using the Superscript III Kit (Invitrogen) with random hexamer primers following the
122
manufacturer’s instructions. The genomic DNA (gDNA) was used directly after the purification described
123
above.
124 125
The 16S-rRNA or -rDNA amplicon library preparation followed a standard procedure for the
126
Illumina MiSeq platform (Illumina, San Diego, CA) that is detailed in Supplemental Materials 1. Two sets
127
of 16S-rRNA primers (Integrated DNA Technologies, Inc., Skokie, Illinois, USA) were used in this
128
analysis to amplify the sample cDNA and gDNA to account for the potential for the bias of a single
129
primer-set30. The details of primers B1 and B2 are provided in Supplemental Table 2. The samples were
130
sequenced using the PE 300 method on a MiSeq platform (Illumina) at the Genomics Diversity Centre at
131
ETH Zurich, Switzerland. The raw data is publically available at EMBL-EBI under the study number
132
PRJEB22087. The read count per sample and associated rarefaction curves are presented in Supplemental
133
Figures 1 and 2, respectively.
134 135
16S rRNA and rDNA Sequencing Data Processing and Analysis 136
The raw data was checked for quality using FastQC31 v0.11.2. The reported nucleic sequence of
137
the reads was then trimmed using PRINSEQ-lite32 v0.20.4 to a length of 295 bp and merged using
138
USEARCH33 v8.1.1756 (with a minimum overlap of 15 bp, minimum merge-length of 100, and a
139
maximum error of 5 bp). The primers were trimmed from the merged read using cutadapt34 v1.5 with
140
wildcards allowed, a full-length overlap, and an error rate of 0.01. The reads were then filtered using
141
PRINSEQ-lite with an amplicon range of 431-506 and 252-254 for B1 and B2, respectively, a minimum
142
quality mean of 15, and no ambiguous nucleotides allowed. USEARCH was employed to denoise the
143
reads into exact sequence variants (ESVs; zero-level operational taxonomical units, ZOTUs using
144
UNOISE3) and assign taxonomic origin (using usearch_global, 70% identity against the SILVA 16S
7/28
database (release 128), followed by sintax with a 70% identity cutoff). The total number of raw and
146
cleaned reads per sample for the B2 primer ranged from 59,311-191,897 with a median of 113,347 and
147
54,864-185,331 with a median of 104,537, respectively (the details for every sample are provided for
148
primers B1 and B2 in Supplemental Tables 3 and 4, respectively). In total, 99.3% of these reads were
149
binned into 10,644 ESVs, with 2,918 ESVs displaying more than 10 reads in at least one sample. Primer
150
B2 is considered in the main text because more positive and negative controls were analyzed for B2 than
151
B1.
152 153
The resulting data was then analyzed in R v3.5.1 using phyloseq35 v1.24.2 as detailed in
154
Supplemental File 1. The bacterial 16S richness (0D; on rarefied data to remove potential sampling effort
155
effects) and Shannon diversity index (ln(1D); on non-rarefied data) were calculated as n and
156
exp (− ∑𝑛𝑛𝑖𝑖=1𝑝𝑝𝑖𝑖∗ln (𝑝𝑝𝑖𝑖)), respectively, where n is the number of ESVs and pi is the abundance-weighted 157
proportion of ESV i 36-38. When relating metrics throughout this study, Spearman rank-correlation
158
(denoted as r) analyses were employed to avoid imposing assumptions of linearity.
159 160
RNAseq Library Preparation and Sequencing 161
The RNA samples were processed into libraries and sequenced following the Illumina TruSeq
162
Single-End-Read 150 bp pipeline of the Genomics Facility at the University of Basel. In brief, the
163
abundant ribosomal sequences in the samples were degraded to enhance the mRNA fraction using the
164
Ribo-Zero Gold Epidemiology Kit (Illumina) to target Eukaryotic, Bacterial, and Archaeal sequences.
165
During testing, this Epidemiology Kit was found to outperform a sequential application of the Ribo-Zero
166
Gold Bacterial and Eukaryotic Kits (Illumina) on the activated sludge samples (81.3±5.2% versus
167
15.4±1.8% of resulting reads of non-rRNA origin). The adapter addition, sample cleanup, and fragment
168
selection were performed as outlined in the Illumina TruSeq protocol. The samples were then sequenced
169
on a NextSeq 500 Platform (Illumina pipeline 2.4.11). The raw data are publically available at EMBL-EBI
8/28
under the study number PRJEB22087. The quality of the RNA as extracted, RNA after depletion, and
171
resulting fragments are provided in Supplemental Figures 3-5.
172 173
RNAseq Data Processing, Normalization, and Analysis 174
The raw read files were trimmed of adapter sequences, index sequences, and low quality reads
175
using Trimmomatic39 v0.33. The raw and trimmed reads were also checked for quality using FastQC31
176
(Supplemental Figure 6-9). To remove contaminating rRNA reads in silico, the trimmed reads were
177
compared against rRNA databases (Silva version 119 (Bacteria 16S & 23S, Archaea 16S & 23S,
178
Eukaryote 18S & 28S) and RFAM (5S & 5.8S)) and filtered using SortMeRNA40. Sequences passing the
179
quality control were annotated with the descriptors provided in the Enzyme Commission (EC) Number
180
Uniprot database using DIAMOND41 v0.2.1 with the blastx command and a minimum bitscore cutoff of
181
50 (all other parameters set to their default). Because we are primarily investigating EC annotation that
182
can be shared across taxa and not specific genes from individual species, only the best annotation per read
183
was recorded. The full Uniprot-TrEMBL database was created by downloading the database on March 6th,
184
2018 (36.8 billion amino acids in 109 million sequences). The narrower Uniprot-EC database was created
185
by searching for ec:* and downloading all matching hits on March 6th, 2018 (5.8 billion amino acids in
186
14.9 million sequences). The script required to process the raw RNAseq files, generate the database,
187
annotate the reads, and extract the taxonomic Uniprot identifiers is provided as Supplemental File 2. The
188
resulting raw sequencing files contained 41.8-54.4 million reads, of which 72.5-87.7% remained in the
189
dataset after quality and rRNA filtering. In total, 32.8-47.7 million reads per sample were submitted for
190
annotation, resulting in 5.1-9.8 million reads being annotated per sample (Supplemental Table 5;
191
Supplemental Figures 10-11).
192 193
The read counts were aggregated per EC number, and these EC numbers were used as a proxy of
194
the functional profile in this study. When the Uniprot entry that provided the annotation of a read
195
maintained multiple EC numbers, the read was assigned equally to each EC number (<5% of all
9/28
annotations maintained multiple EC designations). The rarefaction curves showed that the richness of EC
197
numbers saturated within the library’s sequencing depth (Supplemental Figure 12). For normalization, the
198
count data was treated compositionally in that the abundance of a specific EC number was divided by the
199
total number of reads identified to encode a protein. The total number of protein encoding reads was
200
determined by first using 500 k reads from each library to search against the full Uniprot-TrEMBL
201
database and then multiplying the fraction annotated with the total number of reads submitted to the
202
Uniprot-EC database (Supplemental Table 5; Supplemental Figure 13).
203 204
MRT-Diversity Model Construction 205
i. MRT-Diversity Model Approach, Assumptions, and Limitations
206
In the MRT-diversity model, Monod-type bacterial growth mathematics42 were employed
207
dynamically to approximate the linkage between the MRT and community composition in the
208
experimental reactor (Figure 1.a). Monod-kinetics use the μmax, be, substrate affinity (Ks), and yield (Y) to 209
describe the growth of an organism’s biomass (X) on a given substrate (S). The approach presented here
210
utilizes these parameters in a novel manner by exploring the range of their combined values (an
211
approximation of community diversity) that leads to persistence over a MRT gradient.
212 213
In our approach, we apply a number of simplifications to typical considerations employed in other
214
Monod-growth based dynamic models24 to determine the range of growth parameters leading to
215
persistence. Specifically, the wastewater is considered a single substrate (e.g., no distinction of
216
carbonaceous or nitrogenous compounds), growth limitations resulting from sources other than substrate
217
availability are considered constant (e.g., mass transfer, toxic product formation, additional substrates),
218
and competition is allowed only for this single substrate. When triggered, assigned flow rates and influent
219
composition are also assumed to be temporally stable to remove variability resulting from other
220
independent variables, and mixing within the reactors is considered perfect (except during the settle
221
phase). Changes in steady-state growth depend only on the maximal gene expression and enzyme kinetics,
10/28
and the availability of the enzyme pool is considered temporally stable thereby neglecting evolution. In
223
turn, this stability is assumed to allow instantaneous adjustments of the growth rate to the change in the
224
substrate concentrations (i.e., time lags have elapsed).
225 226
To capture competition over both substrate-rich and –poor phases, individuals within this model
227
are allowed to be distinct in two growth parameters only: μmax and be. Both internal (consumption of stored 228
substrate) and external (adverse environmental conditions, cell programmed death, and viral attack) decay
229
are considered incorporated in the be parameter 43
; higher order ecological considerations dependent on the
230
consideration of additional substrates such as predation and growth on lysis products are excluded from
231
the model. The maximum and minimum μmax and be values are bounded by ecological limits, and a 232
constraining combination of growth parameters must be satisfied by the range. In summary, the main
233
uncertainties in the model include the appropriateness of restricting the analysis to a single substrate, the
234
placement of the constraining growth parameters, the uncertain assignment of the ecological constraints,
235
and the exclusion of other contributors to diversity such as population oscillation and the time to reach
236
equilibrium44.
237 238
ii. Role of μmax and be in the MRT-Diversity Model
239
To conceptualize the interaction of the μmax, be, and MRT within the MRT-Diversity model of a 240
SBR, the solution for the minimum substrate concentration (S*min) that leads to persistence in a 241
continuously stirred tank reactor45 (Supplemental Materials 2) provides a simplified analogy that can be
242
written without including differential equations:
243
𝑆𝑆𝑚𝑚𝑖𝑖𝑛𝑛∗ =(𝜇𝜇𝑚𝑚𝑚𝑚𝑚𝑚(1+𝑏𝑏−𝑏𝑏𝑒𝑒𝑒𝑒∗𝑀𝑀𝑀𝑀𝑀𝑀)∗𝑀𝑀𝑀𝑀𝑀𝑀−1) 𝐾𝐾𝑠𝑠 Eq. 1 244
where all parameters were defined previously. Organisms with the lowest calculated S*min values will 245
persist in the reactor because they will outcompete other community members for the sole resource. In
246
previous models, a single surviving species would be selected because of the hypothesized inability of
247
other organisms to exactly match the μmax, Ks, and be combination required for persistence in the reactor 45
.
11/28
Notably, we relax this constraint and allow multiple organisms to grow on a single substrate. Modelling
249
co-existing combinations of growth parameters explores whether we can predict richness and diversity
250
values similar to the experimentally observed values over a MRT gradient.
251 252
In developing this Monod-kinetics model of multiple organisms for the investigated SBR (Figure
253
1.a), the combination of growth parameters that are allowed at a given MRT is simply given by the
254
maximum and minimum μmax and be values that persist in the reactor to represent competition in both the 255
resource-rich and –poor operating phases (Figure 1.b). The Ks influences the μmax values leading to 256
persistence in the reactor less than be (Supplemental Figure 14) because it represents another component 257
of resource capture rather than variations in survival during low or no production. Ks was therefore held 258
constant to minimize model complexity. The line of growth parameter combinations that results in
259
persistence (and determined by the equations detailed below) is required to fall within a roughly set
260
ecological range and to pass through constraining growth parameters (μmax,constrain and be,constrain; values that 261
are initially assumed to remain unchanged between reactors, arbitrarily set to the center of the range, and
262
explored further in Supplemental Figure 15). To establish the permissible ecological values of be, the 263
extremes of previously reported observations (from ~0.02 47,48 to ~0.2 d-1 49) were used as approximate
264
boundaries (be,eco; 0.02 to 0.2 d -1
), and an average value (0.11 d-1) was selected as the be,contrain (Table 1). 265
The μmax,eco boundaries (0.2 to 9.8 d -1
) were set to exceed the range of values reported for a previous MRT
266
gradient50, and an average value of 5 d-1 was selected as the μmax,contrain (Table 1). The model was found to 267
be rather insensitive to the selection of these constraining points (Supplemental Figure 15).
268 269
iii. SBR Differential Equations
270
The combination of growth parameter values resulting in persistence (i.e., non-zero steady-state
271
concentrations) across the ecological range were determined with the following system of differential
272
equations that describes the flow, biomass, and substrate concentrations within the SBR (Figure 1.a):
273 𝑑𝑑𝑑𝑑
𝑑𝑑𝑑𝑑 =𝑄𝑄𝑖𝑖𝑛𝑛− 𝑄𝑄𝑐𝑐𝑐𝑐𝑐𝑐𝑐𝑐𝑖𝑖𝑐𝑐𝑖𝑖𝑐𝑐𝑑𝑑 𝑑𝑑𝑐𝑐𝑐𝑐𝑖𝑖𝑛𝑛− 𝑄𝑄𝑚𝑚𝑖𝑖𝑚𝑚𝑐𝑐𝑑𝑑 𝑑𝑑𝑐𝑐𝑐𝑐𝑖𝑖𝑛𝑛 Eq. 2 274
12/28 𝑑𝑑𝑋𝑋𝑖𝑖 𝑑𝑑𝑑𝑑 =�−𝑋𝑋𝑖𝑖(𝑡𝑡)∗ 𝑄𝑄𝑚𝑚𝑖𝑖𝑚𝑚𝑐𝑐𝑑𝑑 𝑑𝑑𝑐𝑐𝑐𝑐𝑖𝑖𝑛𝑛/𝑉𝑉(𝑡𝑡) +� 𝜇𝜇𝑚𝑚𝑚𝑚𝑚𝑚,𝑖𝑖∗𝑆𝑆(𝑑𝑑) 𝐾𝐾𝑠𝑠+𝑆𝑆(𝑑𝑑) − 𝑏𝑏𝑐𝑐,𝑖𝑖� ∗ 𝑋𝑋𝑖𝑖(𝑡𝑡)� � 𝑛𝑛 𝑖𝑖=1 Eq. 3 275 𝑑𝑑𝑆𝑆 𝑑𝑑𝑑𝑑=�𝑆𝑆𝑖𝑖𝑛𝑛∗ 𝑄𝑄𝑖𝑖𝑖𝑖 𝑑𝑑(𝑑𝑑)−(𝑄𝑄𝑐𝑐𝑐𝑐𝑐𝑐𝑐𝑐𝑖𝑖𝑐𝑐𝑖𝑖𝑐𝑐𝑑𝑑 𝑑𝑑𝑐𝑐𝑐𝑐𝑖𝑖𝑛𝑛+𝑄𝑄𝑚𝑚𝑖𝑖𝑚𝑚𝑐𝑐𝑑𝑑 𝑑𝑑𝑐𝑐𝑐𝑐𝑖𝑖𝑛𝑛)∗ 𝑆𝑆(𝑡𝑡)/𝑉𝑉(𝑡𝑡)− ∑ � 𝜇𝜇𝑚𝑚𝑚𝑚𝑚𝑚,𝑖𝑖∗𝑆𝑆(𝑑𝑑) 𝐾𝐾𝑠𝑠+𝑆𝑆(𝑑𝑑) � ∗ 𝑋𝑋𝑖𝑖(𝑑𝑑) 𝑌𝑌 𝑛𝑛 𝑖𝑖=1 � Eq. 4 276
where the flowrates are triggered during their respective cycles (and are zero otherwise); the i subscript
277
indicates parameters and biomass for the ith combination of growth parameters (ranging from 1 to n) that
278
were modelled simultaneously; and all other parameters are defined in Table 1 and further described in
279
Supplemental File 3. To ensure flow balance across the SBR cycle (Figure 1.a), the Qclarified drain is 280
calculated to offset the Qin and Qmixed drain (outflow of suspended biomass): 281
𝑄𝑄𝑐𝑐𝑐𝑐𝑐𝑐𝑐𝑐𝑖𝑖𝑐𝑐𝑖𝑖𝑐𝑐𝑑𝑑𝑑𝑑𝑐𝑐𝑐𝑐𝑖𝑖𝑛𝑛= 𝑄𝑄𝑖𝑖𝑖𝑖∗𝑑𝑑𝑖𝑖𝑖𝑖−𝑄𝑄𝑑𝑑𝑚𝑚𝑖𝑖𝑚𝑚𝑒𝑒𝑚𝑚𝑐𝑐𝑐𝑐𝑚𝑚𝑑𝑑𝑖𝑖𝑐𝑐𝑖𝑖𝑒𝑒𝑚𝑚𝑚𝑚𝑑𝑑𝑚𝑚𝑖𝑖𝑖𝑖𝑚𝑚𝑑𝑑𝑚𝑚𝑖𝑖𝑖𝑖∗𝑑𝑑𝑚𝑚𝑖𝑖𝑚𝑚𝑒𝑒𝑚𝑚𝑚𝑚𝑑𝑑𝑚𝑚𝑖𝑖𝑖𝑖 Eq. 5 282
where all parameters are defined in Table 1. Notably, the MRT is determined as the full volume of the
283
reactor divided by the total volume of suspended biomass removed (Qmixed drain*tmixed drain) per six cycles 284
(one day).
285 286
An iterative approach was used to calculate the μmax values resulting in persistence for nine be 287
values distributed across the ecological range. A full solution line was then fit to these nine points (Figure
288
1.b). This solution line was found to depend only on those parameters directly influencing μmax, be, and 289
MRT and was insensitive to changes in other global parameters such as the Sin, Y, and Ks. All differential 290
equations mentioned in this study were analyzed using deSolve51 v1.21, and all calculations were
291
performed in R v3.5.1 (Supplemental File 3).
292 293
iv. MRT-Diversity Model Alpha Diversity Calculation
294
After determining the solution (Figure 1.b), the length of the line representing all combinations of
295
μmax and be leading to survival within the reactor was then calculated: 296
Growth Parameter Solution Length =�� 𝜇𝜇𝑚𝑚𝑚𝑚𝑚𝑚,𝒎𝒎𝒎𝒎𝒎𝒎−𝜇𝜇𝑚𝑚𝑚𝑚𝑚𝑚,𝒎𝒎𝒎𝒎𝒎𝒎
𝜇𝜇𝑚𝑚𝑚𝑚𝑚𝑚,𝑒𝑒𝑐𝑐𝑒𝑒,𝒎𝒎𝒎𝒎𝒎𝒎−𝜇𝜇𝑚𝑚𝑚𝑚𝑚𝑚,𝑒𝑒𝑐𝑐𝑒𝑒,𝒎𝒎𝒎𝒎𝒎𝒎� 2 +� 𝑏𝑏𝑒𝑒,𝒎𝒎𝒎𝒎𝒎𝒎−𝑏𝑏𝑒𝑒,𝒎𝒎𝒎𝒎𝒎𝒎 𝑏𝑏𝑒𝑒,𝑒𝑒𝑐𝑐𝑒𝑒,𝒎𝒎𝒎𝒎𝒎𝒎−𝑏𝑏𝑒𝑒,𝑒𝑒𝑐𝑐𝑒𝑒,𝒎𝒎𝒎𝒎𝒎𝒎∗Scaling Factor� 2 Eq. 6 297
where the Scaling Factor is set to 0.25 to represent a case when the μmax range contributes more to the 298
length than the be (emphasizing the fact that be serves more to allow the coexistence of different μmax 299
13/28
values rather than contribute to diversity directly; see Supplemental File 3). The growth parameter
300
solution length is utilized as a proxy for the richness of a community; this length will most likely be an
301
underestimate of true richness as a result of binning organisms (or ESVs when comparing to 16S data) that
302
display the identical combination of growth parameters. The Shannon diversity index was determined by
303
numerically solving differential equations for the steady-state biomasses (Xi(steady-state)) when 304
considering the number of distinct combinations of growth parameters within the community to be the
305
length of the range multiplied by a constant value (n = 50; discretionarily set to achieve an integer value
306
representative of community size and a timely computation of the differential equations). The
307
instantaneous substrate utilization rate (ktheo) was calculated as the maximum substrate utilization rate 308
determined at the beginning of one cycle.
14/28 Results and Discussion:
310
Observed Taxonomic Richness and Diversity Increases with MRT 311
The ESV richness increases monotonically across the MRT gradient for the active community
312
members, i.e., the 16S rRNA (Spearman rank correlation r = 0.98 and 0.89 for TP1 and TP2,
313
respectively), but displays a lower correlation to a monotonic trend for the present community members,
314
i.e., the 16S rDNA (r = 0.81 and 0.77 for TP1 and TP2, respectively)(Figure 2.a & b). Additionally, the
315
abundance weighted diversity metric, the Shannon diversity index, shows a decelerating increase in the
316
rRNA transcripts which levels off above 5.1. Overall, the observed increase in the Shannon diversity value
317
between 3 to 10 d (i.e., a mean±s.d. of 4.6±0.27 to 5.3±0.20, respectively) agrees with a previous study
318
investigating lab-scale synthetic wastewater-treating membrane bioreactors (MBRs)52. Other studies
319
utilizing synthetic wastewater indicated no substantial difference between the community diversity metrics
320
at ~2 and 10 d MRT in a MBR system6,7, or a decrease in diversity from 3 to 8 d MRT in a SBR system53.
321
These studies also employed other sequencing techniques such as denaturing gel gradient electrophoresis7
322
and terminal restriction length polymorphism analysis53 that can affect the exact quantified values, but are
323
not expected to affect the reported trends of stable or decreasing diversity metrics. By contrast,
324
investigations of full-scale WWTPs reported a comparable increase in diversity metrics at longer
325
MRT4,5,54, suggesting that real wastewater is required to consistently display a direct MRT-diversity
326
relationship as also observed here.
327 328
Of the fifteen highlighted orders (Figure 2.c & d), six (Burkholderiales, Rhodocyclales,
329
Myxococcales, Sphingobacteriales, Rhodobacteriales, and Pseudomonadales) were previously
330
demonstrated to be commonly shared by a wide variety of activated sludge55,56. Across a set of 13 Danish
331
WWTPs, genera of the Thiotrichales order were abundantly observed in only two WWTPs, highlighting
332
the potential transient nature of this population in WWTPs56. At both time-points, the relative 16S rRNA
333
transcript abundance of Burkholderiales decreases by nearly a factor of two with increasing MRT (from
334
41.3±0.30% to 19.6±0.23% and 37.5±0.60% to 21.1±0.15% of the community for TP1 and TP2,
15/28
respectively) consistent with a previous study4, whereas Rhodocyclales (from 21.2±0.44% to 41.3±0.20%
336
and 12.3±0.21% to 19.6±0.59%) and Myxococcales (from 0.11±0.30% to 12.2±0.38% and 0.14±0.01% to
337
5.7±0.12%) show increasing abundances. Additionally, a low abundance subpopulation capable of
338
oxidizing ammonia to nitrate, the Nitrosomonadales, established at longer MRT when nitrification was
339
noted28 and expected57.
340 341
The relative distribution of the orders are maintained in both the TP2 16S rRNA and rDNA
342
profiles (Spearman r for the top 50 orders of 0.90, 0.88, 0.80, 0.74, 0.72, and 0.60 for 1, 3, 5, 7, 10, 15 d
343
MRT, respectively). However, the profile in TP1 was substantially more variable (r = 0.27, 0.33, 0.47,
344
0.47, 0.38, and 0.25, respectively). This divergence is attributed to the detection of unique orders
345
(Caldilineales, Lactobacillales, Micrococcales) and to the over-abundance of members within the
346
Thiotrichales order in the TP1 rDNA profile (Figure 2.c). This over-abundance suggests that the
347
filamentous Thiotrichales in TP1 causes a negative selection event in those reactors in which the most
348
dominant organism by biomass (rDNA) is not the most active or productive (rRNA)58. This more variable
349
signal also results in the Nitrosomonadales order displaying a 10- to 100-fold lower rDNA than rRNA
350
signal (Figure 2.c and d), obscuring the ability to detect the known MRT-dependent emergence of this
351
organism and its causal relationship to nitrification59. Overall, the 16S results suggest that the expression
352
of 16S rRNA is more reflective of activity than the detection of an organism (16S rDNA) in the activated
353
sludge experiments, supporting previous findings in surveys of other aerobic systems60.
354 355
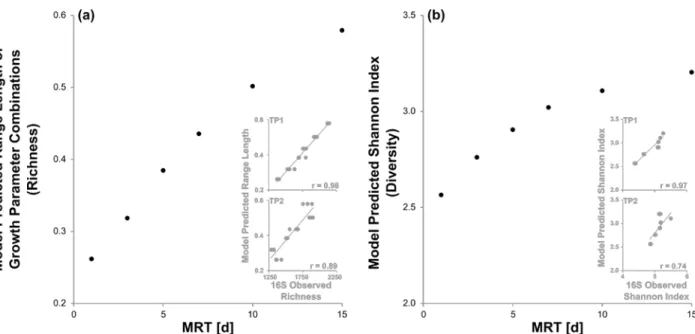
MRT is a Driver of Modeled Taxonomic Richness and Diversity 356
In the constructed MRT-diversity model, increasing the MRT expands the range of combinations
357
of μmax and be values that lead to persistence (Figure 1.b; Supplemental Table 6). Strikingly, the increase in 358
the range of growth parameters (Figure 3.a) strongly correlates with the 16S rRNA observed richness
359
(Figure 2.a and b) with r-values of 0.98 and 0.89 for TP1 and TP2, respectively (Figure 3.a inset). In terms
360
of previously developed theories of microbial ecology, reducing the community complexity into tradeoffs
16/28
between parameters that describe resource capture and represent survival during low-production (μmax and 362
be, respectively; components of the Competition-Stress-Ruderal continuum 61,62
) recaptures the trend of
363
increasing richness across the MRT range for the SBR. When utilizing a variable parameter that is
364
independent of the substrate concentration (be), the maximum effect resulting from the difference in ability 365
to withstand low-production occurs when no substrate is present, a critical component to capture in the
366
dynamic model of SBRs. By comparison, when considering only variation in the parameters describing
367
resource capture (μmax and Ks; components of the r/k-specialist model 63
; Supplemental Figure 14), the
368
influence of both μmax and Ks diminishes as the substrate concentration approaches zero, challenging the 369
applicability of the resource-capture-only framework in SBR systems with extended react phases.
370 371
Although a range of growth parameters will persist (Figure 1.b), the organisms they represent will
372
be present at various abundances at steady-state (Xi in Figure 1.c). The Shannon diversity for the SBR 373
shows a decelerating increase with MRT (Figure 3.b), matching the 16S rRNA observed data (r = 0.97 and
374
0.74 for TP1 and TP2, respectively (Figure 3.b inset)). An underlying assumption in this comparison is
375
that the ratio of the biomass resulting from a given combination of growth parameters to the number of
376
representative rRNA transcripts is constant; however, this ratio varies even at the gene copy per genome
377
level64. Therefore, the general trend of the curve is informative of whether the MRT influences the
378
diversity, but the magnitude of the shifts would be substantially affected by this rRNA-to-biomass ratio.
379 380
The substrate consumption rate of the entire activated sludge community is often monitored
381
through respirogram bulk tests (i.e., biomass normalized maximal oxygen uptake rate (OUR) analyses)65
382
and has been previously reported to slow with increasing MRT50,66, suggesting an adaptation of the
383
community. Our model allows predicting the instantaneous substrate utilization rate (ktheo), and the 384
previously published slowing trend is not observed from the initial default parameters (modelled ktheo of 385
5.0 and 5.8 d-1 at 1 and 15 d, respectively). This disconnect likely stems from underlying assumptions of
386
our model, most notably fixing constraining central growth parameters (μmax,constrain and be,constrain). 387
17/28
However, when using be,ecomax as be,constrain instead, the decreasing trend in the previously reported empirical 388
values is successfully mirrored (ktheo of 4.8 and 4.1 d -1
at 1 and 15 d, respectively) while the diversity
389
profiles are conserved. Therefore, ambiguity remains regarding the accurate placement of these
390
controlling parameters as well as the ecological range parameter values.
391 392
Overall, these observed and modelled results complement a previous study monitoring an
393
activated sludge reactor for 313 days in a 30, 12, 3, 30 d MRT disturbance cycle, in which an increased
394
diversity was noted for the higher MRT values4,67. In that study, two mechanisms were proposed that
395
contribute to the higher richness and diversity: decreases in unconsumed resources (analogous to
396
decreases in the S*min in Eq. 1 or an increase in the length of the starvation phase in the SBR) and increases 397
in niche space (represented by the range of growth parameters and assumed to represent the richness in the
398
MRT-diversity model). Our model uses the MRT and growth parameters to represent these two
399
mechanisms in separate equations and predicts that the richness increases as the availability of
400
unconsumed resources decreases across the observed MRT range (Figure 3). Notably, the MRT-richness
401
profile can display a non-monotonic trend at higher MRT or by placing the constraining growth
402
parameters (μmax,constrain or be,constrain) close to the ecological limits. By contrast, the availability of 403
unconsumed resources will consistently decrease with increasing MRT. Notably, observing a
non-404
monotonic MRT-richness relationship would suggest that niche space contributes more to diversity. In
405
future studies, the potential for this non-monotonic profile should be tested by establishing reactors
406
exceeding the maximum MRT observed here (Figure 2.a and b). Additionally, uncovering a transition
407
from a monotonic to non-monotonic MRT-richness relationship would assist in testing the underlying
408
assumptions of the model and more accurately estimating the ecological ranges and constraining growth
409
parameters.
410 411
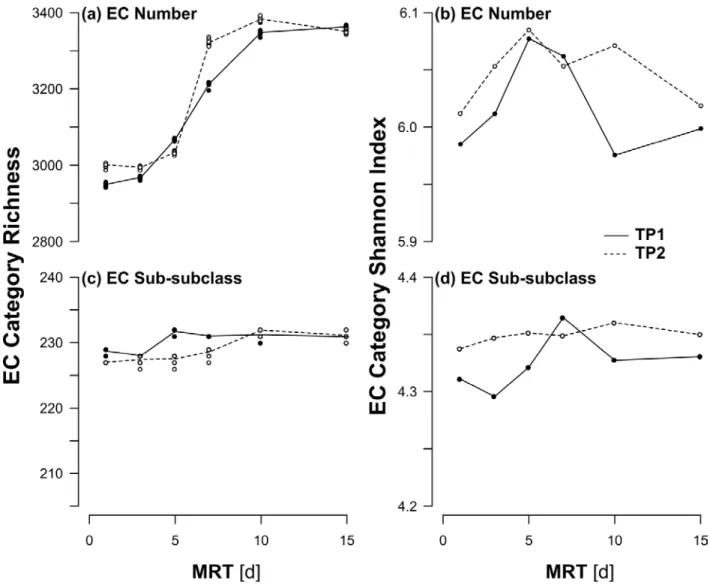
Observed Functional Richness, but not Diversity, Increases with MRT 412
18/28
With increasing MRT, conceptually either an organism absent at lower MRT may occupy the
413
additional growth parameter space or a shared microorganism across MRT expresses different functional
414
enzymes. To test for shifts in the functional profile, the metatranscriptomes of the experimental
415
communities were sequenced, annotated as EC numbers, and analyzed using alpha diversity indicators of
416
the number of unique (richness) and evenness of the relative abundance (Shannon diversity index) of the
417
EC sub-subclasses and numbers (Figure 4). Similar to what was noted in a previous study, the 16S rRNA
418
taxonomic and EC number richness of both time-points display a strong correlation (r = 0.98 and 0.97 for
419
the TP1 and TP2 samples, respectively)12 and a nearly monotonic increase with MRT in richness (Figure
420
2.a and b; Figure 4). This relationship between the taxonomic and functional richness is not as consistently
421
strong with the 16S rDNA (r = 0.81 and 0.94, respectively). These results again highlight that a measure
422
more reflective of current activity within the cell (16S rRNA) links better with the overall functional
423
profile (mRNA) than a survey of presence alone (16S rDNA). When considering the relative abundances
424
of a given EC sub-subclass or number, the Shannon diversity displays a non-monotonic profile,
425
contrasting the taxonomic profiles and the EC sub-subclass or number richness. This disconnect between
426
taxonomic and functional diversity has been previously demonstrated in model wastewater reactors13,
427
suggesting that this result represents a true signal beyond simple limitations with the 16S rRNA measure
428
(e.g., abundance not always correlating with growth rate, inter-species differences in copy numbers per
429
cell68, steep ecological gradients across the SBR cycle). However, the disconnect between the functional
430
richness and Shannon diversity indicates that although the quantity of EC sub-subclasses or numbers
431
increases across the gradient, specific categories increase in dominance at longer MRTs, offsetting the
432
increased richness (Figure 4).
433 434
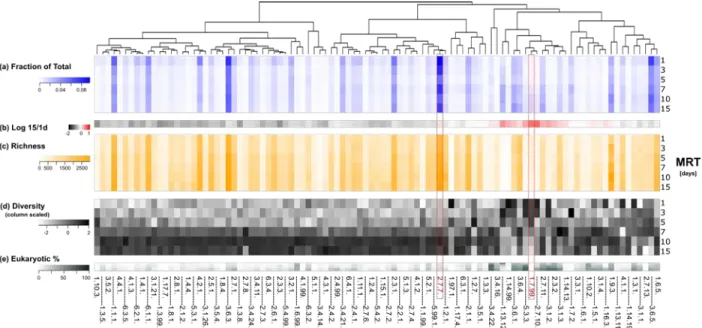
The Relative Abundance Shifts of “Rare” Enzyme Classes Drive the Functional Diversity Profile 435
Several overrepresented EC sub-subclasses in terms of observed abundance (Figure 5.a), e.g., the
436
2.7.7 nucleotidyltransferase (containing 2.7.7.6 RNA-polymerase, RpoB) and 5.99.1 other-isomerase
437
(containing 5.99.1.2 DNA topoisomerase) EC sub-subclass, decrease in their fractional share of the
19/28
metatranscriptome as the MRT increases (Figure 5.b). Simultaneously, the fractional share of
sub-439
subclasses that include oxidoreductases and nitrogen-processing related enzymes that are linked to the
440
emergence of nitrification over the MRT gradient (e.g., nitrogenous oxidoreductase with [1.7.2] and
441
without [1.7.99] cytochrome) increase (Figure 5.a and b). The over-abundance of nitrogen
metabolism-442
related gene transcripts has been previously noted in activated sludge even when nitrifiers are a minor
443
fraction of the community69. Notably, these EC sub-subclasses and associated numbers that markedly
444
increase in abundance over the MRT induced the non-monotonic functional diversity profile, indicating
445
that substantially different abundances of mRNAs encoding for specific enzymes are likely required to
446
achieve those growth parameters resulting in persistence. The discrepancy between the non-monotonic
447
functional diversity profile of all EC numbers and the monotonic taxonomic diversity profile for a single
448
targeted transcript (e.g., 16S-rRNA) results from enzymes displaying additional properties70 such as
449
specific substrates affinities, product turnover rates71, and protein-to-transcript ratios72,73 that affect their
450
relative fractional abundances.
451
452
To compare the observed diversities within each EC sub-subclass (similar to the 16S-rRNA
453
analysis), specific taxonomic richness and diversity values were calculated based on the putative
genus-454
level organism-origin annotation that each mRNA read is assigned (Figure 5.c and d, respectively).
455
Focusing on the aforementioned 2.7.7 and 1.7.99 sub-subclasses to highlight categories demonstrated to
456
be common and rare, respectively (Figure 5.c), the diversity profile of the common EC sub-subclass 2.7.7
457
displays a positive relationship with that of the 16S rRNA (Figure 2; r = 0.89 and 0.59 for TP1 and TP2
458
Shannon indices, respectively). In contrast, a divergent profile is seen for the taxonomic diversity of the
459
rare 1.7.99 sub-subclass (r = -0.65 and -0.76 for TP1 and TP2, respectively), indicating that select
460
organisms dominate the origin of the reads within this category at higher MRTs. Notably, reads from the
461
nitrifying Nitrospira74 dominate the 1.7.99 sub-subclass. The nitrification rate intensifies across the MRT
462
gradient, suggesting that Nitrospira expressed the proper bulk-growth parameters to persist and thrive
463
within the community. The greater share of the overall reads transcribed resulting from a single,
20/28
nitrification-related organism contributed to the noted decrease in functional diversity of the overall
465
community (Figure 4) .
466 467
When further binning reads into Domain-level taxonomic origin, a substantial fraction of
468
annotations originating from Eukaryotic organisms (Figure 5.e) were noted for certain EC sub-subclasses
469
increasing in abundance over the MRT gradient (Figure 5.a). In activated sludge, increasing MRT over the
470
studied range have been reported to promote a higher abundance of Protozoa75, organisms that are
471
overlooked in bacterial-targeted taxonomic surveys of WWTPs. This signal in the mRNA data could
472
confound the previous comparison between the taxonomic and functional diversity metrics. However,
473
when reanalyzing the functional diversity metrics (Figure 4) for the Bacterial portion (Eukaryotic filtered),
474
a similar profile is obtained (Supplemental Figure 19), supporting the detection of a true distinction
475
between the taxonomic composition and the functional profile.
476 477
Conclusions 478
As demonstrated experimentally, increasing the MRT positively affects the taxonomic richness
479
and diversity as well as functional richness of the monitored activated sludge community. To
480
conceptualize these findings, a naïve model was constructed that utilized Monod-kinetics in a novel
481
manner by considering wastewater as a single substrate and the community as a collection of growth
482
parameter combinations. Combinations of μmax and be values were selected to represent the tradeoff 483
between resource capture and survival during low production, reflecting considerations within the C-S-R
484
description of microbial ecology. This MRT-diversity model predicted that the range of μmax and be values 485
expands with increasing MRT for the studied system, suggesting a new, kinetic parameter-driven metric
486
that correlates strikingly well with the observed taxonomic profile and the functional richness across the
487
MRT gradient. For a new community member to occupy these opened growth parameter combinations
488
and thereby increase the taxonomic richness, previously unobserved EC numbers are likely required
489
because of the noted increases in functional richness. In contrast to the taxonomic abundance-weighted
21/28
diversity, the functional diversity displayed a non-monotonic trend over the MRT range. Whereas more
491
EC sub-subclasses and numbers are detected at higher MRTs, their fractional share of the overall activity
492
of the community varies depending on the expressed function. For example, rare sub-subclasses related to
493
nitrification substantially increase in dominance at longer MRTs in this system. Although the complexity
494
of the relationship between EC numbers is not successfully captured, the simplification of the community
495
into combinations of μmax and be values appears to be a useful approximation for predicting changes in 496
taxonomic richness and diversity as well as functional richness over a MRT gradient in this system.
497
Because this study is the first to employ Monod-kinetics in this manner, future work should determine
498
whether the approach and assumptions introduced here are valid when used to describe other systems,
499
explore the concepts of the constraining growth-parameter combination and ecological boundary values,
500
and subdivide influent resources into individual substrate types (e.g., nitrogen-containing compounds).
501 502
Conflict of Interest: 503
The authors declare no conflicts of interest.
504 505
Acknowledgements: 506
Data produced and analyzed in this paper were generated in collaboration with the Genetic
507
Diversity Centre (GDC), ETH Zurich, Switzerland and the Genomics Facility at the University of Basel,
508
Switzerland. We thank the operators and the staff of the WWTP ARA Niederglatt for providing activated
509
sludge. We acknowledge financial support from the European Research Council under the European
510
Union’s Seventh Framework Programme (ERC grant agreement no. 614768, PROduCTS). We also thank
511
Dr. Paola Meynet for assistance in the preparation of the 16S control libraries.
512 513
22/28 References:
514
1. Curtis, T. P., Sloan, W. T., and Scannell, J. W. (2002). Estimating prokaryotic diversity and its limits. Proceedings of
515
the National Academy of Sciences, 99(16), 10494-10499.
516
2. Locey, K. J., and Lennon, J. T. (2016). Scaling laws predict global microbial diversity. Proceedings of the National
517
Academy of Sciences, 113(21), 5970-5975.
518
3. Antwis, R. E., Griffiths, S. M., Harrison, X. A., Aranega-Bou, P., Arce, A., Bettridge, A. S., et al. (2017). Fifty
519
important research questions in microbial ecology. FEMS Microbiology Ecology, 93(5).
520
4. Vuono, D. C., Benecke, J., Henkel, J., Navidi, W. C., Cath, T. Y., Munakata-Marr, J., et al. (2015). Disturbance and
521
temporal partitioning of the activated sludge metacommunity. The ISME Journal, 9(2), 425-435.
522
5. Meerburg, F. A., Vlaeminck, S. E., Roume, H., Seuntjens, D., Pieper, D. H., Jauregui, R., et al. (2016). High-rate
523
activated sludge communities have a distinctly different structure compared to low-rate sludge communities, and are
524
less sensitive towards environmental and operational variables. Water Research, 100, 137-145.
525
6. Bagchi, S., Tellez, B. G., Rao, H. A., Lamendella, R., and Saikaly, P. E. (2015). Diversity and dynamics of dominant
526
and rare bacterial taxa in replicate sequencing batch reactors operated under different solids retention time. Applied
527
Microbiology and Biotechnology, 99(5), 2361-2370.
528
7. Akarsubasi, A. T., Eyice, O., Miskin, I., Head, I. M., and Curtis, T. P. (2009). Effect of sludge age on the bacterial
529
diversity of bench scale sequencing batch reactors. Environmental Science & Technology, 43(8), 2950-2956.
530
8. Fang, H., Chen, Y., Huang, L., and He, G. (2017). Analysis of biofilm bacterial communities under different shear
531
stresses using size-fractionated sediment. Scientific Reports, 7(1), 1299.
532
9. Roager, H. M., Hansen, L. B., Bahl, M. I., Frandsen, H. L., Carvalho, V., Gøbel, R. J., et al. (2016). Colonic transit time
533
is related to bacterial metabolism and mucosal turnover in the gut. Nature Microbiology, 1(9), 16093.
534
10. Kreuzinger, N., Clara, M., Strenn, B., and Kroiss, H. (2004). Relevance of the sludge retention time (SRT) as design
535
criteria for wastewater treatment plants for the removal of endocrine disruptors and pharmaceuticals from wastewater.
536
Water Science and Technology, 50(5), 149-156.
537
11. Falås, P., Andersen, H. R., Ledin, A., and la Cour Jansen, J. (2012). Impact of solid retention time and nitrification
538
capacity on the ability of activated sludge to remove pharmaceuticals. Environmental Technology, 33(8), 865-872.
539
12. Johnson, D. R., Lee, T. K., Park, J., Fenner, K., and Helbling, D. E. (2015). The functional and taxonomic richness of
540
wastewater treatment plant microbial communities are associated with each other and with ambient nitrogen and carbon
541
availability. Environmental Microbiology, 17(12), 4851-4860.
542
13. Pholchan, M. K., Baptista, J. D. C., Davenport, R. J., Sloan, W. T., and Curtis, T. P. (2013). Microbial community
543
assembly, theory and rare functions. Frontiers in Microbiology, 4.
23/28
14. Louca, S., Parfrey, L. W., and Doebeli, M. (2016). Decoupling function and taxonomy in the global ocean microbiome.
545
Science, 353(6305), 1272-1277.
546
15. Louca, S., Jacques, S. M., Pires, A. P., Leal, J. S., Srivastava, D. S., Parfrey, L. W., et al. (2017). High taxonomic
547
variability despite stable functional structure across microbial communities. Nature Ecology & Evolution, 1(1), 0015.
548
16. Frossard, A., Gerull, L., Mutz, M., and Gessner, M. O. (2012). Disconnect of microbial structure and function: enzyme
549
activities and bacterial communities in nascent stream corridors. The ISME Journal, 6(3), 680-691.
550
17. Purahong, W., Schloter, M., Pecyna, M. J., Kapturska, D., Däumlich, V., Mital, S., et al. (2014). Uncoupling of
551
microbial community structure and function in decomposing litter across beech forest ecosystems in Central Europe.
552
Scientific Reports, 4, 7014.
553
18. Kivlin, S. N., and Hawkes, C. V. (2016). Temporal and spatial variation of soil bacteria richness, composition, and
554
function in a neotropical rainforest. PloS One, 11(7), e0159131.
555
19. Burke, C., Steinberg, P., Rusch, D., Kjelleberg, S., and Thomas, T. (2011). Bacterial community assembly based on
556
functional genes rather than species. Proceedings of the National Academy of Sciences, 108(34), 14288-14293.
557
20. Boon, E., Meehan, C. J., Whidden, C., Wong, D. H. J., Langille, M. G., and Beiko, R. G. (2014). Interactions in the
558
microbiome: communities of organisms and communities of genes. FEMS Microbiology Reviews, 38(1), 90-118.
559
21. Daims, H., Taylor, M. W., and Wagner, M. (2006). Wastewater treatment: a model system for microbial ecology.
560
Trends in Biotechnology, 24(11), 483-489.
561
22. Downing, A. L., and Hopwood, A. P. (1964). Some observations on the kinetics of nitrifying activated-sludge plants.
562
Schweizerische Zeitschrift für Hydrologie, 26(2), 271-288.
563
23. Lawrence, A. W., and McCarty, P. L. (1970). Unified basis for biological treatment design and operation. Journal of the
564
Sanitary Engineering Division, 96(3), 757-778.
565
24. Henze, M., Gujer, W., Mino, T., and Van Loosdrecht, M. C. M. (2000). Activated sludge models ASM1, ASM2,
566
ASM2d and ASM3. IWA publishing.
567
25. Degnan, P. H., and Ochman, H. (2012). Illumina-based analysis of microbial community diversity. The ISME Journal,
568
6(1), 183-194.
569
26. Sinclair, L., Osman, O.A., Bertilsson, S., and Eiler, A. (2015) Microbial community composition and diversity via 16S
570
rRNA Gene Amplicons: Evaluating the Illumina Platform. PLoS One 10(2): e0116955.
571
27. Knight, R., Vrbanac, A., Taylor, B.C., Aksenov, A., Callewaert, C., Debelius, J., et al. (2018) Best practices for
572
analysing microbiomes. Nature Reviews Microbiology, 16, 410–422.
573
28. van Bodegom, P. (2007). Microbial maintenance: a critical review on its quantification. Microbial Ecology, 53(4),
513-574
523.
24/28
29. Achermann, S., Falas, P., Joss, A., Mansfeldt, C., Men, Y., Vogler, B., et al. (2018) Trends in micropollutant
576
biotransformation along a solids retention time gradient. Environmental Science & Technology, 52(20),11601–11611
577
30. Guo, F., Ju, F., Cai, L., and Zhang, T. (2013). Taxonomic precision of different hypervariable regions of 16S rRNA
578
gene and annotation methods for functional bacterial groups in biological wastewater treatment. PloS One, 8(10),
579
e76185.
580
31. Andrews, S. (2010). FastQC: a quality control tool for high throughput sequence data.
581
32. Schmieder, R., & Edwards, R. (2011). Quality control and preprocessing of metagenomic datasets. Bioinformatics,
582
27(6), 863-864.
583
33. Edgar, R. C. (2010). Search and clustering orders of magnitude faster than BLAST. Bioinformatics, 26(19), 2460-2461.
584
34. Martin, M. (2011). Cutadapt removes adapter sequences from high-throughput sequencing reads. EMBnet, 17(1):10.
585
35. McMurdie, P. J., and Holmes, S. (2013). phyloseq: an R package for reproducible interactive analysis and graphics of
586
microbiome census data. PloS One, 8(4), e61217.
587
36. Hill, M. O. (1973). Diversity and evenness: a unifying notation and its consequences. Ecology, 54(2), 427-432.
588
37. Chao, A., Chiu, C. H., and Jost, L. (2010). Phylogenetic diversity measures based on Hill numbers. Philosophical
589
Transactions of the Royal Society B – Biological Sciences, 365(1558), 3599-3609.
590
38. Chao, A., Gotelli, N. J., Hsieh, T. C., Sander, E. L., Ma, K. H., Colwell, R. K., et al. (2014). Rarefaction and
591
extrapolation with Hill numbers: a framework for sampling and estimation in species diversity studies. Ecological
592
Monographs, 84(1), 45-67.
593
39. Bolger, A. M., Lohse, M., and Usadel, B. (2014). Trimmomatic: a flexible trimmer for Illumina sequence data.
594
Bioinformatics, 30(15), 2114-2120.
595
40. Kopylova, E., Noé, L., and Touzet, H. (2012). SortMeRNA: fast and accurate filtering of ribosomal RNAs in
596
metatranscriptomic data. Bioinformatics, 28(24), 3211-3217.
597
41. Buchfink, B., Xie, C., and Huson, D. H. (2015). Fast and sensitive protein alignment using DIAMOND. Nature
598
Methods, 12(1), 59-60.
599
42. Monod, J. (1949). The growth of bacterial cultures. Annual Reviews in Microbiology, 3(1), 371-394.
600
43. Liu, G., and Wang, J. (2015). Modeling effects of DO and SRT on activated sludge decay and production. Water
601
Research, 80, 169-178.
602
44. Saikaly, P. E., and Oerther, D. B. (2004). Bacterial competition in activated sludge: theoretical analysis of varying
603
solids retention times on diversity. Microbial Ecology, 48(2), 274-284.
604
45. Hsu, S. B., Hubbell, S., and Waltman, P. (1977). A mathematical theory for single-nutrient competition in continuous
605
cultures of micro-organisms. SIAM Journal on Applied Mathematics, 32(2), 366-383.
25/28
46. Saikaly, P. E., and Oerther, D. B. (2011). Diversity of dominant bacterial taxa in activated sludge promotes functional
607
resistance following toxic shock loading. Microbial Ecology, 61(3), 557-567.
608
47. Habermacher, J., Benetti, A. D., Derlon, N., and Morgenroth, E. (2015). The effect of different aeration conditions in
609
activated sludge–side-stream system on sludge production, sludge degradation rates, active biomass and extracellular
610
polymeric substances. Water Research, 85, 46-56.
611
48. Martínez-García, C. G., Fall, C., and Olguín, M. T. (2016). Activated sludge mass reduction and biodegradability of the
612
endogenous residues by digestion under different aerobic to anaerobic conditions: comparison and modeling.
613
Bioresource Technology, 203, 32-41.
614
49. Friedrich, M., and Takács, I. (2013). A new interpretation of endogenous respiration profiles for the evaluation of the
615
endogenous decay rate of heterotrophic biomass in activated sludge. Water Research, 47(15), 5639-5646.
616
50. Friedrich, M., Jimenez, J., Pruden, A., Miller, J. H., Metch, J., and Takács, I. (2017). Rethinking growth and decay
617
kinetics in activated sludge–towards a new adaptive kinetics approach. Water Science and Technology, 75(3), 501-506.
618
51. Soetaert, K. E. R., Petzoldt, T., and Setzer, R. W. (2010). Solving differential equations in R: package deSolve. Journal
619
of Statistical Software, 33.
620
52. Duan, L., Moreno-Andrade, I., Huang, C. L., Xia, S., and Hermanowicz, S. W. (2009). Effects of short solids retention
621
time on microbial community in a membrane bioreactor. Bioresource Technology, 100(14), 3489-3496.
622
53. Saikaly, P. E., Stroot, P. G., and Oerther, D. B. (2005). Use of 16S rRNA gene terminal restriction fragment analysis to
623
assess the impact of solids retention time on the bacterial diversity of activated sludge. Applied and Environmental
624
Microbiology, 71(10), 5814-5822.
625
54. Gonzalez-Martinez, A., Rodriguez-Sanchez, A., Lotti, T., Garcia-Ruiz, M. J., Osorio, F., Gonzalez-Lopez, J., et al.
626
(2016). Comparison of bacterial communities of conventional and A-stage activated sludge systems. Scientific Reports,
627
6, 18786.
628
55. Zhang, T., Shao, M. F., and Ye, L. (2011). 454 Pyrosequencing reveals bacterial diversity of activated sludge from 14
629
sewage treatment plants. The ISME Journal, 6(6), 1137-1147.
630
56. Saunders, A. M., Albertsen, M., Vollertsen, J., and Nielsen, P. H. (2016). The activated sludge ecosystem contains a
631
core community of abundant organisms. The ISME Journal, 10(1), 11-20.
632
57. Pollice, A., Tandoi, V., and Lestingi, C. (2002). Influence of aeration and sludge retention time on ammonium oxidation
633
to nitrite and nitrate. Water Research, 36(10), 2541-2546.
634
58. Jiang, L. (2007). Negative selection effects suppress relationships between bacterial diversity and ecosystem
635
functioning. Ecology, 88(5), 1075-1085.
636
59. Prosser, J. I., Head, I. M., and Stein, L. Y. (2014). The family Nitrosomonadaceae. In The Prokaryotes (pp. 901-918).
637
Springer Berlin Heidelberg.
26/28
60. Vuono, D. C., Regnery, J., Li, D., Jones, Z. L., Holloway, R. W., and Drewes, J. E. (2016). rRNA gene expression of
639
abundant and rare activated-sludge microorganisms and growth rate induced micropollutant removal. Environmental
640
Science & Technology, 50(12), 6299-6309.
641
61. Grime, J. P., & Pierce, S. (2012). The evolutionary strategies that shape ecosystems. John Wiley & Sons.
642
62. Ho, A., Di Lonardo, D. P., & Bodelier, P. L. (2017). Revisiting life strategy concepts in environmental microbial
643
ecology. FEMS Microbiology Ecology, 93(3).
644
63. Andrews, J. H., & Harris, R. F. (1986). r-and K-selection and microbial ecology. In Advances in Microbial Ecology (pp.
645
99-147). Springer, Boston, MA.
646
64. Větrovský, T., and Baldrian, P. (2013). The variability of the 16S rRNA gene in bacterial genomes and its consequences
647
for bacterial community analyses. PloS One, 8(2), e57923.
648
65. Chandran, K., and Smets, B. F. (2001). Estimating biomass yield coefficients for autotrophic ammonia and nitrite
649
oxidation from batch respirograms. Water Research, 35(13), 3153-3156.
650
66. Friedrich, M., Takács, I., and Tränckner, J. (2015). Physiological adaptation of growth kinetics in activated sludge.
651
Water Research, 85(15), 22-30.
652
67. Vuono, D. C., Munakata‐Marr, J., Spear, J. R., and Drewes, J. E. (2016). Disturbance opens recruitment sites for
653
bacterial colonization in activated sludge. Environmental Microbiology, 18(1), 87-99.
654
68. Blazewicz, S. J., Barnard, R. L., Daly, R. A., and Firestone, M. K. (2013). Evaluating rRNA as an indicator of microbial
655
activity in environmental communities: limitations and uses. The ISME Journal, 7(11), 2061-2068.
656
69. Yu, K., and Zhang, T. (2012). Metagenomic and metatranscriptomic analysis of microbial community structure and
657
gene expression of activated sludge. PloS One, 7(5), e38183.
658
70. Prosser, J. I. (2015). Dispersing misconceptions and identifying opportunities for the use of omics' in soil microbial
659
ecology. Nature Reviews Microbiology, 13(7), 439-446.
660
71. Bar-Even, A., Noor, E., Savir, Y., Liebermeister, W., Davidi, D., Tawfik, D. S., et al. (2011). The moderately efficient
661
enzyme: evolutionary and physicochemical trends shaping enzyme parameters. Biochemistry, 50(21), 4402-4410.
662
72. de Sousa Abreu, R., Penalva, L. O., Marcotte, E. M., and Vogel, C. (2009). Global signatures of protein and mRNA
663
expression levels. Molecular BioSystems, 5(12), 1512-1526.
664
73. Vogel, C., and Marcotte, E. M. (2012). Insights into the regulation of protein abundance from proteomic and
665
transcriptomic analyses. Nature Reviews Genetics, 13(4), 227-232.
666
74. Daims, H., Lücker, S., and Wagner, M. (2016). A new perspective on microbes formerly known as nitrite-oxidizing
667
bacteria. Trends in Microbiology, 24(9), 699-712.
668
75. Salvado, H. (1994). Effect of mean cellular retention time on ciliated protozoan populations in urban wastewater
669
treatment plants based on a proposed model. Water Research, 28(6), 1315-1321.
27/28 List of Figure Legends:
671
672
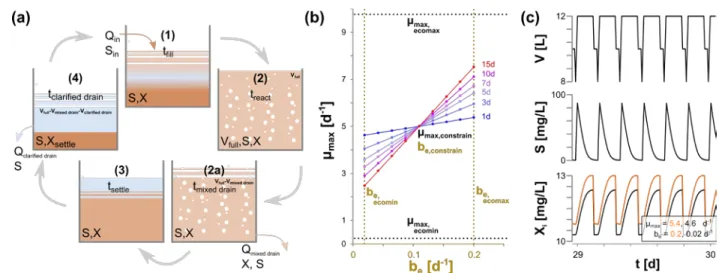
Figure 1. (a) Schematic diagram of the SBR used when running the model. All parameters are detailed in
673
Table 1. (b) Iteratively solved 9 point persistence curves for the maximum growth rate (µmax) and 674
endogenous decay (be) selection range at 1, 3, 5, 7, 10, and 15 d MRT. Constraints are placed on the range 675
of maximal growth rates (μmax eco; 0.2 to 9.8 d -1
) and endogenous decay constants (be eco; 0.02 to 0.2 d -1
),
676
defining the ecological space available. The model uses controlling growth parameters (µmax constrain, be 677
constrain) of 5 and 0.11 d -1
, respectively. (c) Example of the steady-state output for the volume, substrate
678
concentration, and two biomasses for the 1 d MRT.