Dynamic Compaction Method
in Physical Model Tests
F. Jafarzadeh 1
In this paper, physical modeling tests are conducted to study some aspects of the dynamic compaction method. The loose models are prepared with dry sand. Four cylindrical tampers with dierent weight and cross section areas are used for compaction of the models and dropped from various heights. Strain gage type total stress measuring sensors are placed at dierent levels inside the model to measure the transferred vertical stresses due to collision of the tamper with the surface of the models. The typical stress time histories are presented. Improvement depth and crater depth and diameter created on the model surface are studied, among the various parameters aecting the phenomena. Using the results of the tests, a relation is proposed for the improvement depth which has good agreement with the measured site results.
INTRODUCTION
Although dynamic compaction has been used for many years, its application as a useful ground improvement method was developed after Menard and Broise [1], around the seventh decade of the last century. At that time, this method was considered mainly for granular grounds. However, today, it is applied also for accelerating the consolidation of saturated ne soils; which, in later cases, will be called the dynamic con-solidation method. The method involves the repeated application of high energy impacts on the soil surface using steel or concrete tampers dropped from specic heights. Various parameters could aect the eciency and applicability of the dynamic compaction, including important ones such as soil type and ground layering, ground water level, compaction equipment and pattern. Real cases and projects could be employed as valuable data for evaluating the method. However, limitation of such data on the one hand and the presence of a large amount of parameters aecting the results of the method on the other hand, cause the need of more fundamental research in this regard.
In addition to the limited and expensive real site tests, another method used by some researchers is the physical model test for studying dynamic compaction. Wetzel and Vey [2] conducted a number of physical model tests and measured the stress and strain in
1. Department of Civil Engineering, Sharif University of Technology, I.R. Iran.
Ottawa sand models generated due to the impact eect of a tamper on the model surfaces. The test results show that the distribution of vertical stresses in depth, due to the impact, is similar to the Boussinesq solution. Poran and his colleagues [3,4] also conducted a number of physical model tests and studied the eects of dif-ferent parameters on the dynamic compaction results. They used Boston dry sand for preparation of the 1:221:221:22 m3models and presented some design
curves based on the experimental results. Oshima and Takada [5,6], by using a variety of facts obtained from site tests and centrifuge model tests, studied the eect of the momentum of a tamper and presented some graphs for estimation of the improvement depth during dynamic compaction.
In this paper, the results of some physical model tests for the study of dynamic compaction on dry sand are presented. Stress and acceleration time histories were measured accurately by using the recorded data from deployed miniature sensors at dierent depths of the models. After explanation of the model prepara-tion details and test procedures, the test results are presented. Improvement depth, induced crater depth and its diameter are considered and some design graphs are presented in the nal part of the paper.
MODEL SPECIFICATIONS
The physical models are comprised of a wooden con-tainer of 453540 cm3 and 0.5 cm thickness soft
188 F. Jafarzadeh compaction of the models, four cylindrical steel weights
are used. These weights were 0.2, 0.5, 1.0 and 2.3 Kgf and their diameters were 2.99, 4.12, 5.06 and 5.70 cm, respectively. PVC guide pipes were used for controlling the weight drops. In order to provide dierent falling energies, the heights of these guide pipes were dierent, but their diameters were the same and equal to 6 cm. The soil used for all the models is natural sand, called Babolsar Sand, which was provided from the Caspian Sea Shore close to Babolsar city, Iran. Its grain size distribution is shown in Figure 1. According to this gure, it is uniform sand with aD50of about 0.24 mm
and categorized, based on the Unied System, as SP. According to density tests, the dmax and dmin
values for this sand are 17.67 and 15.12 KN/m3,
respectively. In Figure 2, a typical section of the model
Figure1. Grain size distribution of Babolsar Sand used for the physical models.
Figure2. Typical section of the physical models and location of deployed sensors.
container and deployed sensors inside the model are shown.
INSTRUMENTATION
Two types of sensor were installed in the test models: Soil Pressure Meters (SPM) and Accelerometers (ACC) (Figure 2). The SPMs were used for measuring total soil pressure at dierent locations of the models and for estimating the total stresses, due to the impact of the weights on the surface of the models. They were of a strain gage type with a 2 Kgf/cm2 capacity,
23 mm diameter and 10 mm thickness, produced by the Kyowa Company. They were placed inside the models horizontally to measure the vertical stresses. The ACCs are also of a strain gage type, cube shaped with 20 mm dimensions and a 5g capacity, supplied by the TML Company. An 8 channel data acquisition system connected to a PC computer was used for collecting and recording the data from various sensors. Due to the nature of the impact tests and in order to have reliable data from the event, it was necessary to use very sensitive sensors with a high data sampler data acquisition system in this research. Therefore, the capacity of the acquisition system was 700 samples per second per channel and was satisfactory. In this paper, the recorded results by SPMs are presented and used to nd some correlation between the aecting parameters on the dynamic compaction method.
TESTPROCEDURES
About 50 dynamic compaction tests were performed in this research on physical models and more than 500 acceleration and stress time histories were recorded at dierent points inside the models [7]. At rst, the container was lled with dry sand using an air raining method and its relative density was measured.
All the models produced by the explained method had about 35% to 40% relative densities and were kinds of loose models. The sensors were also placed at specied locations and orientations inside the models. After this stage, the vertical PVC guide pipes were placed on the surface of the models, the weights were dropped from the specied height and the response of the sensors inside the soil was recorded.
Also, the depth and diameter of the induced crater, due to the impact of the weight, were measured carefully. This procedure was repeated after each drop of the weight and, in all cases, the responses were recorded.
TYPICALTEST RESULTS
In Figure 3, some typical test results are shown. These results correspond to dynamic compaction tests with a
Figure3. Typical recorded vertical stress time histories for 1 Kgf tamper dropped from 1m height.
tamper of 1 Kgf weight and 5.06 cm diameter dropped from a 1 m height for 1, 3, 5 and 10 times. The stress time histories have been plotted for the sensors placed at 13, 21, 29, 32 and 37 cm depths inside the model. The drop number is shown byN in this gure.
According to this gure, by increasing the drop numbers, the stress amplitude at each depth increases and the peak value occurs sooner. Also, for each specied drop number, the dynamic impact stress decreases by depth.
In Figure 4, typical acceleration time histories are shown at a point located on the surface of the model, 8 cm away from the hitting point of the tamper, due to dierent tamping numbers. It is clear that by increasing drop numbers, the compaction of the model is increased and the amplitude of the recorded acceleration, which could be related to the compaction energy at a specic point, is also increased.
INFLUENCEAND IMPROVEMENT
DEPTH
Inuence depth could refer to the depth in the ground or physical model that is aected by the drop energy of the tamper on the ground or model surface. In
Figure 4. Typical recorded acceleration time histories at model surface (8 cm away from hitting point).
other words, if the stress eld at any point were to change due to the impact of tamper at the surface, it could be assumed that the point has received some portion of the compaction energy and its compaction has been aected. It is clear that in order to increase the compaction of any soil element or have a successful dynamic compaction in that element, the impact stress
190 F. Jafarzadeh should have some level. This level is not clear and
is under controversy. In this paper, it is assumed to be equal to 0.1 Kgf/cm2. Therefore, at each test, it
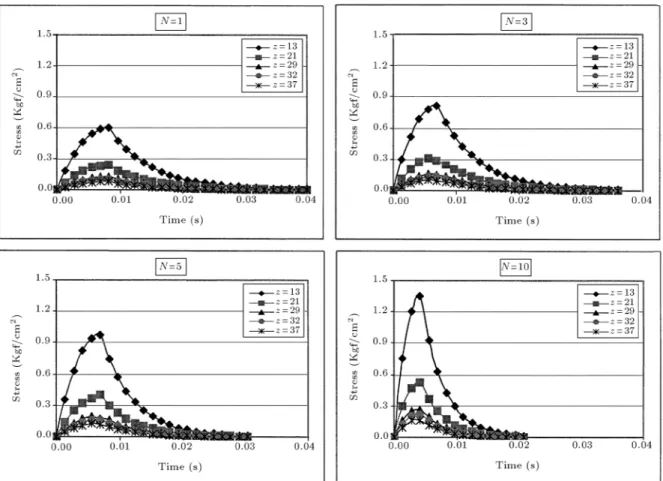
is assumed that the Improvement Depth (DI) could be estimated by evaluating the dissipated compaction energy by depth and this energy could be correlated to the impact stress amplitude at each point. Considering that during all tests in this research, the impact stress time histories at various depths have been recorded, the amplitude value could be estimated easily. In Figure 5, typical graphs for the recorded maximum vertical stresses at dierent depths, due to dierent drop numbers, are shown. It is clear from this gure that for a specic drop number, the vertical stress decreases by depth sharply. Also, the improvement depth, with the introduced criteria, increases by drop number.
In this research, in order to reduce scale eects, the method proposed by Poran et al. [3] is applied. In the mentioned method, Improvement Depth (DI) is scaled to tamper diameter (D) and a normalized energy index, N:W:H=A:DI, is considered. In this phrase,N
is the number of drops,W is the weight of the tamper in Kgf,H is the falling height in m and Ais the cross area of the tamper in m2. The above explained method
is applied to all tests of this research and the result for the non-dimensionalDI=Dratio is shown in Figure 6. According to this gure, there is a linear cor-relation between DI/D and N:W:H=A:DI in a semi logarithmic system. In other words, in a test whenN,
W, H, A and D are known, the improvement depth,
DI, could easily be estimated.
CRATER DIMENSIONS
By dropping a tamper on the ground or model surface, a small hole is created. The diameter and depth of this
Figure5. Recorded maximum stresses at dierent points inside the models for dierentN values (tamper weight and drop height are constant for all graphs).
Figure6. Correlation of improvement depth with normalized compaction energy.
hole could be used for designing a compaction pattern in practice. Usually, the created hole has a semi prolate spheroid geometry. In all tests of this research, the crater dimensions (depth and diameter) are measured precisely after each drop. The results show that the crater depth is increased by the energy level of the compaction. Also, it is found that after about 10 drops of a specic weight from a constant height, the depth of the crater does not change. Takada and Oshima [5,6] proposed the following relation for crater depth,h:
h=c:m:v0(N)0:5=A; (1)
in which m is tamper mass, v0 is tamper velocity
at contact time with the ground surface and c is a constant coecient assumed equal to 0.0083 m2s/ton.
In order to verify the applicability of Equation 1 for this research, the crater depth is normalized to the square root of the applied energy and the results are plotted against the number of drops, N, in Figure 7. Other parameters of Equation 1 are selected based on the physical parameters of this study and test arrangement. It can be seen from this gure that the presented equation by Takada and Oshima predicts low values for a normalized crater depth, compared with the measured data in low compaction energy levels (0.2 and 0.5 Kgf tampers), the situation being opposite for high energy levels (1 and 2.3 Kgf tampers). However, there is good correlation between the measured and estimated values by Equation 1 for low drop numbers. As explained, after dropping each tamper on the ground surface, a crater is created which has a circular shape in plane.
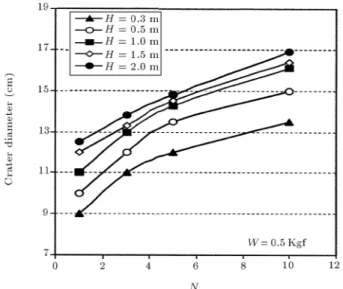
The diameter of this crater is another parameter that controls the compaction pattern. In this research, after each drop, the diameter is measured accurately. Figure 8 shows a typical measured data for a 0.5 Kgf tamper dropped from various heights. It could be
Figure7. Correlation of normalized crater depth with drop numbers measured from model tests of this study and the Takada and Oshima equation, for dierent compaction energy levels.
Figure8. Typical measured crater diameter for 0.5 Kgf tamper, dropped from various heights.
seen that at constant compaction energies, the crater diameter increases by drop number. Also, according to this gure, after about 3 drops, the increasing rate of the crater diameter is reduced. Another point which is clear from this gure is that for a specied number of drops, the crater diameter increases according to the drop height of the tamper or energy level.
CONCLUSION
Dynamic compaction is considered as one of the eco-nomic and applicable ground improvement methods. A series of physical model tests were conducted to study the parameters aecting this method. Loose dry sand models instrumented by total stress meters and accelerometers at various points were subjected to the compaction energy of tampers. The compaction energy level was varied by the tamper weight, drop height and drop number. Considering the very short duration
192 F. Jafarzadeh of the collision, a high accuracy data acquisition and
recording system, with a sampling capacity of 700 samples per second, are used.
Based on the performed test results, a design curve was presented for estimation of the improvement depth due to dynamic compaction. In this correlation, the eect of important parameters like tamper weight, diameter, cross section, falling height and drop number, are considered. Finally, some comments are presented for evaluating the created crater diameter and depth on the model surfaces and for the applicability of the available equation for crater depth in the literature.
REFERENCES
1. Menard, L. and Broise, Y. \Theoretical and practical aspects of dynamic consolidation", Geotechnique, 25, pp 3-18 (1975).
2. Wetzel, R.A. and Vey, E. \Axisymmetric stress wave
propagation in sand", Journal of Soil Mechanics &
Foundation Division,SM5, pp 1763-1786 (Sep. 1970). 3. Poran, C.J. and Rodriguez, J.A. \Design of dynamic
compaction",Canadian Geotechnical Journal,29(5), pp 796-802 (1992).
4. Poran, C.J., Heh, K.S. and Rodriguez, J.A. \Impact behavior of sand",Soils and Foundations,32(4), pp 81-92 (1981-92).
5. Oshima, A. and Takada, N. \Eect of ram momentum on compaction by heavy tamping",International Con-ference on Soil Mechanics & Foundation Engineering, 13(3), pp 1141-1144 (1994).
6. Oshima, A. and Takada, N. \Relation between com-pacted area and ram momentum by heavy tamping",
International Conference on Soil Mechanics& Founda-tion Engineering,13(4), pp 1641-1194 (1994).
7. Barat, A. \Study of dynamic compaction method by physical model tests", M.Sc. Thesis, Sharif University of Technology (in Farsi), Tehran, Iran (2001).