Shell form in Venerupis rhomboides
19
0
0
Full text
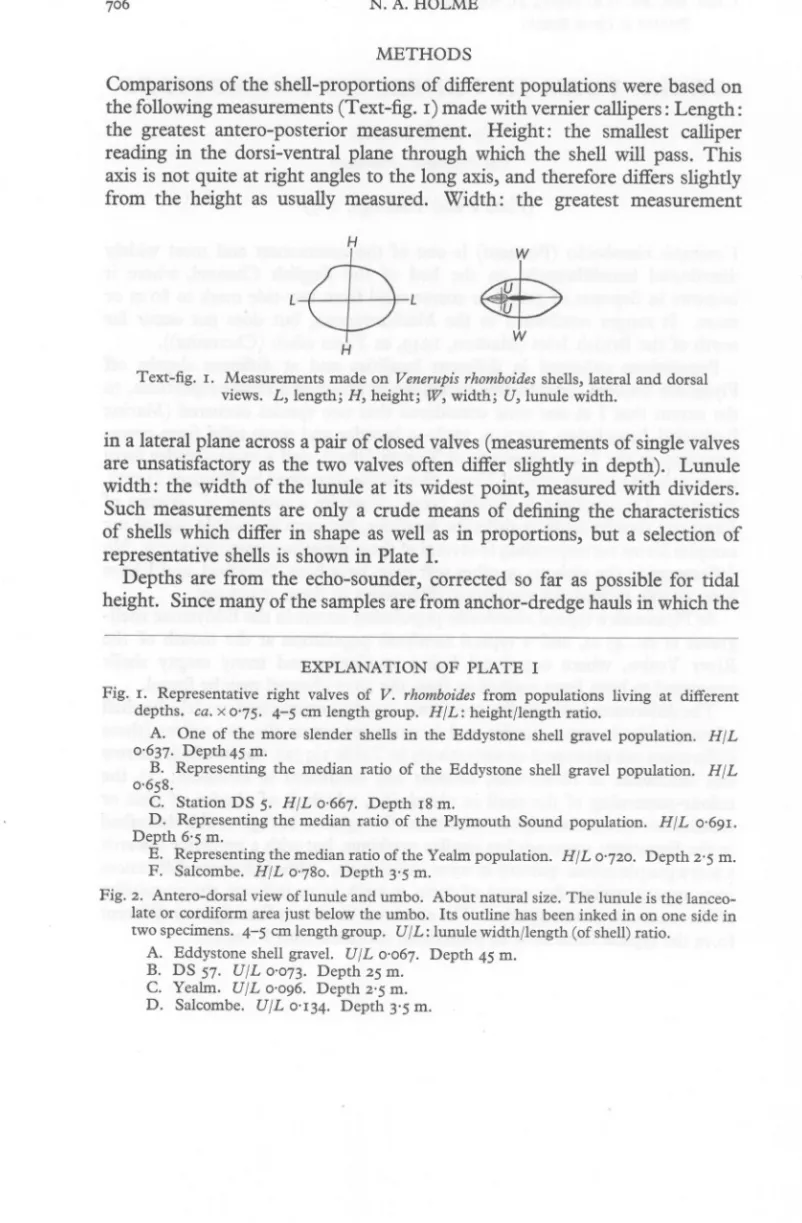
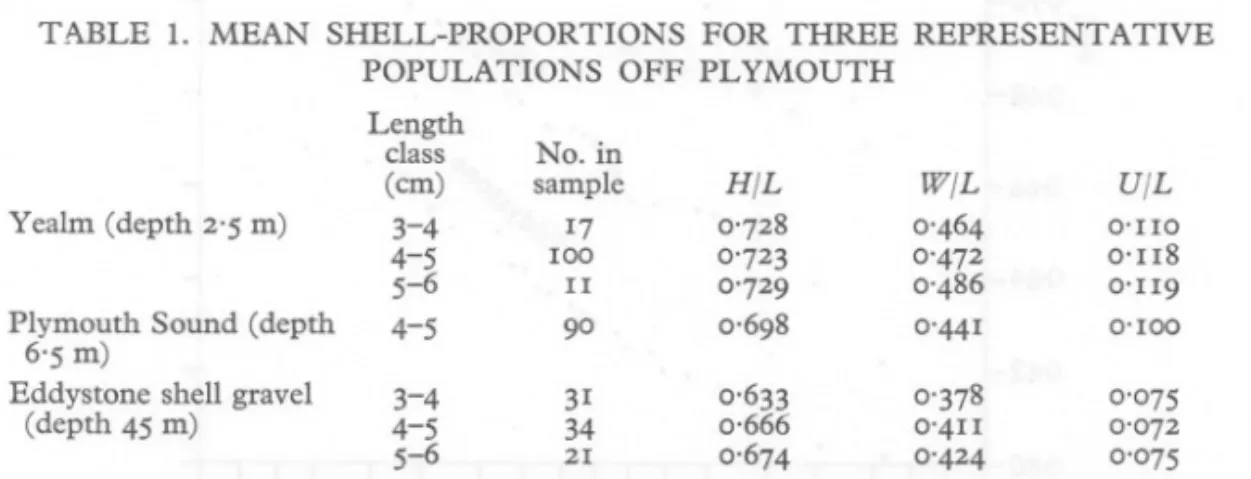
(2) 706. N.A.HOLME. METHODS Comparisons of the shell-proportions of different populations were based on the following measurements (Text-fig. I) made with vernier callipers: Length: the greatest antero-posterior measurement. Height: the smallest calliper reading in the dorsi-ventral plane through which the shell will pass. This axis is not quite at right angles to the long axis, and therefore differs slightly from the height as usually measured. Width: the greatest measurement. ~. w. Text-fig. I. Measurements made on Venerupis rhomboides shells, lateral and dorsal views. L, length; H, height; W, width; V, lunule width.. in a lateral plane across a pair of closed valves (measurements of single valves are unsatisfactory as the two valves often differ slightly in depth). Lunule width: the width of the lunule at its widest point, measured with dividers. Such measurements are only a crude means of defining the characteristics of shells which differ in shape as well as in proportions, but a selection of representative shells is shown in Plate I. Depths are from the echo-sounder, corrected so far as possible for tidal height. Since many of the samples are from anchor-dredge hauls in which the EXPLANATION. OF PLATE. I. Fig. I. Representative right valves of V. rhomboides from populations living at different depths. ca. x 0'75. 4-5 cm length group. H/L: height/length ratio. A. One of the more slender shells in the Eddystone shell gravel population. H/L 0·637· Depth 45 m. B. Representing the median ratio of the Eddystone shell gravel population. H/L 0·658. C. Station DS 5. H/L 0'667. Depth 18 m. D. Representing the median ratio of the Plymouth Sound population. H/L 0·69I. Depth 6'5 m. E. Representing the median ratio of the Yealm population. H/L 0'720. Depth 2'5 m. F. Sa1combe. H/L 0'780. Depth 3'5 m. Fig. 2. Antero-dorsal view of lunule and umbo. About natural size. The lunule is the lanceolate or cordiform area just below the umbo. Its outline has been inked in on one side in two specimens. 4-5 cm length group. V/ L: lunule width/length (of shell) ratio. A. Eddystone shell gravel. V/L 0'067. Depth 45 m. B. DS 57. V/L 0'073. Depth 25 m. C. Yealm. V/L 0'096. Depth 2'5 m. D. Sa1combe. V/L 0'134. Depth 3'5 m..
(3) J.. MAR. BIOL.. Ass. U.K.,. 41. (3). HOLME.. PLATE I. Fig. 1. Fig. 2. (Pacing p. 706).
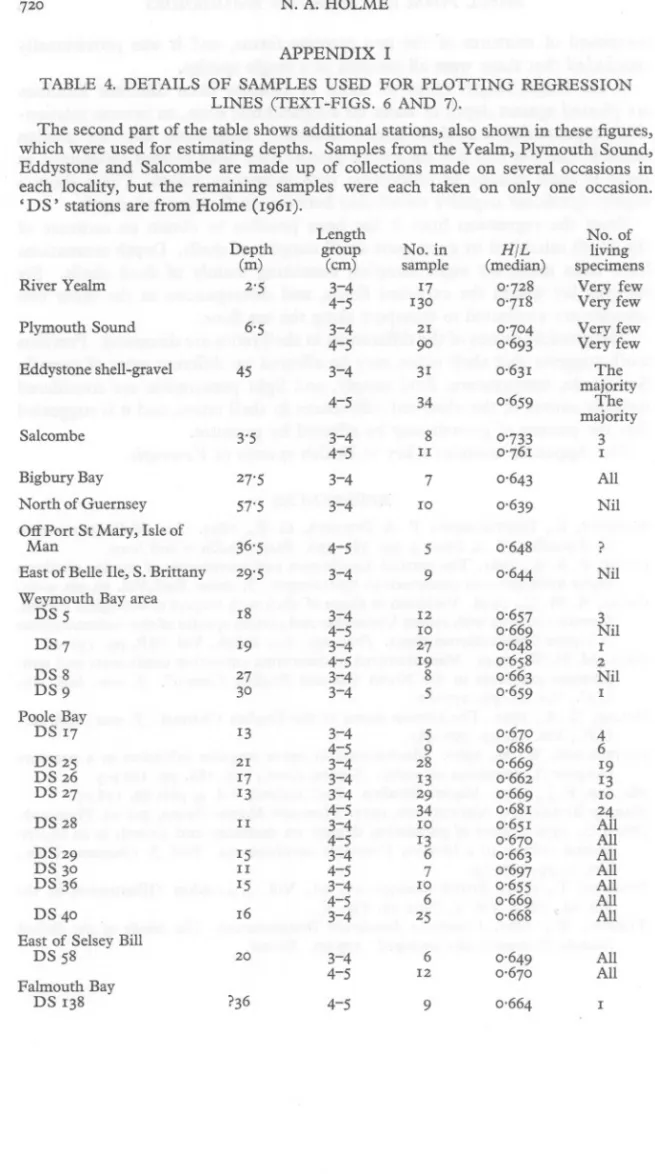
(4) SHELL. FORM. IN VENERUPIS. RHOMBOIDES. ship is not directly above the sampling gear, a small error may be present in some of the soundings. The few samples from the shore at the Yealm and at Salcombe were mainly of dead shells, but included occasional living specimens burrowing in the deposit near low-water mark. Clearly the main population lay offshore, and an estimated depth was made equal to one-half of the maximum in the adjoining river channel. It will be appreciated that a potential source of error exists in many of the depths quoted, but these are not great enough to mask the correlation of shell form with depth described later in this paper. RESULTS COMPARISON. OF REPRESENTATIVE. POPULATIONS. Shell-proportions of the Yealm and Eddystone populations together with those from a position in Plymouth Sound are shown in Table 1. As there is some change in proportions with growth, the means for different cm groups have been calculated separately. Changes in height and width ratios appear to (em). 0'100 0,666 100 0'Il8 0'729 O'IlO 0'472 0'072 No. 0'698 90 34 in 0'728 0'633 31 17 IIH/L 0'486 0'674 21 0'075 TABLE sample 1.0'723 MEAN W/L 0'464 0'Il9 0'378 0'4Il 0'441 U/L 0'424 class Eddystone shell gravel Length. SHELL-PROPORTIONS FOR THREE 3-4 4-5 4-5 POPULATIONS OFF PLYMOUTH. REPRESENTATIVE. H, height; W, width; L, length; U, lunule width. For convenience, the length classes have been quoted to the nearest whole number; e.g. the 3-4 em length group includes shells between 3'00 and 3'99 em length.. be more marked in the Eddystone than in the Yealm populations. It will be noted that in each instance the Plymouth Sound ratios are intermediate between those of the Eddystone and Yealm populations, and after a number of other populations had been measured it was found that height, width and lunule measurements all followed similar trends, so that a single ratio, height! length, was considered sufficient to characterize a population. Subsequent measurements have been restricted to this ratio, and the median rather than the mean value has been employed as being less affected by occasional specimens with particularly high ratios, as occur in some shallow-water samples..
(5) N.A.HOLME COMPOSITION OF THE POPULATIONS. If a cumulative plot of height/length ratios is made on arithmetic probability paper, some information on the composition of the populations may be obtained. A population of a single species would be expected to give a straightline plot, and a population containing two species or forms with different median ratios would give a plot with an inflexion corresponding to the transition between the two forms. Text-figs. 2 and 3 show the Eddystone, Yealm. 0-78 0·76 0·74. on -.J -J:. 0·70 o o 0. 0·68. 0°. o. o. 0·66. ... ...-. 0·64. ,.'. .'. 0·62. ~60. o~. .'. . 1. ~. 2. 5. 20 10. 40 30. 60 50. Percentage. 80 70. 95 90. 99 98. 99·8 99·5. of population. Text-fig. 2. Cumulative plots of height/length ratio on arithmetic probability paper, 3-4 cm length class.. and Plymouth Sound populations, together with another intermediate population from Poole Bay (DS 27), plotted on probability paper. None of the plots gives a very good straight line, but the small inflexions may be due to lengthgrouping of individuals. Individuals (whether living or dead) tended to be aggregated into length-groups, corresponding perhaps to different yearclasses. Since proportions change slightly with growth this grouping would tend to produce small inflexions in the plots. The two intermediate populations do not appear to be bimodal, but any such tendency might be masked to some.
(6) SHELL FORM IN VENERUPIS. RHOMBOIDES. 709. extent by this length-grouping of the populations. However, not only the medians but also the extreme values for each population tend to form a series which makes it seem unlikely that the intermediate populations are mixtures of the two extreme forms. The most likely explanation appears to be that the differing shell-proportions are an expression of variation within a single species. o. 0,80 0'78 0·76 0·74. 0,70 0,68 o 0. 00 0 00 0·66--1. 0. ..' ~ .. "0e. 00 00. 00"'1'><',0. rf'cPboO. o 0 •. 0'64-1 o. 0·62 , 0·2. 0,5. 1. 2. 5. 20 40 60 80 95 99 99,8 10 30 50 70 90 98 99,5 Percentage of population. Text-fig. 3. Cumulative plots of height/length ratio on arithmetic probability paper, 4-5 cm length class. OCCURRENCE. OF THE DIFFERENT. FORMS. There appeared to be some relation between shell proportion and depth of water, and accordingly samples from different areas, mainly in the English Channel, were measured and the height/length ratio plotted against depth. The plots are conveniently made on a log-depth scale, when something approaching a straight-line relationship is obtained. Samples usually contained some living individuals, but the bulk of each sample was of dead shells. Scatter diagrams for the two length-groups are shown in Text-figs. 4 and 5. There appears to be a continuous series between the broad shallow-water form and the more slender deeper-water form, suggesting again that only one species is.
(7) N. A. HOLME. 110. 5. y. .i ':' . ..... . .. . ·...•• ·, ..'::1-·...,I.-.•.':;::-. . i,- .•.•. :. -. ••. 0527. · ,·. • ...... : ';a,.. . . : ••-.1 • • + .il.!..!:.:." -4_._. e •••. • • ..r-• _ e. 1. E. •. •. r. :. .1 ••:.••••••. .. . 5. 10 Depth (m). Text-fig. 4. Scatter diagrams of height/length ratios of different samples plotted against depth on a log scale, 3-4 em length class. The points represent individual specimens, but for the four larger samples, from the Yealm, Plymouth Sound, DS 27, and Eddystone, the limits, medians and upper and lower quartiles are shown.. present. The slope of the plot is steeper for the 3-4 cm than for the 4-5 cm group. In the former there is no overlap between the ratios of individuals from the Yealm and the Eddystone, but, owing to changing proportions with growth, differences are less marked in the 4-5 cm group. USE OF SHELLS AS INDICATORS OF DEPTH. Whatever the biological reasons for the change in shell proportions, the correlation with depth is apparent. It follows that it should be possible to use shells as indicators of depth, and by this means obtain information on movements of shells along the sea floor, the original habitat of shells washed up on a beach, or of specimens contained in shell deposits formed perhaps when the sea was at a different level..
(8) SHELL FORM IN VENERUPIS. y. 0-80. · 0-70~. ·0-826. 4· ..:·•·.Ii .~..-I...¥•II.:...••. . .I .\ ·.. .·..... ..--·.·... . t :I: TD527 ..• • rl •. RHOMBOIDES. 5. . .L. \ TE. I. t. 07t. 2. 5. Text-fig. 5. Height/length ratios plotted against depth, 4-5 em length class. For explanation see legend to Text-fig. 4.. In Text-figs. 6 and 7 are plotted the median height/length ratios for samples of five or more individuals in each length group (see Appendix I, Table 4). In spite of the small size of some samples, the points approximate to a straight line, showing a negative correlation between the shell ratio and (log) depth. The regression equations for median values are: 3-4 em group. y _ o. log X. 4-5 em group. _ log X x 0.00056 0'007525 '. -. 755. =. (II42'54-. y _ -. o. 737. 1476'3 Y) (0.007525).. _ log X x 0·000395 0'007525 '. log X = (1607'23 -2147'8 Y)(0,007525), where X is depth in metres, and Y the H/L ratio. 45. JOURN. MAR. BIOL. ASSOC. VOL. 41,1961.
(9) N.A,HOLME. 712. (The equations are represented in this form to allow direct plotting on arithmetic graph paper. On the X axis 40 squares = 2 m, 80 = 4 m, 120 = 8 m, etc., the relationship between the graph scale Xl and the depth being given by Xl = log Xjo'o07525.). 0,75. ~0'70. 0,65. 0'602. 5. 10. 20. 30. Depth (m). Text-fig. 6. Regression of depth on median height/length values, 3-4 em length class.• , samples used in plotting regression; 0, samples used in depth estimation. Some station numbers are included. The two broken lines are plots corresponding to twice the Standard Error. For explanation see text.. In the 4-5 cm group the Sa1combe sample has been excluded as it clearly deviates from the relationship shown by the other points. This could be due to an error of only a metre or two in the estimated depth, but the Sa1combe population appears to be broader than any found elsewhere. It was later suggested that the regression equations should be 'weighted' according to the numbers in each sample. The equations were therefore re-ca1culated, each sample being weighted according to the square root of numbers in the sample. For the 3-4 em group the equations then become Y = o.. 6 _ log X x 0'000567. 75. 0'007525'. log X = (II49'14-1485'9Y)(0·007525)..
(10) SHELL FORM IN VENERUPIS. RHOMBOIDES. 713. The regression lines plotted from these equations do not differ sufficiently from those from the 'unweighted' results to justify any corrections, and further calculations were all based on unweighted values.. '-. . . '-'-. '- '.•.•..•.. ·Salcombe. .•.•..•. .•.•..•. .•.•..•. .....::::.~. ..•.•..••. i-0'70~ 0'7S~. '-. .•.•..•.. @113. l!l20S ......... 0'612. 5. 10 Depth (m). Text-fig. 7. Regression of depth on median height/length values, 4-5 em length class. For explanation see legend to Text-fig. 6.. The correlation coefficients (r) are -0'909 (3-4 cm) and -0'921 (4-5 cm), with t values of 12'74 and 7.83 respectively, showing a highly significant (P = < 0'01) negative correlation between H/L and depth. Standard errors, on the basis of the arithmetic scale noted above, are: 12'96 , Sy = 0'00798 • 16'58 , Sy = 0'007II • To estimate depth from a given sample, the regression line of X on Y is plotted, and parallel lines are plotted at a distance of twice the standard error (SXI) on either side of it. The probability of the median value lying within these limits is about 0'05. Equations for plotting lines corresponding to twice the standard error are approximately:. 3-4 em 4-5 em. 3-4 em 4-5 em. Sxl = Sxl =. log X = (II42'54-. 1476'3 Y ±26)(0·007525).. log X = (1607·23-2147·8Y ±33) (0'007525). 45-2.
(11) N,A,HOLME. The estimated depth and probable depth range of a sample may then be calculated, or read off the graphs. Representative values are shown in Table 2, but estimated depth ranges exceeding 65 m should be treated with reserve. TABLE 2, ESTIMATED DEPTH AND PROBABLE DEPTH RANGE FOR HIL MEDIAN VALUES IN THE 3-4 AND 4-5 eM GROUPS Depths, in metres, to nearest! m. ,. 0,620 0,610. HIL. 3-4 em ( 1'08'0 2range '0 6'0 0,680 0,660 1'52'56'5 4'0 0'700 II'O 9'022'S 66'0 (median) Estimated Probable 3'5 0'730 3'52'5 5'0 7'5 Estimated 5'00'690 IS'S 17'5 25'519'515'07'00'670 48'0 62'0 37'S Probable 22'00,650 68'S 32'580'S HIL 0'710 5'58'5 9'0 13'5 18'5 12'026,S 29'0 24'0 32'0-100'0 0'640 51'S depth depth range 4'010'5 39'S 31'0 10'518'5 12'5 32'S 47'S 56'S 39'0 14'5 42'0-104'0. ----~,. 4-5 em. Eight samples, almost entirely of dead shells, which were neither included in the data for plotting regressions nor in the scatter diagrams in Text-figs. 4 and 5 are listed in Table 3. These have been used as a check on the accuracy of depth estimations. Stations II6, 133, 135, 137 and 206 show a reasonably good agreement with the recorded depths. At station 112 there is some underestimation of depth, but the samples at I 13 show a wide discrepancy from the recorded depth. The lowest HJL ratio in the 3-4 cm class was 0,616 and the lower ratio in the 4-5 cm class was 0'619. Referring to Text-figs. 4 and 5 it is clear that such low ratios would not be expected at depths less than about 17 and 26 m respectively. It therefore seems unlikely that these shells were living in situ. Station II3 was in Whits and Bay, and the chart shows depths ranging from I I to 38 m within about half a mile of this position. Assuming that the sampling depth was correctly recorded, it seems likely that the dead shells had been washed in from deeper water in the vicinity. Station 205 also shows large discrepancies from the recorded depth. This sample, off the Normandy coast, was about 5 miles south of 206, in which a larger sample gave good agreement with depth. Re-examination of the sample showed that the dead shells could be divided into two categories: those fresh and in good condition, and old shells bored by Cliona, etc. There were also some shells in the 5-6 cm group, and when thus separated the individual ratios were: Fresh shells-3-4 cm HJL: 0'603, 0'618, 0'624. 4-5 cm HJL: 0'629, 0,660. These indicate depths of ca. 54 and 45 m respectively. Old shells-4-5 cm HJL: 0,678,0'679,0.682,0'682,0.697. 5-6 cm HJL: 0'656, 0·657, 0'676, 0'682, 0'697. The 4-5 cm group indicates a depth of.
(12) SHELL. FORM. IN VENERUPIS. RHOMBOIDES. about II'S m (probable range 7-20'S m) and the S-6 cm group has ratios of the same order. It is reasonable to suppose that the sample contains two distinct populations, distinguished both by the condition of the shells and by their HIL ratios. The recorded depth of 32 m is well below that indicated by the fresh shells, but their number is small and they could well have been from a resident population. The old shells are clearly from a shallow-water populaTABLE. 3, ESTIMATION. OF DEPTH. FROM. MEDIAN. HfL RATIO. Depths in metres. 22 0·618 21 -66 No. in 0,633 28'0 0·674 14 16'0 0'649 0'629 74652833-4 0'634 0'653 >39'5 0.646 0,637 0,679 -22'5 25 -62 19'5-61'5 25'5-80 Estimated Probable 35 0'658 16 37'0 -50 13'0 24'5 54'0 0,651 40'5 37'5 39'5 39 34'5 45'0 0'630 33'0 Length 9770'5 -28 4-5 sample (cm) (median) depth depth depth range HfL 16 32 36 } 17 35 58 Recorded 15'5-38'5} 26 -64} 25 -62 21 -52} 23 >34'5 theThe mid-point quoteddepth, of median the-55} series, of samples of even number is the mean of the two values adjacent to repancy between estimated and recorded. tion, either washed out from near the coast some twelve miles to the south or derived from an old shell deposit formed in shallow water. One other sample, DS 28, which was used in plotting the regressions, also appears to show evidence of transport along the bottom. Only living shells were measured, and these gave appreciably lower shell ratios in relation to depth than other samples from Poole Bay. The 3-4 cm group gives an estimated depth of about 23 m and the4-S cmgroup an estimated depthofI8'S m, the recorded depth being only I I m. This sample was taken close to the tidal race off Old Harry Rocks, so that it seems probable that the specimens had been washed into shallower water while still alive. It would appear that under favourable circumstances a close correlation of shell ratio and depth may be obtained, even with comparatively small samples (cf. Table 3). There are a number of variables and sources of error in such a comparison. These include the small size of the sample and consequent sources of inaccuracy in determining a true median, the possibility that shells have been transported along the sea floor from a different depth, inaccuracies in determining or estimating the depth of the samples on which the regressions.
(13) 716. N. A. HOLME. are based, and inherent variability in different populations. Some of the estimates in Table 3 based on small samples are so close to the recorded depths as perhaps to be fortuitous. The fact that a relatively good correlation has been obtained in spite of the sources of variation mentioned above suggests that the correlation is in fact much closer than the stated limits indicate. DISCUSSION Although it is well known that the form of some molluscs, as of other organisms, varies in different habitats, there is little information on the causes of such variation. The shell-shape and proportions of fresh-water lamellibranchs have been studied by a number of workers (see Eagar, 1948, for references), and shell form has been related to such factors as water-movement, wave-action, or the nature of the bottom, and there are also characteristic differences between the form in stream as opposed to lake environments. Ohba (1956) has studied the effects of varying population density on growth, under experimental conditions, of the marine lamellibranch Venerupis semidecussata. At high densities not only was growth (measured as increase in weight) retarded, but increase in length was proportionately less than that in height and width of the shell. In this instance shell proportions may well have been influenced by the rate of growth. In V. rhomboides the question of crowding does not occur, at any rate within individuals of the same species, but it may be that other factors produce individuals of differing shell proportions through their effect on the rate of growth. In Venerupis rhomboides there appears to be a correlation of shell form with depth of water, but as many other factors change with depth it is possible that the observed variation may be due to some other cause. Since some workers have found shell-shape to be partly related to the type of deposit, a brief survey was made of the range of sediments inhabited by V. rhomboides. This species on the whole occurs only in deposits containing some gravel or coarse sand, but the proportion of mud (silt plus clay) appears to vary considerably. No sediment analyses have been made, but the deposits have been classified as 'clean' or muddy. Taking the DS series of samples the median plots have been distinguished on this basis (Text-fig. 8). It will be seen that on the whole the shallow-water offshore samples (10-20 m) tend to be more muddy than the deeper samples. This might, however, be expected from any random collection of bottom samples taken at varying depths. The usual sequence of deposits is a belt of clean sand or shingle on the shore and extending seawards to only a few metres depth; beyond this deposits may be of sand or gravel, containing a variable and sometimes large proportion of mud, giving way at greater depths to fairly clean sands or gravels. Clean gravel deposits are almost invariably subject to considerable scour, and on the shore and in shallow water may be almost barren, but in deeper water, such as.
(14) SHELL. FORM. IN VENERUPIS. RHOMBOIDES. at the Eddystone, the scour is evidently insufficient to prevent the establishment of a burrowing fauna. Muddy deposits in shallow water would be associated with less bottom disturbance, and it seems possible that in shallower water a species like Venerupis rhomboides can only establish itself in the more stable gravel deposits which at the same time permit deposition of mud. The only way of determining whether depth or soil grade is responsible for the shell proportions of V. rhomboides would be to obtain samples either from a deep-water muddy gravel or a clean inshore gravel. Deep-water muddy gravels are scarce in the Channel, but there are places on the shore where the 3-4 em. 0·70. 4-5. •. em. • o. o. -..J. J:"0.65L 0 o o o. 20. 30. 10 Depth (m). 20. 30. 40. 50 60. Text-fig. 8. Regressions of depth on median height/length values. Only DS stations plotted; regression lines as in Figs. 6 and 7.• , samples from muddy sediments; 0, samples from , clean' sediments.. deposit is clean and coarse, and the bottom not too disturbed. One such place is the Scilly Isles where there is a coarse granite sand between some of the Islands. Venerupis is unfortunately rare there, and some of the empty shells collected may have been washed in from similar deposits in shallow water offshore. Five specimens, all over 5 cm long, had height/length ratios between 0'731 and 0'752, clearly corresponding to the broad shallow-water form. Similarly, the type locality of Turton's Venus sarniensis is from low-tide mark in sand at Guernsey, where the sands, although finer grained than at Scilly, would be unlikely to be very muddy. It therefore seems unlikely that the nature of the deposit is responsible for the observed variation in shell ratio. Temperature is another factor which changes with depth. In the western half of the English Channel a thermocline becomes established in the summer months, so that off Plymouth there is a difference of about 30 between surface and bottom temperatures, and one may therefore expect a corresponding gradient of bottom temperatures according to depth. However, the samples were taken over a wide area of the Channel, with corresponding differences in.
(15) N. A. HOLME. bottom temperature, and even in the eastern Channel, where there is no vertical temperature gradient even in summer, a good correlation of shell shape with depth was shown by the few samples from this area. It therefore seems unlikely that shell form is correlated with temperature. Although some vertical stratification of food, whether plankton or detritus, must occur, it seems unlikely that this would be so precisely zoned by depth, especially in areas where vertical mixing occurs, as to account for the observed changes in the shell. One factor which is invariably correlated with depth is light penetration. However there are very considerable variations in penetration in different parts of the Channel (cf. Gall, 1949), so that the correlation of shell form with depth could hardly be attributed to this factor. It would appear that no factor other than pressure is consistently related with depth, and we must therefore conclude that this is the most likely cause of the change in shell proportions. It seems unlikely that any chemical reactions would be significantly changed over the range of pressures involved (say 1 to 7 atmospheres), but there remains the possibility that the animals are sensitive to and respond to these relatively small differences in pressure. Digby (1961) cites several instances of invertebrates sensitive to hydrostatic pressure changes, and recent work by W. R. Lowenstein (1960) has shown that a species of dogfish is sensitive to pressure changes corresponding to differences in depth of a metre or so, so that it is possible that other animals are more susceptible to pressure differences than is at present supposed. If this hypothesis is rejected we must seek an answer in terms of an interrelationship of the stability and grade of bottom deposit with current and/ or wave-disturbance, or in the food supply. I am indebted to the captains and crews ofthe Laboratory's research vessels for much of the material used in this work, and to Dr A. D. Ansell and Dr N. S. Jones for samples from the Clyde and Isle of Man respectively. I would also like to thank Mr G. M. Spooner for his assistance in obtaining specimens, and for reading the manuscript. SUMMARY. Two forms of Venerupis rhomboides occur in Plymouth waters. A more slender form, corresponding to that described by Pennant, occurs in the Eddystone shell gravel, and a more robust form, corresponding to the Venus sarniensis of Turton, occurs at the mouth of the River Yealm. The two forms differ in ratios of shell height, width and lunule width relative to shell length. A population with intermediate ratios is found at 6·S m in Plymouth Sound. Plots of height/length ratios of these and another intermediate sample on probability paper did not indicate that the intermediate populations were.
(16) SHELL FORM IN VENERUPIS RHOMBOlDES. 719. composed of mixtures of the two extreme forms, and it was provisionally concluded that these were all variants of a single species. If the height/length ratios of series of samples from different localities are plotted against depth of water on a logarithmic scale, an inverse relationship, approaching a straight line, is obtained. Regression lines for median ratios in the 3-4 and 4-5 cm length groups have been plotted separately, as there is some change in proportion with increasing length. These show a highly significant negative correlation between shell ratios and depth. From the regression lines it has been possible to obtain an estimate of the depth inhabited by even quite small samples of shells. Depth estimations have been made for eight samples, consisting mainly of dead shells. Six samples lay within the expected limits, and discrepancies in the other two samples are attributed to transport along the sea floor. The possible causes of the differences in shell ratios are discussed. Previous work suggests that shell ratios may be affected by different rates of growth. Soil grade, temperature, food supply, and light penetration are considered unlikely causes of the observed differences in shell ratios, and it is suggested that the pattern of growth may be affected by pressure. The Appendix contains a key to British species of Venerupis. REFERENCES BucQuOY, E., DAUTZENBERG, P. & DOLLFUS,G.-F., 1893. Les Mollusques marins du Roussillon, T. 2, Fasc. 9, PP. 389-45°. Paris: Bailliere and Sons. DIGBY, P. S. B., 1961. The vertical distribution and movements of marine plankton under midnight-sun conditions in Spitzbergen. J. Anim. Bcol.,Vol. 30, pp. 9-25. EAGAR,R. M. C., 1948. Variation in shape of shell with respect to ecological station. A review dealing with recent Unionidae and certain species ofthe Anthracosiidae in Upper Carboniferous times. Proc. roy. Soc. Bdinb., Vol. 63B, pp. 130-48. GALL,M. H. W., 1949. Measurements to determine extinction coefficients and temperature gradients in the North Sea and English Channel. J. mar. bioI. Ass. U.K., Vol. 28, pp. 257-80. HOLME,N. A, 1961. The bottom fauna of the English Channel. J. mar. bioI. Ass. U.K., Vol. 41, pp. 397-461. LOWENSTEIN,W. R., 1960. Mechanisms of nerve impulse initiation in a pressure receptor (Lorenzinian ampulla). Nature, Lond., Vol. 188, pp. 1034-5. MADSEN,F. J., 1949. Marine Bivalvia. Zool. Iceland, Vol. 4, part 63, II6 pp. MARINEBIOLOGICAL ASSOCIATION, 1957. Plymouth Marine Fauna, 3rd ed. Plymouth. OHBA,S., 1956. Effect of population density on mortality and growth in an experimental culture of a bivalve, Venerupis semidecussata. BioI. J. Okayama Univ., Vol. 2, pp. 169-73. PENNANT,T., 1777. British Zoology, 4th ed., Vol. 4, London (Illustration in the 5th ed., 1812, Vol. 4, Plate 58, Fig. 5). TURTON, W., 1822. Conchylia Insularum Brittanicarum. The Shells of the British Islands, Systematically arranged. 279 pp. Exeter..
(17) m) pth rittany. A. of HOLME No. 2I II infew 0·662 10 0'68I IO I2 0,686 28 0,668 130 2I II I8 20 I9 0'643 0'76I 0'659 0'704 0'693 0'63I 34 3-4 78596The A II9 I3 0'728 I7 Nil 326424 0.670 0'659 3-4 IOll 0'670 All 0'669 27 4-5 I636'5 0'658 Very 3I 90 0'7I8 0'639 29 0'648 0'65I 0·644 N il 0·657 0.648 0·697 0'655 25 0·664 0.670 27 I7 I3 3'5 27'5 0'669 0'733 (median) 3-4 living group HIL few 57'5 6'5 I3 30 29'5 I5 I9 0'649 ?36 720 45 0'663 sample (cm) specimens 2'5 N.No. 4-5 0·663 0'669 4-5 4-54-5 Man 4-5 I7 majority DS5 I38 DS 58 LINES (TEXT-FIGS. 6 from AND 7). which Eddystone each 'DS' locality, stations used and but are for Sa1combe from estimating the remaining Holme are depths. made (1961). samples upSamples of in were collections each the made taken Yealm, on on Plymouth several only one occasions Sound, occasion. in TheDETAILS second part the tablewere shows additional stations, also shown these figures, TABLE 4. OF ofSAMPLES USED FOR PLOTTING REGRESSION Length APPENDIX I.
(18) No. 22 8Nil 0·618 0·679 14 0'634 I inSHELL 0·630 3-4 0·674 0'646 0'633 0'649 0'629 0'637 537624H/L 0·653 4-5 sample 0.658 group 0.651 (median) living (em) specimens 0'630 3-4 II6 II2 II3 133 205 Length ADDITIONAL SAMPLES(SEE TABLE 3) DS DS. of 16 FORM INNo. VENERUPIS 36 39 58 17 35 32. RHOMBOIDES721. LOCATION OF REMAINING SAMPLESINCLUDED IN TEXT-FIGS. 4 AND 5. Number of stations, followed by total of individuals in parentheses Mount's Bay I (I) East of Selsey 8 (27) Falmouth area I (I) Rye Bay 2 (6) 2 (3) Channel Islands I (4) Plymouth area Great West Bay 3 (5) Quiberon area 5 (II) Weymouth Bay area 3 (12) Firth of Clyde I (3) Poole Bay 8 (19) There are in addition small samples, of less than five, from certain stations used for calculating the regression lines. Only length groups containing fiveor more individuals were used for the calculation. Note added in proof Depths have been reduced to Chart Datum, which corresponds approximately to Probably mean tide level should have been adopted, which would have resulted in an increase in the steepness of the regression lines, since depth is plotted on a logarithmic scale. Since the relation between shell proportions and depth must be regarded as empirical and not corresponding exactly to a straight line, this small correction can be disregarded. M.L.W.S.T.. APPENDIX KEY TO BRITISH. II. SPECIES OF VENERUPIS. Five species of Venerupis occur in British waters: V. pullastra, saxatilis, decussata, aurea and rhomboides. While the majority of specimens may be identified from figures and descriptions in the literature, there are possibilities of confusion, for example between V. aurea and the shallow-water form of.
(19) N. A. HOLME. 722. v. rhomboides.. The following key is based on shell characters only (see also. Text-fig. 9):. I. Pallial sinus extending forward of the mid-point of the shell. Lower limb of pallial scar (below sinus) long and narrow. Inside white, often stained with purple posteriorly. 2 Pallial sinus usually not reaching mid-point of shell. Lower limb of pallial scar usually wedge-shaped. 3 2. Outside with fine radial and concentric sculpture. Concentric ribs little modified posteriorly. In sand or gravel, attached to small stones by a PULLASTRA byssus. Concentric ribs becoming foliaceous posteriorly. Radial sculpture present, but may be worn away in some specimens. Shape irregular, rather elonSAXATILIS gated. In rock crevices. 3· Radial sculpture as distinct or more distinct than concentric sculpture. Lower DECUSSATA limb of pallial scar wedge-shaped. Outside matt. Radial sculpture absent or restricted to faint irregular grooves. Lower limb of pallial scar variable. Outside slightly glossy. 4. A. c. D. Text-fig. 9. Inside of right valves of Venerupis shells, showing pallial and adductor scars. A, V. pullastra, with line showing mid-point of shell; B, V. decussata; c, V. rhomboides; D, V. aurea. x~, except D which is x t. 4. Inside white or cream, tinged with yellow. Length up to 4 em. Fairly thin-shelled, triangulo-ovate, somewhat inflated. Outside cream-coloured, usually with liver-coloured markings. Lunule well defined, bounded by a fine groove. Pallial sinus reaching to about mid-point of shell. Faint radial AUREA sculpture often present. Inside white, often tinged with pink. Length 5 em or more. Shell thick, triangulo-ovate or rhomboidal. Outside creamy white, often with pink or reddish brown markings. Lunule sometimes poorly defined, not bounded by a dearly marked groove. Radial sculpture absent. Pallial sinus does not extend to mid-point of shell. RHOMBOIDES Note. There has been some doubt as to the separate identity of saxatilis, and it may be difficult to distinguish from pullastra where the habitat is not known. The shape of the pallial sinus in aurea is variable. It is usually rather rounded, with a narrow V-shaped lower limb..
(20)
Figure
Related documents
This paper renders the importance of the main ruderal plant associations in unarranged urban and peri-urban areas that bring a high contribution to the aesthetics of
MI : Motivational interviewing; MIC Lab : Motivational Interviewing Coding Lab- oratory; MITI : Motivational interviewing treatment integrity; MISC : Motiva- tional
The data collected from the upper level scientific computing and Visual Basic courses are used to assess the students' logical thinking at different levels of computer science
Overall Objective: Improving ICT skills and Maximising Graduates’ Employability in SMEs Fundamental Objectives: Improve Hardwork for Graduates Improve Problem Solving
In our “Present Value” estimates, we used as instruments, the fit and its one period lag of the difference of the weighted present value of the fundament (the mark-up over real
Standardization of herbal raw drugs include passport data of raw plant drugs, botanical authentification, microscopic & molecular examination, identification of
These three measures were analyzed in the same cognitive tasks in single- task and dual-task (cognitive task and visual search) conditions in a within-subjects experiment
Based on the theoretical review and the empirical studies mentioned above, in this current study we formulated the hypothesis that, fundamentally, the components of
