O R I G I N A L R E S E A R C H
Open Access
Design optimization of hydraulic energy
storage and conversion system for wave
energy converters
Dong Wang
*and Kaiyuan Lu
Abstract
Wave energy collected by the power take-off system of a Wave Energy Converter (WEC) is highly fluctuating due to the wave characteristics. Therefore, an energy storage system is generally needed to absorb the energy fluctuation to provide a smooth electrical energy generation. This paper focuses on the design optimization of a Hydraulic Energy Storage and Conversion (HESC) system for WECs. The structure of the HESC system and the mathematical models of its key components are presented. A case study and design example of a HESC system with appropriate control strategy is provided. The determination of the ratings of the HESC system is also investigated in order to achieve optimal system energy efficiency.
Keywords:Energy storage, Hydraulic system, Wave energy, System modelling, System optimization
1 Introduction
As a kind of renewable energy, wave energy and its utilization have obtained increasing interests in the past decade [1–4]. Wave Energy Converter (WEC) is nor-mally used to harvest the wave energy and transform it to electrical energy. Many different WEC systems have been studied and reported [1–8], and they can be cate-gorized into two main types as turbine-type and buoy-type [1]. The turbine-type WECs, including Oscillating Water Column (OWC) WEC [4] and overtopping WEC [5,6], use turbines as the main energy conversion device. While the buoy-type WECs, which are also known as Point Absorber (PA) WECs, utilize fully submerged (below surface) absorber (e.g. the Archimedes Wave Swing (AWS) based [7]) or floating (on the surface) absorber [8–10] to capture the wave energy. The PA-WECs are considered to be more environmental friendly [1] and have obtained interests from both academic researches [7–10] and industrial prototypes [11,12].
The Power Take-Off (PTO) systems of the PA-WECs can be categorized into two main types as electric-type and hydraulic-type [3]. The electric PTOs, including linear generator [7, 10] and rotary generator with
gearbox [9], directly convert the captured wave energy to electricity. While the hydraulic PTOs transfer the wave energy to hydraulic energy, which is used to drive either a turbine [13] or a hydraulic motor [8] that is con-nected to an electric generator.
The situation of waves with large force at low speed can be well suited by the hydraulic PTOs since they can provide much larger force density than the electric PTOs, especially at high system pressure [2]. Thus, hydraulic PTOs should be more compact in size and weight, economically competitive, and relatively easy to install and maintain [2,14]. Furthermore, since the wave energy is highly fluctuating, from both the wave-to-wave and wave states time scales, the required peak power capacity of the PTOs greatly exceeds the time-averaged power delivered to the grid. Energy storage system is thus generally required to smoothen the final electrical power output to avoid the impairment of power quality from the grid point of view [3, 14]. In order to reduce the power ratings of the key components of the PTO for achieving a compact and energy efficient design, the energy storage device is expected to be located directly after the wave energy absorbers. The gas accumulator, which stores the hydraulic energy and fluid by compressing the gas, is currently the most common choice [2,3,14].
* Correspondence:[email protected]
Department of Energy Technology, Aalborg University, Pontoppidanstraede 111, DK-9220 Aalborg, Denmark
In this paper, the design optimization of the Hydraulic Energy Storage and Conversion (HESC) system used in the hydraulic PTO system for PA-WECs is presented. The ratings of the HESC system are investigated in order to optimize the system energy efficiency. This paper is organized in the following manner. Section 2 illustrates the structure of the HESC system for PA-WECs and the mathematical models of all the key components are pre-sented. In Section 3, the integration of the HESC system in the WEC is discussed and its performance is illustrated. Design optimization of the HESC system regarding energy efficiency is carried out and system design guidelines are provided in Section 4. Finally, Section 5 draws conclusion.
2 HESC system modelling
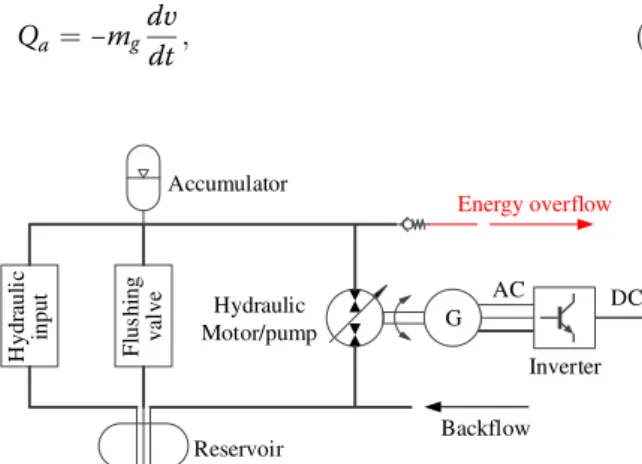
Figure 1 illustrates the structure of the HESC system that can be adopted in WECs. It consists of high-pressure gas accumulator, hydraulic motor, low-pressure reservoir, pipe-lines, and electrical generator. The gas accumulator absorbs the fluctuating flow from the hydraulic input and provides required flow to drive the variable displacement swash-plate hydraulic motor and the connected electrical generator at certain power level. A pressure relief valve is used to protect the system against over-pressure. The energy overflow can be collected by another energy storage system, which can be shared by several PTOs. The fluid loss caused by the over-flow is compensated by the backover-flow to maintain the pres-sure in the reservoir. The mathematical models of the key components are given in details in this section.
2.1 Gas accumulator
The connection interface between the accumulator and the hydraulic system can be described by two variables: the actual flow rate of the fluid entering the accumulator Qaand the fluid pressure at the accumulator inletpa.
Since the accumulator stores the hydraulic fluid by compressing the gas in it, the actual flow rate of the fluid entering the accumulatorQais equal to the compression
rate of the gas in the accumulator
Qa ¼−mg
dυ
dt; ð1Þ
wheretis the time,mgis the gas mass, andυis the gas
specific volume. The gas specific volume can be calcu-lated by integrating both sides of (1) if the initial gas spe-cific volumeυ0is known.
The accumulator inlet pressure pa is determined by
the gas absolute pressure pgand the pressure difference
between them. The gas absolute pressurepgcan be
cal-culated according to the Benedict-Webb-Rubin (BWR) equation of state as
pg ¼RT=υþ B0RT−A0−C0=T2
=υ2þaα=υ6
þðbRT−aÞ=υ3þC 1þγ=υ2e−γ=υ2
=υ3T2;
ð2Þ
whereA0, B0,C0, a,b, c,α, andγare constants in BWR
equation, andT is the gas temperature. In this analysis, nitrogen is considered.
Gas temperatureTvaries during the compression and expansion process and it will cause irreversible heat transfer, i.e. from gas to accumulator wall and eventually to the outside environment. Elastomeric foam with ap-propriate properties is inserted to perform as“heat sink” and the thermal loss can be reduced significantly. Since the foam has large contacting surface with gas and very small wall thickness, it is appropriate to assume that the foam and gas are at the same temperatureTall the time [15]. Thus, the gas energy equation can be written based on the energy balance principle as
mg
du dt ¼−pg
dV dt −mfcf
dT
dt−hAwðT−TwÞ; ð3Þ whereuis the gas internal energy per unit mass,Vis the gas volume,mfis the foam mass,cfis the specific heat of
foam, h is the heat transfer coefficient, Aw is the
effective heat convection area of the accumulator, and Twis the accumulator wall temperature. For a real gas,u
can be described as
du¼cυdTþ T ∂
pg ∂T υ− pg
dυ; ð4Þ
where cυ is the constant-volume specific heat of gas. It should be noted thatcυis gas temperatureTand specific volumeυdependent
cυ¼c0υþ 6 T3 C0 υ − c γ þ 3c T3 2 γþ 1 υ2
e−γ=υ2; ð5Þ
where C0, c, and γare constants in BWR equation, and
c0υ is the constant-volume specific heat for ideal gas. Generally, c0υ also varies with the gas temperature T. However, for nitrogen used in this analysis, the change is so small during the normal working temperature range and constantc0υcan be used.
Combining (2), (3), and (4) yields [15]. DC AC Hydraulic Motor/pump Accumulator Reservoir M F lus hi ng val v e c il ua r d y H in p u t G Inverter Energy overflow Backflow
1þmfcf mgcυ
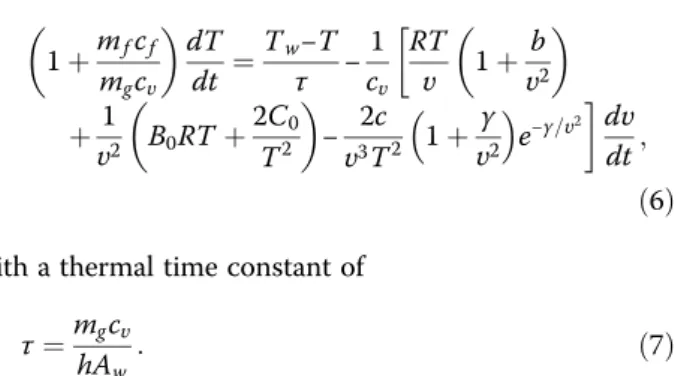
dT dt ¼
Tw−T
τ −
1 cυ
RT
υ 1þ
b
υ2
þυ12 B0RTþ
2C0
T2
− 2c υ3T2 1þ
γ υ2
e−γ=υ2
dυ dt;
ð6Þ
with a thermal time constant of
τ¼mgcυ
hAw: ð
7Þ
Obtaining υ from (1), the gas temperature can be calculated by (6). Then, gas absolute pressure pg can be
obtained by (2).
The pressure difference betweenpaandpgis the
pres-sure loss caused by the friction, e.g. flow entrance effects, viscous shear, etc. Detailed modelling of friction loss is possible but its magnitude does not justify the complexity it brings into the analysis. To simplify the model, the pressure loss (as percentage of the fluid pres-surepaat accumulator inlet) is assumed to be half of the
friction loss (as percentage of inputLf/E), as
pg−pa
pa ¼ sgnðdVÞ k 2
Lf
E ; ð8Þ
where sgnðdVÞ ¼ þ1
−1
fluid outflow fluid inflow ;
Lf is the accumulator friction loss in one cycle,E is
the energy input to the accumulator in one cycle, andk is a factor introduced to avoid pressure jump when flow direction changes. A simple linear variation of k when flow direction changes is illustrated in Fig.2.
2.2 Hydraulic motor/pump
Hydraulic motor/pump is an energy conversion device. It converts hydraulic energy to mechanical energy when operating in motor mode, and mechanical energy to hydraulic energy while operating in pump mode. Thus, it has two interfaces: (a) from the hydraulic side where actual flow rate entering the hydraulic motor/pump Qm
and pressure difference between the inlet and outletΔp are required; (b) from the mechanical side where actual torqueTmand angular velocityωare needed.
The ideal flow rate of the fluid entering the hydraulic motor/pump can be calculated by
Qmi¼xωD; ð9Þ
whereDis the maximum motor/pump displacement per radian,ω is the angular velocity, andxis the fraction of maximum unit capacity. It is known that xis related to the swivel angle α0 of the hydraulic motor/pump as
[ http://www.insanehydraulics.com/library/files/Hydraulic-Trainings-for-Axial-Piston-Units.pdf].
x¼ sinα0
sinα0;max: ð
10Þ
Swivel angle α0 can be either positive or negative as the hydraulic motor/pump has two operation modes. It is defined in this analysis that the flow rate is positive in motor mode, which corresponds to positive swivel angle.
2.2.1 The volumetric efficiency
In reality, the ideal flow rate is always lower than the ac-tual flow rateQmin motor mode, due to leakage,
cavita-tion, and fluid compressibility. By neglecting the cavitation loss, which is small for modern hydraulic motor, the volumetric efficiency can be calculated as [15].
ηυ¼
Qmi Qm ¼
1
1þ Cs x Sþ
Δp
β þ
Cst
xσ
; ð11Þ
where Csand Cst are the laminar and turbulent leakage
coefficients respectively, andβis the fluid bulk modulus of elasticity (1660 MPa for most hydraulic fluid).Sandσ are given as.
S≡μω
Δp;andσ≡
ωD1=3
2Δp=ρ
ð Þ1=2; ð12Þ
whereμis the fluid viscosity, andρis the fluid density.
2.2.2 The torque efficiency
The torque provided by an ideal hydraulic motor is
Tmi ¼xΔp D: ð13Þ
The motor torque efficiency may be calculated as [15].
ηt ¼
Tm
Tmi¼
1−CυS x −
Cf
x −Chx
2σ2; ð14Þ
where Cυ, Cf and Ch are the viscous, frictional, and
hydrodynamic loss coefficients, respectively. Then, the actual torque Tm provided by the hydraulic motor can
be found, which is used to drive the electric generator.
Similarly, the equivalent equations for pump mode are
ηυ¼QQm mi
¼1− Cs x j jS−
Δp
β −
Cst
x
j jσ; ð15Þ
ηt ¼
Tmi
Tm ¼¼
1
1þCυS x j j þ
Cf
x
j jþChx2σ2
: ð16Þ
2.3 Reservoir
The reservoir normally has a slightly higher pressure than the minimum intake pressure of the hydraulic motor/pump to ensure proper operation. A low-pressure accumulator with a relatively large volume is considered to serve this purpose in the analysis. Thus, the changing speed of the gas volume is relatively low during the operation, which means that the thermodynamic process can be assumed to be quasi-static and the gas can be treated as ideal. The gas thermodynamic process in the reservoir can be described by the Polytropic relationship
prVnr ¼Constant; ð17Þ
whereprand Vrare the gas pressure and volume in the
reservoir respectively, andnis heat capacity ratio. For a diatomic gas, such as nitrogen,n= 1.4 [16].
2.4 Pipeline
The main hydraulic components are connected by pipe-lines, including pipes, hoses, unions, fitting, bends, valves, etc. All these connecting elements have similar characteristics regarding the pressure loss, i.e. the loss is proportional to the square of the actual flow rate through the element. Thus, the total pressure loss in the pipelinesΔppcan be estimated by summing the“
equiva-lent pipe length”of all elements
Δpp¼ f Lp Dp ρ
2 Q2
p
A2 p
; ð18Þ
wherefis the friction coefficient,Lpis the total effective
pipe length, Dp and Apare the equivalent pipe internal
diameter and cross-sectional area respectively, andQpis
the flow through the pipelines.
The friction coefficientfis related to the fluid velocity through the pipelines. When the fluid velocity is high enough, the flow in the pipelines becomes turbulent flow instead of laminar flow. Reynolds number is used to judge the flow type
Re¼ 4 Qp
πDpv; ð
19Þ
wherevis the fluid kinematic viscosity. For laminar flow
f ¼64=Re; Re≤2000: ð20Þ
While for turbulent flow
f ¼0:332 Re−1=4; 2000< Re≤105: ð21Þ
2.5 Electrical generator
The generator converts the mechanical energy from the hydraulic motor to electrical energy. A Surface-Mounted Permanent Magnet Synchronous Generator (SM-PMSG) is chosen to simplify the analysis as well as achieving high energy efficiency. The machine torque equation is
Te ¼
nph
2 pλpmIs cosφi; ð22Þ
whereTeis the machine electromagnetic torque,nphis the
number of phases,pis the number of pole-pairs,λpmis the
flux linkage from the permanent magnets,Isis the machine
current amplitude, andφiis the internal power factor angle
(angle between current and internal voltage).
To use the machine current effectively, the machine current vector angle is controlled to achieve unit internal power factor, i.e. cosφi = 1. Thus, Is can be obtained
according to (22) for certainTe. Then, the machine copper
loss can be calculated as
pCu¼0:5nphI2sRs; ð23Þ
whereRsis the machine phase resistance.
At certain machine rotary speed nr, the corresponding
machine electrical frequencyfscan be calculated as
fs¼pnr=60: ð24Þ
The machine iron loss includes the hysteresis loss and eddy current loss, which are proportional to fs and f2s, respectively. Then, the generator energy efficiency can be calculated as
ηg ¼
Pout
Pin ¼
Teωr−pCu−Chysfs−Cedyf2s
TeþBmωr
ð Þωr ; ð
25Þ
whereBmis the machine viscous friction coefficient,Chys
and Cedy are the hysteresis and eddy current loss
coeffi-cients, respectively.
2.6 System integration
To integrate the above main components and form the hydraulic system illustrated in Fig.1, the following rules should be complied with.
2.6.1 The continuity equation
The effective flow rate Qe is equal to the sum of the
actual flow rates entering the accumulator Qa and the
hydraulic motorQm
Qe¼QaþQm: ð26Þ
The effective flow rate Qeis equal to the system input
Qe¼ Qin
Qm
;whenpa <pa;max
;whenpa≥pa;max ð27Þ
2.6.2 Pressure balance
The pressure difference between the accumulator and reservoir is equal to the pressure drop on the hydraulic motor and pipelines
Δp¼pa−pr−sgnð Þα0 Δpp: ð28Þ
where
sgnð Þ ¼ þα0 −1 1
motor mode
pump mode: ð29Þ
2.6.3 The equation of motion
The connection between the hydraulic motor and elec-trical generator should follow the motion equation as
Tm ¼J
dωr
dt þBmωrþTe: ð30Þ
whereJis the total moment of inertia of the rotary parts of the hydraulic motor and electrical generator.
3 System implementation
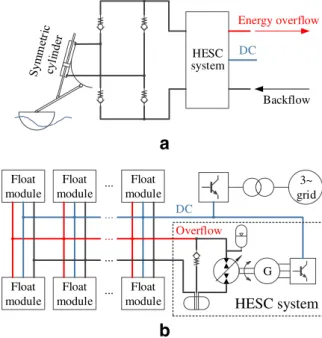
The HESC system can either be integrated into the PTO system or be included as a subsystem of the WEC. Fig.3a illustrates a typical PTO system (e.g. a float module of a PA-WEC) integrated with a HESC system. The
bi-directional flow obtained from the symmetric cylinder is converted to unidirectional flow by e.g. a hydraulic“H-bridge rectifier”consisted of four non-return valves. Then the uni-directional flow serves as the input of the HESC system. In addition, the HESC system could be integrated as a subsys-tem of the WEC as shown in Fig.3b, so that the hydraulic motor and generator used in the PTOs are not oversized [8]. A PTO system integrated with HESC system is studied in this paper. Fig. 4 shows the extracted power profile, which is optimized by certain Wave Power Extraction Algorithm (WPEA) [8]. It corresponds to the power pro-file that the PTO system of Wavestar WEC [11] can extract from sea state 3, which has large waves. While sea state 1 and 2 correspond to small and medium wave conditions, respectively.
When knowing the extracted power from the cylinder Pin, the system input flow rate can be calculated as
Qin ¼Pin=pa; ð31Þ
wherepais the accumulator inlet pressure.
3.1 Control strategy
It is seen from Fig.4that the harvested wave energy has a period around 3 s, which is much longer than the elec-trical time constant of a generator. Therefore, it is justi-fiable to state that the hydraulic motor and the electrical generator can be controlled to operate at a constant speed, e.g. the synchronous speed of the generator.
Due to the facts that the system input flow rate varies as the input wave energy fluctuates (31) and the storage capability of the accumulator is limited, the flow rate used to drive the hydraulic motor should be well adjusted to ensure smooth power output. Variable-displacement con-trol of the hydraulic motor, which is achieved by varying the fraction of maximum unit capacity x defined in (10), can be adopted for constant speed drive.
From the storage capacity point of view, a feasible and direct indication signal can be the fluid level in the accu-mulator, which can be transformed to the gas volumeV. The control strategy ofxcould be:
Float
module ...
Float module
Float module
Float
module ...
Float module
Float module
Overflow DC ...
...
...
M
G 3~ grid
HESC system
a
b
HESC system
Energy overflow
Backflow DC
Fig. 3PTO system with HESC system integrated.aFloat module with HESC system.bHESC subsystem handling the
(a) whenVreaches its maximum allowable volume
Vmax, no more fluid is allowed to flow out of the
accumulator andxis set to zero;
(b)whenVis below a pre-set valueVpre(e.g. 80% of Vmax),xis set to one to enable maximum output;
(c)whenVis betweenVpreandVmax,xis given by
x¼ Vmax−V
Vmax−Vpre: ð
32Þ
However, the above control strategy ofxmay result in overloading of the generator. Therefore, power control should be taken into account as well. A simple proportional-integral (PI) regulator is used to adjust the maximum allowable x, where the rated torque of the generator (or the rated phase current amplitude) is set as the reference. The minimum value ofxobtained from storage capacity control and torque/current control is chosen when driving the hydraulic motor.
3.2 System configuration
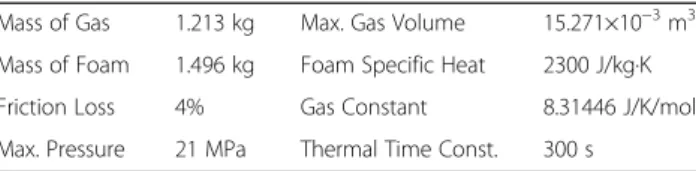
The parameters of the gas accumulator, hydraulic motor, and generator used in the analysis are given in Tables1,2 and3, respectively.
Eight gas accumulators are connected in the HESC system to provide enough storage capability. The mass of gas in the reservoir is 2 kg with a pressure of 0.394 MPa. The total effective pipe length and the equivalent pipe internal diameter are estimated to be 12 m and 0.015 m, respectively. The fluid in the system is oil with the density and kinematic viscosity of 869 kg/m3 and 60×10−6m2/s, respectively.
3.3 System operation performance
Figure5shows the HESC system operation performance at sea state 3. It can be seen that the system pressure is controlled and limited to the maximum allowable value of the accumulator inlet absolute pressure (i.e. 21 MPa as listed in Table 1). When the input wave energy exceeds the system’s capability (e.g. during time range of 24 s to 28 s), the relief valve activates and the flow entering the accumulator is zero. Moreover, it can be observed from the time interval 29~ 33 s that the generator output power is well controlled and limited to its rated power (i.e. 35 kW). When the system pressure is about 18 MPa at 29 s, the fraction of maximum unit capacity x of the
hydraulic motor is one to maximize its output. Due to the surge input, the output power of the hydraulic motor in-creases as the system pressure inin-creases. Thus,xis adjusted by the controller to limit the hydraulic motor shaft output, so that the generator will not exceed its rated value. It can be seen that the energy efficiency of the HESC system itself is around 61.7%. While for the whole system, where the overflow is considered as loss, the energy efficiency is about 53.2%.
4 Design optimization
The efficiency of the example system shown in Fig. 5is not very satisfactory. Thus, investigation into the design of the system ratings is carried out in this section to optimize the system energy efficiency.
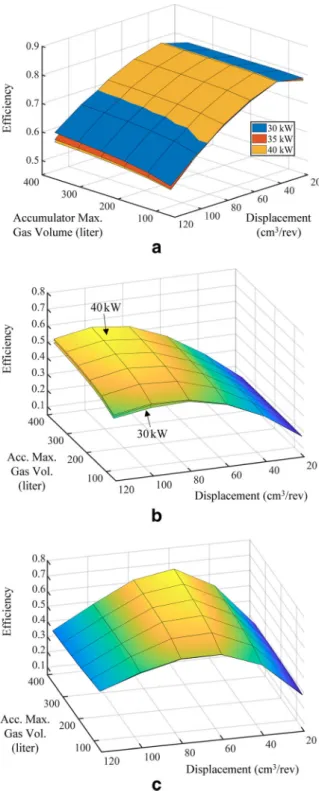
Figure 6 shows the system energy efficiency with different system rating configurations at 21 MPa system pressure with generator power rating varying from 30 kW to 40 kW. It can be seen from Fig. 6a that the HESC system efficiency increases as the maximum hydraulic motor/pump displacement D decreases in a wide range (40 to 120 cm3/rev). However, the maximum accumulator gas volume Vmax (storage capacity) has limited influence on the HESC system efficiency. This is because that the energy overflow is not considered as losses of the HESC system, since it could be handled by another HESC system as shown in Fig. 3b. However, such assumption will result in unreasonable small system capacity, since smallDmeans small torque (13). Thus, the whole system efficiency should be taken into account when performing design optimization. It can be seen in Fig.6b that there is an optimalDvalue (around 100 cm3/rev), which can provide higher whole system efficiency.
Figure 6c shows the whole system efficiency at sea state 2, where medium wave condition presents and less
Table 1Gas accumulator parameters [17]
Mass of Gas 1.213 kg Max. Gas Volume 15.271×10⁻³m3 Mass of Foam 1.496 kg Foam Specific Heat 2300 J/kg·K Friction Loss 4% Gas Constant 8.31446 J/K/mol Max. Pressure 21 MPa Thermal Time Const. 300 s
Table 2Hydraulic motor parameters [17]
Displacement 107 cm3/rev Max. Swivel Angle 25 deg Friction Coef. 0.0048 Laminar Leakage Coef. 1.042×10⁻⁹ Viscous Coef. 153,407 Turbulent Leakage Coef. 1.20×10⁻⁵
– – Hydrodynamic Loss Coef. 0
Table 3Generator parameters
energy can be extracted. It can be seen that the optimal D value to achieve best whole system efficiency is re-duced to around 60 cm3/rev. This is reasonable since the average wave power is reduced, and a system with power ratings close to the wave power level could pro-vide higher energy efficiency.
Moreover, rather than the HESC system efficiency shown in Fig. 6a, the whole system energy efficiency is dependent on the accumulator storage capacity Vmax. Large Vmax will certainly help to increase the system efficiency as shown in Fig. 6b and c. Furthermore, the generator power rating, which can be considered as the system power rating, will also influence the system efficiency. However, the influence is small as can be seen in Fig. 6a though higher power rating is likely to give slightly higher system efficiency when the system is properly designed.
4.1 Influence of system pressure
It has been observed from Fig.6athat smallDcan help to increase the HESC system efficiency. However, small
D will reduce the system power rating (13), and the whole system efficiency is decreased due to large amount of energy overflow. A straightforward way is to increase the system pressure. According to (13), D can
Fig. 5HESC system operation performance at sea state 3
be halved when Δp is doubled. Fig. 7 shows the whole system energy efficiency when the system pressure is 42 MPa. It can be seen that the whole system efficiency for both sea state 2 and 3 can be balanced when D is around 50 cm3/rev, which is about half of the originalD in Table2.
Compared with the system efficiency at 21 MPa, the energy efficiency increases from 59.8% to 74.0% for sea state 3, from 71.1% to 82.3% for sea state 2. Furthermore, it can be observed that the system storage capacity has its saturation value of around 300 l at sea state 2; while the system efficiency can still be improved by increasing the storage capacity at sea state 2 when 21 MPa system pressure is applied. Thus, increasing the system pressure will help to increase the system efficiency and reduce the system storage capacity required.
Further increase to the system pressure could be con-sidered to achieve slightly higher energy efficiency, e.g. 76.9% and 83.2% for sea state 2 and 3 respectively at 63 MPa. However, the cost of high-pressure devices in-creases as the pressure rises. Detailed evaluation is
needed to find the optimal system pressure, so that the most economical system solution can be obtained.
5 Conclusion
In this paper, a HESC system for WECs is introduced and modelled in details. Control strategy is proposed to ensure that all the components are operating properly within their maximum limits. A case study of the HESC system is provided to evaluate the proposed control strategy and the system efficiency by taking the power profile of the WaveStar project as an example. Design investigation of the HESC system is then carried out to optimize the system energy efficiency. It is found that i-ncreasing the system pressure will help to increase the system efficiency and reduce the required optimal system storage capacity although the cost of high-pressure components will also increase. The balance between the system cost and payback of extra energy harvest should be carefully evaluated. The analysis carried out in this paper can be used to achieve the optimal system design of the HESC system.
Authors’contributions
DW carried out the design of the study, developed the system model, performed the system design investigation and optimization, analyzed the data, and drafted the manuscript. KL initialized the problem, coordinated the resources, participated in the design and data analysis, and helped to draft the manuscript. All authors read and approved the final manuscript.
Competing interests
The authors declare that they have no competing interests.
Received: 28 September 2017 Accepted: 31 January 2018
References
1. Muetze, A., & Vining, J. G. (2006). Ocean wave energy conversion - a survey. Industry Applications Conference - 41st IAS Annual Meeting, 3, 1410–1417. 2. Drew, B., Plummer, A. R., & Sahinkaya, M. N. (2009). A review of wave energy
converter technology.Proc of The Institution of Mechanical Engineers, Part A-journal of Power and Energy, 223(8), 887–902.
3. Falcao, A. F. de O. (2010). Wave energy utilization: A review of the
technologies.Renew Sust Energ Rev, 14(3), 899–918.
4. Dorrell, D. G., Halliday, J. R., Miller, P., & Findlater, M. (Sep. 2004).“Review of wave energy resource and oscillating water column modelling,” 39th international universities power Eng Conf(Vol. 1, pp. 649–653).
5. Kofoed, J. P., Frigaard, P., Friis-Madsen, E., & Sorensen, H. C. (2006). Prototype testing of the wave energy converter wave dragon.Renew Energy, 31, 181–189. 6. Vicinanza, D., Margheritini, L., Kofoed, J. P., & Buccino, M. (2012). The SSG wave energy converter: Performance, status and recent developments. Energies, 5(2), 193–226.
7. Polinder, H., Damen, M., & Gardner, F. (Sept. 2004). Linear PM generator system for wave energy conversion in the AWS.IEEE Transactions on Energy Conversion, 19(3), 583–589.
8. Hansen, R. H., Andersen, T. O., & Pedersen, H. C. (2011). Model based Design of Efficient Power Take-off Systems for wave energy converters.The Twelfth Scandinavian International Conference on Fluid Power, 2, 35–49.
9. Tedeschi, E., Carraro, M., Molinas, M., & Mattavelli, P. (2011). Effect of control strategies and power take-off efficiency on the power capture from sea waves.IEEE Transactions on Energy Conversion, 26(4), 1088–1098.
10. Holm, R. K., Berg, N. I., Walkusch, M., Rasmussen, P. O., & Hansen, R. H. (2013).
Design of a magnetic lead screw for wave energy conversion. IEEE
Transactions on Industry Applications, 49(6), 2699–2708. 11. Wave Star A/S.http://www.wavestarenergy.com.
12. AWS Ocean Energy Ltd.http://www.awsocean.com.
13. Weinstein, A., Fredrikson, G., Parks, M. J., & Nielsen, K. (2004). AquaBuOY - the offshore wave energy converter numerical modeling and optimization. Proceedings of MTTS/IEEE Techno-Ocean’04, 4, 1854–1859.
14. Sabzehgar, R., & Moallem, M. (2009). A review of ocean wave energy
conversion systems. Proceedings IEEE Electrical Power Energy Conference (EPEC),1, pp. 1–6.
15. Pourmovahed, A., Beachley, N. H., & Fronczak, F. J. (Mar. 1992). Modeling of a hydraulic energy regeneration system–Part I: Analytical treatment.J Dyn Syst Meas Control, 114, 155–159.
16. White, F. M. (2009).Fluid Mechanics(7th ed.p. 827). New York: McGraw Hill. 17. Pourmovahed, A., Beachley, N. H., & Fronczak, F. J. (Mar. 1992). Modeling of