R E S E A R C H
Open Access
Is there a correlation between follicle size
and gene expression in cumulus cells and
is gene expression an indicator of embryo
development?
Semra Kahraman
1*, Caroline Pirkevi Çetinkaya
1, Murat Çetinkaya
1, Mehmet Ali Tüfekçi
1,
Cumhur Gökhan Ekmekçi
1and Markus Montag
2Abstract
Background:In an article published in 2017,we discussed the results of the first part of our study into the morphokinetic development of embryos in relation to follicle diameter and homogeneity of follicular development. Our findings showed that embryos coming from small follicles in heterogeneous cycles had significantly higher rates of arrest or failure to reach blastocyst than embryos coming from large follicles in homogenous cycles. The aim of this further study was to investigate the relationship between follicular size and gene expression of cumulus cells (CCs) and evaluate whether gene expression could be an indicator of embryo development.
Methods:This study was based on 2495 COCs from 184 patients. CC expressions of five genes (TNFAIP6,PTGS2,HAS2,PTX3 andGDF9) were studied by generalized linear mixed models (GLMMs) regarding follicular size. CC expressions were then separately analysed regarding patient-specific variables (age, BMI, AMH and follicular size) in relation to embryos reaching blastocyst (eRB) or top or good quality blastocysts (TQ + GQ) using GLMMs with logit link.
Results:Follicular size significantly correlated with the potential of an oocyte to develop into a blastocyst: oocytes developing from large follicles were more than twice as likely to develop into an eRB than oocytes from small follicles (p < 0.001). Gene expression ofHAS2 and GDF9 correlated with blastocyst quality when separately evaluated with follicular size and the patient specific variables of age, BMI and AMH. However, no such correlation was found in other gene expressions studied.
Conclusions: Our findings suggest that differences in the expression of genes studied could be related to follicular size rather than to embryo quality. Although gene expression of HAS2 and GDF9 correlated with blastocyst quality, the only variable correlating with eRB and TQ and GQ blastocysts for each of these five models was follicular size.
Trial registration: This prospective cohort study was registered at clinicaltrials.gov (NCT02230449).
Keywords: Gene expression, Cumulus cells, Follicular size, Blastocyst
* Correspondence:[email protected]
1Istanbul Memorial Hospital, Assisted Reproductive Technologies and
Reproductive Genetics Centre, Piyale Pasa Bulvari 34385 Okmeydani Sisli, Istanbul, Turkey
Full list of author information is available at the end of the article
Background
We conducted a project between July 2014 and September 2015 investigating the relationship between the follicular size and oocyte competence using the morphokinetic and gene expression analyses of the same patient group.
In an article published in 2017, we discussed the re-sults of the first part of our study into the morphokinetic development of embryos in relation to follicle diameter
and homogeneity of follicular development [1]. Our
findings showed that embryos coming from small folli-cles in heterogeneous cyfolli-cles had significantly higher rates of arrest or failure to reach blastocyst than em-bryos coming from large follicles in homogenous cycles. Subsequently, we conducted this further study to com-pare gene expression between cumulus cells (CCs) ob-tained from follicles of different sizes, evaluating RNA concentrations of five well described genes involved in
cumulus expansion/ ovulation (HAS2, PTGS2, PTX3,
TNFAIP6andGDF9) [2–13].
There is increasing evidence that CCs play a crucial role in folliculogenesis and oocyte developmental com-petence acquisition [14–18]. Therefore, many studies correlating cumulus gene expression with different out-come measures such as oocyte maturity, fertilization, embryo development, implantation and pregnancy have been performed [2, 3, 16–24]. However, few investigate the relationship between gene expression and follicular size and embryo development to the blastocyst stage [25–27]. Recently, Nivet and colleagues [24], hypothesized that the combination of a follicle’s size and transcriptomic signature provide a reliable method to predict embryonic development. They concluded that follicular size had an impact on oocyte quality as measured by embryonic de-velopment and demonstrated that medium follicles yielded a better percentage of transferable embryos than large or small follicles.
The CC-derived candidate genes selected for the study were those which have been identified in previ-ous studies as regulated by oocyte signals and as hav-ing important functions in cumulus expansion and metabolism [28–30].
These were: hyaluronan synthase 2 (HAS2),
prosta-glandin-endoperoxide synthase 2 (PTGS2), pentraxin-related protein 3 (PTX3), tumour necrosis factor alpha induced pro-tein 6 (TNFAIP6) and growth differentiation factor 9 (GDF9).
HAS2 is critical for the formation and expansion of
the CC mass and expression levels correlate with early embryological development [2,4]. Furthermore,HAS2is one of the four genes contained in the ranking method evaluated by Ekart and colleagues [19] for identifying good quality metaphase II (MII) oocytes that will ultim-ately provide a significantly better outcome regarding good blastocyst development and live birth compared
with random selection. The measurement of HAS2and
GREM1 levels in CCs would reliably complement the morphological evaluation providing a useful tool for selecting oocytes with greater chances to be fertilized
and develop in vitro. Furthermore, HAS2 is considered
to be a human pregnancy or live birth candidate bio-marker with conflicting differential mRNA expression by qRT-PCR [2,19,31,32].
In bovine and mice, PTGS2 has a role in promoting
cumulus expansion and oocyte competence [5–8]. In a landmark study comprising eight patients, PTGS2, like
HAS2, was found to correlate with the morphology of
human day-3 embryos [2]. The median expression for
PTGS2 was found to be threefold higher in CCs of oo-cytes that resulted in pregnancy [31]. Moreover, PTGS2 expression was found to be significantly higher in CCs from oocytes that achieved term birth compared with those that failed to result in a successful pregnancy [31].
Previous studies have suggested that PTGS2 expression
in bovine and primate COCs may participate in the tim-ing of maturation [7, 33] and oocyte quality [6]. Other
studies have found an association between PTGS2 and
embryo morphological grade [2]. In mice,Ptgs2 and the resultant prostaglandin E2 facilitate cumulus expansion through induction of cumulus matrix genes [5] and are important in the survival of mouse cumulus cells [8].
ThePTX3gene product is another extracellular matrix protein that interacts with hyaluronan in the expanded cumulus matrix [34–36].PTX3 gene expression in CCs has been associated with oocyte/embryo competence and was determined as a potentially reliable predictor of
embryo developmental competence [3]. Elevated PTX3
expression has been found in CCs from oocytes that de-veloped into normal appearing embryos on day 3 com-pared with those from oocytes that failed to fertilize in 16 patients [3]. However, another study failed to estab-lish a correlation betweenPTX3expression and embryos
with good or poor morphology [21]. Nonetheless, in
other studies, expression of PTX3tended toward an as-sociation with pregnancy outcome [31,37].
TNFAIP6is synthesized by cumulus and granulosa cells in the preovulatory follicle [9,10]. It was selected because it is aGDF9-induced gene in periovulatory granulosa cells although its expression does not differ as a function of embryo quality and oocyte competence [2,38,39].
GDF9is an oocyte-secreted factor playing a key role in the process of follicular development from the recruit-ment of the primordial follicle to ovulation and even in corpus luteum formation [11–13]. It has been confirmed by many studies that GDF9is expressed both in oocytes and cumulus granulosa cells [40–42]. Increased levels of
The aim of our study was to investigate the relationship between follicular size and gene expression of CCs asses-sing these five candidate genes and to evaluate whether gene expression is an indicator of embryo development.
Methods Patients
This prospective cohort study was registered at clinical-trials.gov(NCT02230449) and received funding from the Grant for Fertility Innovation (GFI) in July 2014. It was conducted in a private IVF clinic between July 2014 and September 2015 and the analysis was based on 2495 COCs belonging to 184 patients, with culture until day 5. Our previous study on follicular size and morphoki-netics analysed 2526 oocytes [1]. However, in this study three patients and their 31 oocytes were excluded from the expression analysis because their CC samples did not give interpretable results due to technical issues. The patients presented various infertility causes, all pro-tocols were approved by the institutional review board and all patients gave their informed consent prior to their inclusion in the study. Patients were selected with inclusion criteria as similar as possible to the first part of the study [1]. Furthermore, the inclusion criteria speci-fied good prognosis patients with at least 8 COCs in order to provide us with a sufficient number of blasto-cysts for statistical analyses.
Patients were selected based on inclusion criteria (age≤39 years, body mass index (BMI) < 30 kg/m2, ≥ 8 COCs retrieved, < 2 previous treatment cycles, hCG trig-ger) and exclusion criteria (recurrent pregnancy loss, se-vere endometriosis, PGD or PGS, COC > 24, embryo transfer before day 5, PCOS, uterine anomaly, very se-vere sperm morphological abnormality such as
domin-antly macrocephal or globozoospermic sample or
cryptozoospermia,≤1million motile sperm cells in total ejaculate). In order to minimize bias, PCOS patients with an abnormally high number of COCs were ex-cluded [44]. Patient characteristics are shown in Add-itional file1: Table S1.
Female ages ranged between 18 and 38, with an aver-age of 30.81 ± 4.26 years. AMH measurements ranged from 0.17 to 8.6 with a mean of 3.15 ± 1.80. BMI
mea-surements ranged from 16.3 to 29.7 kg/m2with a mean
of 23.68 ± 3.00 kg/m2. This cycle was the first for 66.3% of the patients (n= 122) and the second for 33.7% of the patients (n = 62). Biochemical pregnancy was observed in 66.3% of the patients (n= 122), 53.3% (n= 98) had an ongoing pregnancy and finally, the live birth rate was 51.1% (n= 94).
Ovarian stimulation
Ovarian stimulation was performed as described previ-ously [1]. Briefly, recombinant FSH (rFSH; Gonal-F®;
Merck Serono, Switzerland) was used at a dosage of 150 to 225 IU, depending on clinical and hormonal evalua-tions. A daily administration of 0.25 mg GnRH antagon-ist (Cetrotide®; Merck Serono, Switzerland) was started when at least one follicle reached 12–13 mm in size.
Then, 250 μg recombinant hCG (Ovitrelle®; Merck
Ser-ono, Switzerland) was administered to achieve final oo-cyte maturation when at least three follicles reached a minimum mean diameter of 17 mm. Transvaginal ultrasound-guided oocyte retrieval was scheduled for 36 h later.
Follicular size
Follicular size was defined as large, ≥17 mm and small, < 17 mm at the time of oocyte pick-up (OPU), as a pilot study of more than 2300 oocytes previously performed in our ART centre in 2012 suggested that 17 mm was the size where statistically significant differences were observed. This preliminary study showed a relative in-crease of 80% for the good and top-quality blastocyst rate (TQ + GQ) of oocytes deriving from large follicles when compared to small follicles if the cut-off was set as 17 mm. This difference disappeared when the cut-off was taken as 20 mm. Each follicular aspiration was per-formed by the same doctor to reduce any possible in-accuracy of measurement to a minimum.
Embryo transfer and outcomes of treatment cycles After embryo transfer, for luteal phase support, patients received a twice daily dose of progesterone gel to be ad-ministered intravaginally (Crinone® 8%; Merck Serono, Switzerland). When pregnancy occurred, a daily dose was continued until the 10th week of gestation. Fourteen
days after pick-up, serum β-hCG was measured. At
7 weeks, a transvaginal ultrasound was performed to monitor early pregnancy. The implantation rate was cal-culated by dividing the number of implanted embryos by the total number of transferred embryos. However, for analyses purposes, patients with two transferred embryos but resulting with only one sac were excluded from the analysis as we could not know which embryo had im-planted and therefore would not have been able to ana-lyse any possible correlation between follicular size, gene expression and embryo development. Implantation ana-lysis was performed on transferred embryos where the number of gestational sacs matched the number of transferred embryos and on embryos where no biochem-ical pregnancy was achieved.
Total RNA isolation from cumulus cells and reverse transcription
The CCs of each oocytes were separately numbered, fro-zen, and cryostored at−20 °C in Cryo.S™Freezing Tubes
(Greiner Bio-One, Germany) containing 150 μL of RNA
laterStabilization Reagent (Qiagen, Germany). CCs were first incubated overnight in the reagent at 2–8 °C, then transferred to −20 °C for storage until RNA extraction. Total RNA extraction of individual CCs was carried out using the Total RNA Purification kit (NORGEN, BIOTEK CORP., Canada) as recommended by the manufacturer and final elution of the total RNA was performed using 32μl of RNase free water. Total RNA was quantified using a NanoDrop 2000c UV-Vis spectrophotometer (Thermo-Scientific, USA). The mean quantity of RNA per CC sam-ple was 102.5 ± 44.3 ng. RNA from each samsam-ple was used to generate cDNA using the Transcriptor High Fidelity cDNA Synthesis Kit (Roche Diagnostics GmbH, Mann-heim, Germany) with random hexamers, following the
manufacturer’s instructions. Total RNA and/ or cDNA
samples were stored at−80 °C until use.
Real-time PCR
Real-time PCR amplification reactions were carried out using a LightCycler 480 (Roche Diagnostics GmbH, Mannheim, Germany) with the LightCycler FastStart DNA Master SYBR Green I Kits (Roche Diagnostics GmbH, Mannheim, Germany). Real-time PCR was used
to quantify the mRNA transcripts levels of HAS2,
PTGS2,PTX3,TNFAIP6andGDF9. Oligonucleotide pri-mer sequences are listed in Additional file 1: Table S2.
Primers were designed to cross an exon-exon junction to avoid amplification of genomic DNA.
Primers were synthesized by Metabion International AG (Martinsried, Germany). Real-time RT-qPCR assays were performed in duplicate in 96-well plates. The thermal cyc-ling conditions were 95 °C for 5 min for polymerase acti-vation and the initial denaturation step, followed by 45 cycles with denaturation at 95 °C for 10s, annealing at 60 °C for 10s and extension at 72 °C for 10s. A melting curve analysis was recorded at the end of the amplification to evaluate the absence of contaminants or primer dimers.
For each CC sample, gene expression levels of HAS2,
PTGS2, PTX3, TNFAIP6 and GDF9 were calculated as fold-changes relative to B2M level calculated by 2-ΔΔCT method [46]. Depending on the transcript targeted, cumu-lus samples that did not reveal any expression data, either because of an amplification failure or because they did not show any expression of the five genes studied, were ex-cluded from the analysis.
Statistical analysis
NCSS (Number Cruncher Statistical System) 2007 (Kaysville, Utah, USA) program was used for statistical analysis. Data was reported as mean, standard deviation, standard error, frequency, percentage, minimum, max-imum. Due to the paired nature of the data, generalized linear mixed models (GLMMs) were conducted.
First, to analyse if there was any correlation between follicular size, the potential of embryos to reach the blastocyst stage, blastocyst quality and gene expression levels, separate GLMMs were conducted. In these models, expression levels of genes were introduced as target variables, follicular size, the potential of embryos to reach blastocyst stage and blastocyst quality as fixed factors and subject id as a random factor.
Second, separate GLMMs with logit link were conducted to analyse the factors affecting embryos development into eRBs or into TQ or GQ blastocysts. In these models, eRB and blastocyst quality were introduced as target variables; age, BMI, AMH, follicular size and expression levels of genes as fixed factors and subject id as a random factor.
Third, separate GLMMs with logit link were conducted to analyse any correlation between gene expression levels and implantation. In these models, implantation was in-troduced as a target variable; age, BMI, AMH, follicular size and expression levels of genes as fixed factors and subject id as a random factor.
A p value of p < 0.05 was accepted as statistically significant.
Results
Follicular size and CC gene expression
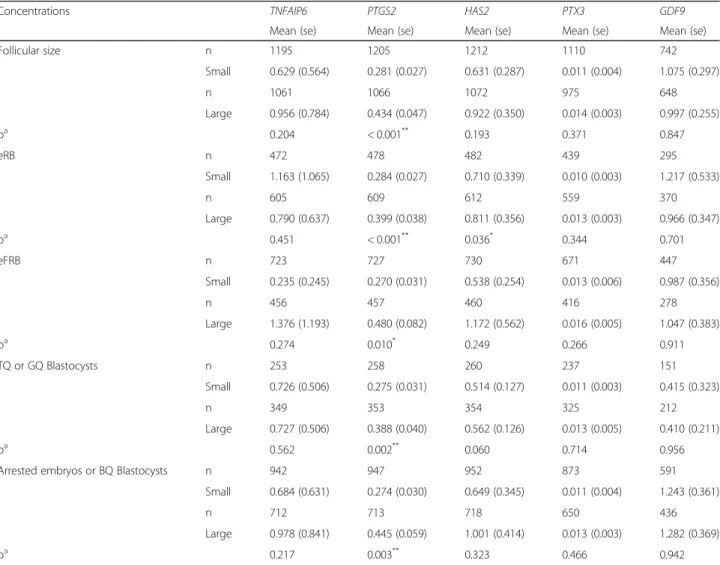
up-regulated in CCs deriving from large follicles when compared to small follicles (p< 0.001) (Table1).
CC gene expression, embryos reaching blastocyst stage and follicular size
Expression levels of the five genes were analysed in em-bryos that reached blastocyst stage (eRB) regarding fol-licular size. For embryos developing to blastocyst and originating from large follicles,HAS2andPTGS2 expres-sions were significantly up-regulated in the associated CCs when compared to those originating from small folli-cles (p< 0.001;p= 0.036, respectively) (Table1).
CC gene expression, blastocyst quality and follicular size For embryos becoming TQ or GQ blastocysts and
ori-ginating from large follicles, PTGS2 expression was
up-regulated in the associated CCs when compared to
small follicles (p = 0.002) (Table 1). However, a
signifi-cant up-regulation for PTGS2was also observed in CCs
of oocytes originating from large follicles and that devel-oped to BQ blastocysts or arrested embryos, when com-pared to small follicles (p = 0.003) (Table 1). Again, a
significant up-regulation for PTGS2 was also observed
for CCs of eFRB embryos originating from large follicles when compared to small follicles (p= 0.010) (Table1).
CC gene expressions evaluated with patient-specific variables regarding eRB or TQ + GQ blastocysts
Generalized Linear Mixed Models (GLMMs) with logit link were conducted to analyse the factors correlating with the development to an eRB and to TQ + GQ blastocysts. In these models, which were separately done for the five selected genes, age, BMI, AMH and follicular size were
Table 1CC gene expression levels regarding follicular size and embryo development on day5
Concentrations TNFAIP6 PTGS2 HAS2 PTX3 GDF9
Mean (se) Mean (se) Mean (se) Mean (se) Mean (se)
Follicular size n 1195 1205 1212 1110 742
Small 0.629 (0.564) 0.281 (0.027) 0.631 (0.287) 0.011 (0.004) 1.075 (0.297)
n 1061 1066 1072 975 648
Large 0.956 (0.784) 0.434 (0.047) 0.922 (0.350) 0.014 (0.003) 0.997 (0.255)
pa 0.204 < 0.001** 0.193 0.371 0.847
eRB n 472 478 482 439 295
Small 1.163 (1.065) 0.284 (0.027) 0.710 (0.339) 0.010 (0.003) 1.217 (0.533)
n 605 609 612 559 370
Large 0.790 (0.637) 0.399 (0.038) 0.811 (0.356) 0.013 (0.003) 0.966 (0.347)
pa 0.451 < 0.001** 0.036* 0.344 0.701
eFRB n 723 727 730 671 447
Small 0.235 (0.245) 0.270 (0.031) 0.538 (0.254) 0.013 (0.006) 0.987 (0.356)
n 456 457 460 416 278
Large 1.376 (1.193) 0.480 (0.082) 1.172 (0.562) 0.016 (0.005) 1.047 (0.383)
pa 0.274 0.010* 0.249 0.266 0.911
TQ or GQ Blastocysts n 253 258 260 237 151
Small 0.726 (0.506) 0.275 (0.031) 0.514 (0.127) 0.011 (0.003) 0.415 (0.323)
n 349 353 354 325 212
Large 0.727 (0.506) 0.388 (0.040) 0.562 (0.126) 0.013 (0.005) 0.410 (0.211)
pa 0.562 0.002** 0.060 0.714 0.956
Arrested embryos or BQ Blastocysts n 942 947 952 873 591
Small 0.684 (0.631) 0.274 (0.030) 0.649 (0.345) 0.011 (0.004) 1.243 (0.361)
n 712 713 718 650 436
Large 0.978 (0.841) 0.445 (0.059) 1.001 (0.414) 0.013 (0.003) 1.282 (0.369)
pa 0.217 0.003** 0.323 0.466 0.942
Studied genes are: tumour necrosis factor alpha induced protein 6 (TNFAIP6), prostaglandin-endoperoxide synthase 2 (PTGS2), hyaluronan synthase 2 (HAS2), pentraxin-related protein 3 (PTX3) and growth differentiation factor 9 (GDF9)
eRBembryos reaching blastocyst,eFRBembryos failed to reach blastocyst,TQtop quality blastocyst,GQgood quality blastocyst,BQbad quality blastocyst
**
p< 0.01; *p<0.05
a
introduced as patient-specific variables and were simultan-eously analysed with each CC gene expression.
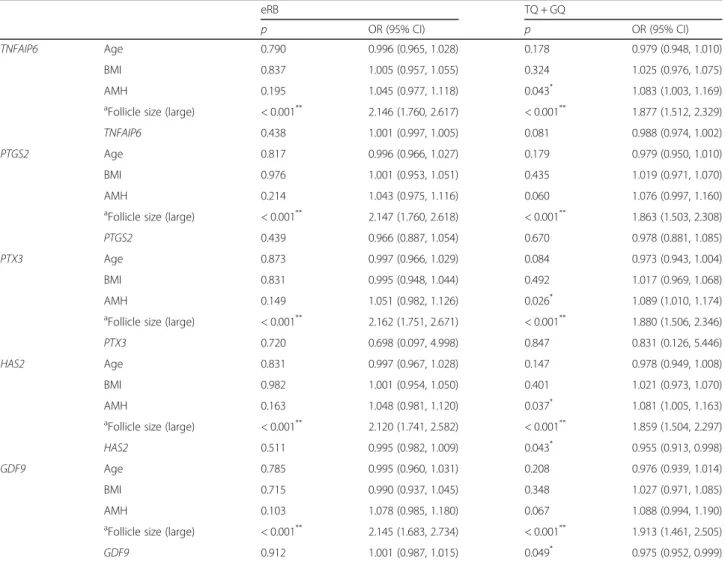
For the model analyzing the factors affecting the de-velopment to an eRB, CC expression levels ofTNFAIP6,
PTGS2, PTX3, HAS2 and GDF9 were not found to be significant (Table 2). The only variable correlating with eRB for each of these five models was the follicular size (p< 0.001) (Table2).
Generalized Linear Mixed Models (GLMMs) with logit link were also conducted to analyse the factors correlating with blastocyst quality (TQ + GQ). Follicular size was found to be significantly correlated with TQ + GQ in all of these five models (p< 0.001), whereas AMH was found to be a variable correlated with the potential of embryos be-coming TQ + GQ blastocysts in only three models out of five (TNFAIP6 (p = 0.043); PTX3 (p = 0.026) and HAS2 (p= 0.037)) (Table2). Blastocyst quality was significantly
associated with CC gene expression of HAS2 and GDF9
(p = 0.043; p = 0.049, respectively) but not with that of
TNFAIP6,PTGS2andPTX3(Table2).
Follicle size, CC gene expression and implantation Before starting our two-part study, we conducted a pilot study in order to calculate the minimum number of fer-tilized oocytes which would be sufficient to detect a sig-nificant difference between follicle size and blastulation rates. The results revealed that top and good quality blastocyst rates for large and small follicles were 45 and 32%, respectively. A power analysis indicated that, for an alpha level of 0.05 and a beta level of 0.20 (power = 0.80), 438 fertilized oocytes were sufficient to detect a significant difference between follicle size groups in terms of blastulation rate [1]. But, in spite of the large cohort, the number of resultant blastocysts with known
Table 2CC expression of the studied genes regarding clinical variables and development into eRBs and TQ + GQs
eRB TQ + GQ
p OR (95% CI) p OR (95% CI)
TNFAIP6 Age 0.790 0.996 (0.965, 1.028) 0.178 0.979 (0.948, 1.010)
BMI 0.837 1.005 (0.957, 1.055) 0.324 1.025 (0.976, 1.075)
AMH 0.195 1.045 (0.977, 1.118) 0.043* 1.083 (1.003, 1.169)
aFollicle size (large) < 0.001** 2.146 (1.760, 2.617) < 0.001** 1.877 (1.512, 2.329)
TNFAIP6 0.438 1.001 (0.997, 1.005) 0.081 0.988 (0.974, 1.002)
PTGS2 Age 0.817 0.996 (0.966, 1.027) 0.179 0.979 (0.950, 1.010)
BMI 0.976 1.001 (0.953, 1.051) 0.435 1.019 (0.971, 1.070)
AMH 0.214 1.043 (0.975, 1.116) 0.060 1.076 (0.997, 1.160)
aFollicle size (large) < 0.001** 2.147 (1.760, 2.618) < 0.001** 1.863 (1.503, 2.308)
PTGS2 0.439 0.966 (0.887, 1.054) 0.670 0.978 (0.881, 1.085)
PTX3 Age 0.873 0.997 (0.966, 1.029) 0.084 0.973 (0.943, 1.004)
BMI 0.831 0.995 (0.948, 1.044) 0.492 1.017 (0.969, 1.068)
AMH 0.149 1.051 (0.982, 1.126) 0.026* 1.089 (1.010, 1.174)
a
Follicle size (large) < 0.001** 2.162 (1.751, 2.671) < 0.001** 1.880 (1.506, 2.346)
PTX3 0.720 0.698 (0.097, 4.998) 0.847 0.831 (0.126, 5.446)
HAS2 Age 0.831 0.997 (0.967, 1.028) 0.147 0.978 (0.949, 1.008)
BMI 0.982 1.001 (0.954, 1.050) 0.401 1.021 (0.973, 1.070)
AMH 0.163 1.048 (0.981, 1.120) 0.037* 1.081 (1.005, 1.163)
aFollicle size (large) < 0.001** 2.120 (1.741, 2.582) < 0.001** 1.859 (1.504, 2.297)
HAS2 0.511 0.995 (0.982, 1.009) 0.043* 0.955 (0.913, 0.998)
GDF9 Age 0.785 0.995 (0.960, 1.031) 0.208 0.976 (0.939, 1.014)
BMI 0.715 0.990 (0.937, 1.045) 0.348 1.027 (0.971, 1.085)
AMH 0.103 1.078 (0.985, 1.180) 0.067 1.088 (0.994, 1.190)
aFollicle size (large) < 0.001** 2.145 (1.683, 2.734) < 0.001** 1.913 (1.461, 2.505)
GDF9 0.912 1.001 (0.987, 1.015) 0.049* 0.975 (0.952, 0.999)
(Studied genes are: tumour necrosis factor alpha induced protein 6 (TNFAIP6), prostaglandin-endoperoxide synthase 2 (PTGS2), hyaluronan synthase 2 (HAS2), pentraxin-related protein 3 (PTX3) and growth differentiation factor 9 (GDF9)). Embryos reaching blastocyst stage (eRB); top (TQ) or good quality (GQ) blastocysts
*
p< 0.05;**
p< 0.01
a
implantation data would probably not be sufficient to detect a significant correlation between follicular size, gene expression and implantation. However, recognizing that implantation rates are of interest, further separate GLMMs with logit link were conducted to analyse any cor-relation between gene expression levels, patient-specific variables (age, BMI, AMH and follicular size) and implant-ation. Results from these models indicated that neither patient-specific variables nor the five studied CC gene ex-pressions had a statistically significant correlation with im-plantation (p> 0.05). This supports our previous findings, published in an article of 2017 [1],where we discussed the results of the first part of this study into the morphokinetic development of embryos in relation to follicle diameter and homogeneity of follicular development. Although oo-cytes developing from large follicles were more than twice as likely to develop into an eRB than oocytes from small follicles, once the blastocyst stage was achieved, im-plantation rates were not significantly different be-tween embryos coming from large or small follicles (Additional file 1: Table S3).
Discussion
Morphological criteria which are currently used to de-scribe intra- and extra-cytoplasmic features of human oo-cytes are not sufficient to accurately and non-invasively predict developmentally competent oocytes [47]. Defined gene expression signatures of oocyte competence acquired during maturation by the surrounding somatic cells would be valuable in predicting the developmental potential of oocytes. The developmental competence of oocytes is in-deed acquired progressively during folliculogenesis and is well-known to rely on the bidirectional communication between oocyte and CCs, which deliver nutrients and regulatory molecular signals to promote both oocyte nu-clear and cytoplasmic maturation. Our study investigates if there is any association between putative oocyte compe-tence markers in CCs and the developmental compecompe-tence of oocytes as evaluated by the quality of blastocysts.
Cumulus expansion in vivo is induced by the preovulatory LH surge and requires expression of transcripts encoding hyaluronan synthase 2 (HAS2), prostaglandin-endoperoxide synthase 2 (PTGS2), pentraxin-related protein 3 (PTX3) and tumour necrosis factor alpha induced protein 6 (TNFAIP6) [48]. During maturation, oocyte secretory factors (GDF9 andBMP15) act upon CCs and up-regulate mRNA expres-sions of the above-mentioned cumulus expansion enabling factors [49].
Nivet and colleagues [24], evaluated the relationship between the embryonic outcome of oocytes, follicle vol-ume and transcriptomic signature and concluded that transcriptional characteristics of follicles varied accord-ing to their size and that size should be considered to better discriminate between follicles containing oocytes
with high developmental competence. In the present study reporting a series of 2495 COCs punctured from 184 young and good prognosis patients, follicular size significantly correlated with the potential of an oocyte to develop into blastocyst: oocytes developing from large follicles were more than twice as likely to develop into an eRB than oocytes from small follicles (p< 0.001).
When expression levels of genes were evaluated ac-cording to follicular size only, PTGS2 was significantly up-regulated in large follicles whereas no such signifi-cant difference in gene expression was observed in
TNFAIP6, HAS2, PTX3 and GDF9 (Table 1, Follicular size). Again, when evaluating gene expression levels while taking follicular size into account, significant
dif-ferences were found only in PTGS2 and HAS2 in
em-bryos originating from large follicles and reaching to blastocyst stage (Table1, eRB). OnlyPTGS2was signifi-cantly up-regulated in top or good quality blastocysts originating from oocytes coming from large follicles
(Table 1, TQ or GQ Blastocysts). However,PTGS2 was
also upregulated in embryos failing to reach blastocyst, bad quality blastocysts and arrested embryos (Table1).
Thus, PTGS2 expression in CCs correlated
signifi-cantly with follicular size being up regulated in large fol-licles regardless of whether embryos arrested or were slow growing or whether blastocyst stage was reached or not and whether blastocysts were poor, good or top quality. These findings seem to indicate that differences of gene expression of PTGS2 were related to follicular size rather than to embryo quality. This demonstrates that up-regulation of PTGS2 in large follicles does not necessarily indicate oocyte competence.
In a study by Ekart and colleagues [19], in which a group of 25 women below the age of 38 underwent an rFSH-stimulated ICSI treatment, a total of 270 COCs were analysed. The authors found that 99.7% of COC re-trieved within each woman involved in their study were significantly different from each other regarding CC
mRNA levels of eight candidate genes (HAS2, FSHR,
SLC2A4, ALCAM, SFRP2, VCAN, NRP1andPR) and cell composition [19]. The authors associate this heterogen-eity either with an artefact during the mechanical isola-tion and enzymatic dissecisola-tion process or to variaisola-tions in granulosa cell numbers in developing follicles. Our study may indicate that this heterogeneity could also be related to size discrepancies within a follicular cohort stimulated exogenously by gonadotropins.
Two genes, HAS2 and GDF9, showed significantly
higher expression in CCs from oocytes that progressed to TQ or GQ blastocysts. Our results support a
relation-ship between HAS2 and GDF9 expression in CCs and
the developmental competence of oocytes. According to
the GLMMs with logit link, one unit increase in HAS2
blastocyst by 8.7%. Similarly, one unit increase inGDF9 decreased the probability of obtaining a TQ + GQ blasto-cyst by 2.5%. No such correlation was found in other gene expressions studied. However, once again this cor-relation was seen only when the genes were evaluated together with follicular size and the patient specific vari-ables of age, BMI and AMH. Although gene expression
of HAS2 and GDF9 correlated with blastocyst quality,
the only variable correlating with eRB and TQ and GQ blastocysts for each of the five GLMM models was fol-licular size. Furthermore, the correlation was stronger. These findings support the clinical implications of the first part of our study [1] that follicle size is a strong in-dicator of the likelihood of an embryo proceeding to blastocyst.
As the nuclear and cytoplasmic competence are ac-quired during follicular growth, which requires the bidir-ectional cross-talk between the oocyte itself and CCs, CC gene expression of essential genes can be expected to be altered. Thus, it can be speculated that follicular size is fundamental when analysing CC expression data and that markers of oocyte competence based on CC studies have to include follicular size to be rigorously accurate.
The complexity related to modifiers of gene expression is illustrated in the recent literature [32]. In a random-ized study, Cruz and colleagues (2017) showed that the type of gonadotropin used during controlled ovarian stimulation (follicle-stimulating hormone (FSH), urinary FSH, or human menopausal gonadotropin (hMG)) in-duce differential gene expression in human CCs [50].
Moreover, PTGS2 was shown to be down-regulated in
CCs of infertile women with endometriosis [51]. Patient age affects differential mRNA gene expression in CCs [52–54]. Patient BMI is also a modifier of CC gene ex-pression in both polycystic ovarian syndrome (PCOS)
[44] and non-PCOS women [54]. CC gene expression
from different patients were studied, and it is known that factors such as different stimulation protocols, pa-tient characteristics and transfer techniques may impact either CC gene expression or implantation [44,50–56].
Therefore, in our study, patients were selected with in-clusion criteria as similar as was possible in a clinical context. Although some minor variations (e.g. BMI) were unavoidable, bias in the participants selection was minimized by including only antagonist cycles in the study, by administering GnRH antagonist when the size of the follicle was at least 12 mm, but never exceeding 13 mm. Although there was some variation in the FSH
dose (150–225 IU) depending on BMI, cases with more
extreme dosages were not included. Furthermore, PCOS patients with an abnormally high number of COCs were excluded [44], because abnormal gene expression pro-files in human ovaries from polycystic ovary syndrome
patients have been described in the literature [57]. Fi-nally, severe male infertility cases, where sperm might have played a critical role, were excluded.
Thus, this study was conducted using a homogeneous group of young and good prognosis patients and general-ized linear mixed models (GLMMs) were applied in order to correct the expression data of each oocyte regarding the clinical characteristics of each patient included in the study. Hence, unlike a more basic statistical evaluation in which each oocyte is considered to be independent, this paired analysis corrected for the follicular cohort effect, giving more reliable results.
A correlation was found in this study between blastocyst
quality and CC gene expressions of HAS2 and GDF9 by
GLMM analyses. Increased levels ofGDF9andBMP15
ex-pression have both been associated with positive pregnancy as well as with mature oocytes, fertilization rate and embryo quality [43]. Analyzing GDF9 and BMP15 expression by qRT-PCR, Li and colleagues [32] utilized one of the largest samples sizes to date, using 2426 CC masses from 196
pa-tients. Furthermore, HAS2 is considered to be a human
pregnancy or live birth candidate biomarker with conflicting differential mRNA expression by qRT-PCR [2,19,31,32].
Finally, to answer the questions asked when beginning
the study; although gene expression of HAS2andGDF9
correlated with blastocyst quality when separately evalu-ated with follicular size and the patient specific variables of age, BMI and AMH, the only variable correlating with eRB and TQ and GQ blastocysts for each of these five models was follicular size. Furthermore, the correlation was stronger.
Conclusions
In conclusion, follicular size correlated significantly with blastocyst quality and viability. Embryos coming from large follicles were almost twice as likely as those coming from small follicles to develop into TQ + GQ blastocysts suitable for transfer or freezing. There was also a correlation be-tween blastocyst quality and CC gene expressions ofHAS2 andGDF9, but only when evaluated together with follicular size, age, BMI and AMH, no such correlation was found in the case of other gene expressions studied. The only vari-able correlating with eRB and TQ and GQ blastocysts for each of the five models including the expression levels of the five genes studied was follicular size. Our findings sug-gest that differences in gene expression could be related to follicular size rather than to embryo quality.
Additional file
Abbreviations
BMI:Body Mass Index; BQ: Bad Quality blastocyst; CCs: Cumulus Cells; COC: Cumulus Oocyte Complex; eFRB: embryos Failed to Reach Blastocyst; eRB: embryos Reaching Blastocyst;GDF9: Growth Differentiation Factor 9; GLMMs: Generalized linear mixed models; GQ: Good quality blastocyst;
HAS2: Hyaluronan Synthase 2; MII: Metaphase II oocyte; OPU: Oocyte Pick-Up;
PTGS2: Prostaglandin-Endoperoxide Synthase 2;PTX3: Pentraxin-related protein 3;TNFAIP6: Tumour Necrosis Factor Alpha Induced Protein 6; TQ: Top quality blastocyst
Funding
The study was supported by the Grant for Fertility Innovation (GFI 2014) provided by Merck KGaA, Darmstadt, Germany. The funding body had no role either in the design of the study and collection, analysis, and interpretation of data or in writing the manuscript.
Availability of data and materials
The data that support the findings of this study are available from Merck KGaA, Darmstadt, Germany (Grant for Fertility Innovation) but restrictions apply to the availability of these data, which were used under license for the current study, and so are not publicly available. Data are however available from the authors upon reasonable request and with permission of Merck KGaA, Darmstadt, Germany (Grant for Fertility Innovation).
Authors’contributions
CPC and MC made substantial contributions to conception and design, analysis and interpretation of data and have been involved in drafting the manuscript and revising it critically for important intellectual content; MA and CGE made substantial contributions to conception and design, analysis and acquisition of data; SK and MM made substantial contributions to conception and design and have been involved in drafting the manuscript and revising it critically for important intellectual content; SK has given final approval of the version to be published. All authors read and approved the final manuscript.
Ethics approval and consent to participate
All procedures performed in this study and involving human participants were in accordance with the ethical standards of the institutional research committee and with the 1964 Helsinki declaration and its later amendments or comparable ethical standards. This prospective cohort study was registered atclinicaltrials.gov(NCT02230449) and obtained an ethical approval from the institutional review board (23/06/2014–19). All patients gave their informed consent prior to their inclusion in the study.
Consent for publication Not applicable.
Competing interests
SK has received a research grant from the Grant for Fertility Innovation (GFI 2014) provided by Merck KGaA, Darmstadt, Germany. MM has received consultancy fees from Vitrolife AB Sweden. CPC, MC, MA and CGE declare that they have no conflict of interest.
Publisher’s Note
Springer Nature remains neutral with regard to jurisdictional claims in published maps and institutional affiliations.
Author details
1Istanbul Memorial Hospital, Assisted Reproductive Technologies and
Reproductive Genetics Centre, Piyale Pasa Bulvari 34385 Okmeydani Sisli, Istanbul, Turkey.2ilabcomm GmbH, Eisenachstr. 34, 53757 Sankt Augustin, Germany.
Received: 2 March 2018 Accepted: 10 July 2018
References
1. Kahraman S, Cetinkaya CP, Cetinkaya M, Yelke H, Colakoglu YK, Aygun M, et al. The effect of follicle size and homogeneity of follicular development on the morphokinetics of human embryos. J Assist Reprod Genet. 2017;34(7):895–903.
2. McKenzie LJ, Pangas SA, Carson SA, Kovanci E, Cisneros P, Buster JE, et al. Human cumulus granulosa cell gene expression: a predictor of fertilization and embryo selection in women undergoing IVF. Hum Reprod. 2004;19(12): 2869–74.
3. Zhang X, Jafari N, Barnes RB, Confino E, Milad M, Kazer RR. Studies of gene expression in human cumulus cells indicate pentraxin 3 as a possible marker for oocyte quality. Fertil Steril. 2005;83(Suppl 1):1169–79. 4. Cillo F, Brevini TA, Antonini S, Paffoni A, Ragni G, Gandolfi F. Association
between human oocyte developmental competence and expression levels of some cumulus genes. Reproduction. 2007;134(5):645–50.
5. Lim H, Paria BC, Das SK, Dinchuk JE, Langenbach R, Trzaskos JM, et al. Multiple female reproductive failures in cyclooxygenase 2-deficient mice. Cell. 1997;91:197–208.
6. Calder MD, Caveney AN, Westhusin ME, Watson AJ. Cyclooxygenase-2 and prostaglandin E(2) (PGE(2)) receptor messenger RNAs are affected by bovine oocyte maturation time and cumulus-oocyte complex quality, and PGE(2) induces moderate expansion of the bovine cumulus in vitro. Biol Reprod. 2001;65:135–40.
7. Sirois J, Sayasith K, Brown KA, Stock AE, Bouchard N, Dore M.
Cyclooxygenase-2 and its role in ovulation: a 2004 account. Hum Reprod Update. 2004;10:373–85.
8. Takahashi T, Morrow JD, Wang H, Dey SK. Cyclooxygenase-2-derived prostaglandin E(2) directs oocyte maturation by differentially influencing multiple signaling pathways. J Biol Chem. 2006;281:37117–29. 9. Fulop C, Kamath RV, Li Y, Otto JM, Salustri A, Olsen BR, et al. Coding
sequence, exon-intron structure and chromosomal localization of murine TNF-stimulated gene 6 that is specifically expressed by expanding cumulus cell-oocyte complexes. Gene. 1997;202(1–2):95–102.
10. Yoshioka S, Ochsner S, Russell DL, Ujioka T, Fujii S, Richards JS, et al. Expression of tumor necrosis factor-stimulated gene-6 in the rat ovary in response to an ovulatory dose of gonadotropin. Endocrinology. 2000; 141(11):4114–9.
11. Trombly DJ, Woodruff TK, Mayo KE. Roles for transforming growth factor beta superfamily proteins in early folliculogenesis. Semin Reprod Med. 2009;27:14–23. 12. Kedem A, Fisch B, Garor R, Ben-Zaken A, Gizunterman T, Felz C, et al.
Growth differentiating factor 9 (GDF9) and bone morphogenetic protein 15 both activate development of human primordial follicles in vitro, with seemingly more beneficial effects ofGDF9. J Clin Endocrinol Metab. 2011; 96(8):E1246–54.
13. Paulini F, Melo EO. The role of oocyte-secreted factorsGDF9and BMP15 in follicular development and oogenesis. Reprod Domest Anim. 2011;46:354–61. 14. Albertini DF, Combelles CM, Benecchi E, Carabatsos MJ. Cellular basis for
paracrine regulation of ovarian follicle development. Reproduction. 2001; 121(5):647–53.
15. Hutt KJ, Albertini DF. An oocentric view of folliculogenesis and embryogenesis. Reprod BioMed Online. 2007;14(6):758–64.
16. Assou S, Haouzi D, Mahmoud K, Aouacheria A, Guillemin Y, Pantesco V, et al. A non-invasive test for assessing embryo potential by gene expression profiles of human cumulus cells: a proof of concept study. Mol Hum Reprod. 2008;14(12):711–9.
17. Assou S, Boumela I, Haouzi D, Anahory T, Dechaud H, De Vos J, et al. Dynamic changes in gene expression during human early embryo development: from fundamental aspects to clinical applications. Hum Reprod Update. 2011;17(2):272–90.
18. Assou S, Haouzi D, Dechaud H, Gala A, Ferrieres A, Hamamah S. Comparative gene expression profiling in human cumulus cells according to ovarian gonadotropin treatments. Biomed Res Int. 2013;2013:354582. 19. Ekart J, McNatty K, Hutton J, Pitman J. Ranking and selection of MII oocytes
in human ICSI cycles using gene expression levels from associated cumulus cells. Hum Reprod. 2013;28(11):2930–42.
20. Li Y, Li RQ, Ou SB, Ren L, Zhang NF, Wei LN, et al. Association between the proportion of dominant follicles and oocyte developmental competence. J Assist Reprod Genet. 2014;31(12):1599–604.
21. Li SH, Lin MH, Hwu YM, Lu CH, Yeh LY, Chen YJ, et al. Correlation of cumulus gene expression of GJA1, PRSS35,PTX3, and SERPINE2 with oocyte maturation, fertilization, and embryo development. Reprod Biol Endocrinol. 2015;13:93.
23. Dumesic DA, Meldrum DR, Katz-Jaffe MG, Krisher RL, Schoolcraft WB. Oocyte environment: follicular fluid and cumulus cells are critical for oocyte health. Fertil Steril. 2015;103(2):303–16.
24. Nivet AL, Léveillé MC, Leader A, Sirard MA. Transcriptional characteristics of different sized follicles in relation to embryo transferability: potential role of hepatocyte growth factor signalling. Mol Hum Reprod. 2016;22(7):475–84. 25. Arnot AM, Vandekerckhove P, DeBono MA, Rutherford AJ. Follicular volume
and number during in-vitro fertilization: association with oocyte
developmental capacity and pregnancy rate. Hum Reprod. 1995;10(2):256–61. 26. Salha O, Nugent D, Dada T, Kaufmann S, Levett S, Jenner L, et al. The
relationship between follicular fluid aspirate volume and oocyte maturity in in-vitro fertilization cycles. Hum Reprod. 1998;13(7):1901–6.
27. Farhi J, Orvieto R, Gavish O, Homburg R. The association between follicular size on human chorionic gonadotropin day and pregnancy rate in clomiphene citrate treated polycystic ovary syndrome patients. Gynecol Endocrinol. 2010;26(7):546–8.
28. Matzuk MM, Lamb DJ. The biology of infertility: research advances and clinical challenges. Nat Med. 2008;14(11):1197–213.
29. Chang HM, Qiao J, Leung PC. Oocyte-somatic cell interactions in the human ovary-novel role of bone morphogenetic proteins and growth
differentiation factors. Hum Reprod Update. 2016;23(1):1–18. 30. Patino LC, Beau I, Carlosama C, Buitrago JC, Gonzalez R, Suarez CF, et al.
New mutations in non-syndromic primary ovarian insufficiency patients identified via whole-exome sequencing. Hum Reprod. 2017;32(7):1512–20. 31. Gebhardt KM, Feil DK, Dunning KR, Lane M, Russell DL. Human cumulus cell
gene expression as a biomarker of pregnancy outcome after single embryo transfer. Fertil Steril. 2011;96(1):47–52.e2.
32. Kordus RJ, LaVoie HA. Granulosa cell biomarkers to predict pregnancy in ART: pieces to solve the puzzle. Reproduction. 2017;153(2):R69–83. 33. Duffy DM, Dozier BL, Seachord CL. Prostaglandin dehydrogenase and
prostaglandin levels in periovulatory follicles: implications for control of primate ovulation by prostaglandin E2. J Clin Endocrinol Metab. 2005;90:1021–7. 34. Russell DL, Salustri A. Extracellular matrix of the cumulus-oocyte complex.
Semin Reprod Med. 2006;24:217–27.
35. Salustri A, Garlanda C, Hirsch E, De Acetis M, Maccagno A, Bottazzi B, et al. PTX3 plays a key role in the organization of the cumulus oophorus extracellular matrix and in in vivo fertilization. Development. 2004;131:1577–86. 36. Varani S, Elvin JA, Yan C, DeMayo J, DeMayo FJ, Horton HF, et al. Knockout
of pentraxin 3, a downstream target of growth differentiation factor-9, causes female subfertility. Mol Endocrinol. 2002;16:1154–67. 37. Feuerstein P, Puard V, Chevalier C, Teusan R, Cadoret V, Guerif F, et al.
Genomic assessment of human cumulus cell marker genes as predictors of oocyte developmental competence: impact of various experimental factors. PLoS One. 2012;7(7):e40449.
38. Fulop C, Szanto S, Mukhopadhyay D, Bardos T, Kamath RV, Rugg MS, et al. Impaired cumulus mucification and female sterility in tumor necrosis factor-induced protein-6 deficient mice. Development. 2003;130:2253–61. 39. Hamel M, Dufort I, Robert C, Gravel C, Leveille MC, Leader A, et al.
Identification of differentially expressed markers in human follicular cells associated with competent oocytes. Hum Reprod. 2008;23(5):1118–27. 40. Silva JR, van den Hurk R, van Tol HT, Roelen BA, Figueiredo JR. Expression of
growth differentiation factor 9 (GDF9), bone morphogenetic protein 15 (BMP15), and BMP receptors in the ovaries of goats. Mol Reprod Dev. 2005;70:11–9. 41. Zhao SY, Qiao J, Chen YJ, Liu P, Li J, Yan J. Expression of growth
differentiation factor-9 and bone morphogenetic protein-15 in oocytes and cumulus granulosa cells of patients with polycystic ovary syndrome. Fertil Steril. 2010;94:261–7.
42. Hosoe M, Kaneyama K, Ushizawa K, Hayashi KG, Takahashi T. Quantitative analysis of bone morphogenetic protein 15 (BMP15) and growth differentiation factor 9 (GDF9) gene expression in calf and adult bovine ovaries. Reprod Biol Endocrinol. 2011;9:33.
43. Li Y, Li RQ, Ou SB, Zhang NF, Ren L, Wei LN, et al. Increased GDF9 and BMP15 mRNA levels in cumulus granulosa cells correlate with oocyte maturation, fertilization, and embryo quality in humans. Reprod Biol Endocrinol. 2014;12:81.
44. Kenigsberg S, Bentov Y, Chalifa-Caspi V, Potashnik G, Ofir R, Birk OS. Gene expression microarray profiles of cumulus cells in lean and overweight-obese polycystic ovary syndrome patients. Mol Hum Reprod. 2009;15(2):89–103. 45. Cetinkaya M, Pirkevi C, Yelke H, Colakoglu YK, Atayurt Z, Kahraman S.
Relative kinetic expressions defining cleavage synchronicity are better
predictors of blastocyst formation and quality than absolute time points. J Assist Reprod Genet. 2015;32(1):27–35.
46. Schmittgen TD, Livak KJ. Analyzing real-time PCR data by the comparative C(T) method. Nat Protoc. 2008;3(6):1101–8.
47. Rienzi L, Vajta G, Ubaldi F. Predictive value of oocyte morphology in human IVF: a systematic review of the literature. Hum Reprod Update. 2011;17(1):34–45. 48. Trounson A, Gosden R, Eichenlaub-Ritter U. Biology and pathology of the
oocyte: role in fertility, medicine, and nuclear reprogramming. 2nd ed: Cambridge University Press; 2013.
49. Buccione R, Schroeder AC, Eppig JJ. Interactions between somatic cells and germ cells throughout mammalian oogenesis. Biol Reprod. 1990;43:543–7. 50. Cruz M, Requena A, Agudo D, García-Velasco JA. Type of gonadotropin
used during controlled ovarian stimulation induces differential gene expression in human cumulus cells: a randomized study. Eur J Obstet Gynecol Reprod Biol. 2017;215:124–33.
51. da Luz CM, da Broi MG, Donabela FC, Paro de Paz CC, Meola J, Navarro PA.
PTGS2down-regulation in cumulus cells of infertile women with endometriosis. Reprod BioMed Online. 2017;35(4):379–86. 52. McReynolds S, Dzieciatkowska M, McCallie BR, Mitchell SD, Stevens J,
Hansen K, et al. Impact of maternal aging on the molecular signature of human cumulus cells. Fertil Steril. 2012;98(6):1574–80.e5.
53. Al-Edani T, Assou S, Ferrieres A, Bringer Deutsch S, Gala A, Lecellier CH, et al. Female aging alters expression of human cumulus cells genes that are essential for oocyte quality. Biomed Res Int. 2014;2014:964614.
54. Kedem A, Yung Y, Yerushalmi GM, Haas J, Maman E, Hanochi M, et al. Anti Müllerian hormone (AMH) level and expression in mural and cumulus cells in relation to age. J Ovarian Res. 2014;7:113.
55. Robker RL, Akison LK, Bennett BD, Thrupp PN, Chura LR, Russell DL, et al. Obese women exhibit differences in ovarian metabolites, hormones, and gene expression compared with moderate-weight women. J Clin Endocrinol Metab. 2009;94(5):1533–40.
56. Kava-Braverman A, Martínez F, Rodríguez I, Álvarez M, Barri PN, Coroleu B. What is a difficult transfer? Analysis of 7,714 embryo transfers: the impact of maneuvers during embryo transfers on pregnancy rate and a proposal of objective assessment. Fertil Steril. 2017;107(3):657–663.e1.