R E S E A R C H
Open Access
Baseline insulin sensitivity affects response
to high-amylose maize resistant starch in
women: a randomized, controlled trial
Barbara A. Gower
1*, Richard Bergman
2, Darko Stefanovski
3, Betty Darnell
4, Fernando Ovalle
5, Gordon Fisher
6,
S. Katherine Sweatt
7, Holly S. Resuehr
7and Christine Pelkman
8Abstract
Background:Resistant starch (RS) is a type of dietary fiber that can improve glucose metabolism, but its effects may be modulated by sex or baseline insulin sensitivity. This study was designed to examine the effect of high-amylose maize resistant starch (HAM-RS2) on insulin sensitivity (SI) in women, and to determine if SIstatus affects the response
to RS.
Methods:This was a randomized, placebo-controlled, double-blind, cross-over study. Participants were 40 healthy, non-diabetic women aged 22–67 years in the normal-weight to obese BMI range (20.6–47.4 kg/m2). Two doses of HAM-RS2 were tested, 15 and 30 g per day, administered in the form of cookies. Participants were randomized to the order in which they received the experimental and placebo product. Each arm was 4 weeks, with a 4-week wash-out period in between. SIwas assessed at the end of each 4-week arm of product consumption by frequently-sampled,
insulin-modified, intravenous glucose tolerance test and minimal modeling. Participants were categorized as being insulin resistant (IR; SI< 7.8) or insulin sensitive (IS; SI≥7.8) based on Gaussian analysis. The effect of treatment arm on
SIwas examined by mixed-model analysis within IR and IS sub-groups, using all available data. In addition, SIwas
examined by ANOVA among just those women who completed all three arms of the study with valid SIresults. Results:Among IR participants, SIwas on average ~16 % higher after the 30 g arm when compared to the control
arm by mixed-model analysis (n= 40,P< 0.05), and tended to be 23 % higher by ANOVA among women who completed all arms (n= 23,P= 0.06). HAM-RS2 did not affect SIin IS women.
Conclusion:Consumption of HAM-RS2 at 30 g/day in the form of a snack food item was associated with improved insulin sensitivity in women with insulin resistance.
Clinical trials registry number:NCT01521806.
Keywords:Minimal model, Intravenous glucose tolerance test
Background
Resistant starch (RS) is a type of dietary fiber that has beneficial effects on insulin sensitivity and gastrointes-tinal health in humans [1]. By definition, RS is a type of carbohydrate that is incompletely digested by human pancreatic amylases. As a result, the starch molecules are cleaved in the colon by bacterial enzymes and
subsequently metabolized as fuel by the gut microbiota. Four types of RS have been identified. Type 2, which is found in some starchy foods such as green bananas, potatoes, and high-amylose corn, has been investigated most extensively for its effects on human health.
It is thought that the insulin-sensitizing effects of RS are due in part to the short-chain fatty acids that result from bacterial metabolism of the carbohydrate mole-cules [2]. Administration of exogenous short-chain fatty acids results in suppression of circulating free fatty acids by limiting lipolysis [3]. Because elevated fatty acids are associated with both suppression of insulin-stimulated
* Correspondence:[email protected]
1Department of Nutrition Sciences, University of Alabama at Birmingham
(UAB), 616A Webb Building, 1675 University Blvd, Birmingham, AL 35294, USA
Full list of author information is available at the end of the article
glucose uptake at skeletal muscle [4] and inhibition of insulin suppression of glycogenolysis at the liver [5], their reduction may improve insulin sensitivity. It is also possible that RS increases adiponectin, an adipocyte-derived hormone with insulin sensitizing properties. In mice, RS increases adipose tissue adiponectin concentra-tions [6], and in humans, greater intake of cereal fiber is associated with greater circulating adiponectin [7, 8].
Clinical studies documenting effects of RS on insulin sensitivity have generally yielded positive results. Acute consumption of 60 g RS over 24 h resulted in 69 % higher insulin sensitivity by mixed-meal tolerance test in a group of 10 healthy men and women [9]. Consumption of type 2 RS for 4 weeks at a dose of 30 g/day was asso-ciated with a 33 % increase in insulin sensitivity as assessed with mixed-meal tolerance test, and a 14 % in-crease as assessed by euglycemic clamp in a group of 10 healthy men and women [10]. Consumption of 40 g/d RS led to a 16 % increase in insulin sensitivity by eugly-cemic clamp in a group of 20 insulin resistant men and women [11]. Consumption of both 15 and 30 g/d RS for 4 weeks was associated with increased insulin sensitivity (48 and 53 %, increase in mean values, respectively) as assessed with intravenous glucose tolerance test in a group of 11 overweight/obese men [12]. However, in the same study, no effect was observed in a group of 22 women, leading to a significant treatment-by-sex effect (P< 0.05). Although the explanation for this sex differ-ence was not known, it was speculated that failure to control for menstrual cycle phase, or higher insulin sen-sitivity in women vs men [13, 14], may have played a role.
This study was designed to examine the effect of high-amylose maize resistant starch (HAM-RS2) administered as a snack food on insulin sensitivity (SI) in women,
con-trolling for menstrual cycle phase, and to determine if SI
status (high vs low) affects the response to RS.
Methods
Participants were healthy, sedentary women. Exclusion criteria included type 1 or type 2 diabetes, polycystic ovary syndrome, disorders of glucose or lipid metabol-ism, hypertension, use of medication that could affect glucose metabolism (including non-approved oral con-traceptives and postmenopausal hormone replacement therapy), use of tobacco, alcohol consumption in excess of 400 grams per week, engagement in more than 2 h intentional moderate or light exercise per week, and a medical history that counter-indicated inclusion in the study. Women were categorized as premenopausal if they experienced regular menstrual cycles, and postmen-opausal if they were over age 50 and had not had a cycle in the past 12 months. One woman aged 53 reported irregular menstrual cycles; she was categorized as
peri-menopausal and coded with the preperi-menopausal group for statistical analyses. Premenopausal women were per-mitted to use tri-phasic, low-dose oral contraceptives. Because one goal of the study was to determine if base-line insulin sensitivity status affected the response to RS, an effort was made to recruit African-American women, who are more insulin resistant than Caucasian women, even when obesity status and fat distribution are accounted for [15, 16]. Thus, including both African-American and Caucasian women would increase the likelihood of having a wide range of values for insulin sensitivity. Participants were informed of the experimen-tal design, and oral and written consent were obtained. The study was approved by the Institutional Review Board for Human Use at the University of Alabama at Birmingham (UAB).
The study was conducted using a randomized, placebo-controlled, double-blind cross-over design. Two doses of resistant starch were tested, 15 and 30 g per day, administered in the form of crackers, and van-illa- and lemon-flavored cookies. Within the first two months of the trial, subjects indicated a dislike for the crackers, and the study continued with cookies only. The resistant starch was a type 2, granular, form from high-amylose maize (HAM-RS2). A control snack was formulated with a highly digestible waxy corn starch to match the amount of digestible starch provided by the HAM-RS2 in the 15 g snack (~11.6 g/d). The cookies were tested to verify macronutrient, fiber, and RS con-tent (Table 1). Each arm was 4 weeks, with a 4-week wash-out period between. Test products were adminis-tered in random order. For all arms, participants were asked to consume two servings of test product per day (28–47 g per serving, depending upon the snack type and starch dose). Participants reported to the clinic weekly where they were weighed, met with the dietitian, and picked up product. If they missed a pickup, they were queried regarding their product use during the interim. If participants missed more than 2 days of product use, they either started over with that particu-lar arm, or were removed from the study. Habitual diet was monitored via 4-day food records obtained at base-line and during each of the three test phases, analyzed with Nutrition Data Systems for Research (NDSR 2012). For premenopausal women, testing was con-ducted in the first 10 days of the follicular phase of the menstrual cycle. Anthropometrics were collected at baseline and after each arm. Height and weight were assessed using an electronic scale and a wall-mounted stadiometer. Waist circumference was measured around the narrowest portion of the torso with a flex-ible tape.
(IVGTT) and Minimal Model analyses [17–19]. Testing was conducted in the Clinical Research Unit of UAB’s Center for Clinical and Translational Science (CCTS) after an overnight fast. Prior to testing, flexible intraven-ous catheters were placed in the antecubital spaces of both arms. Three, 2.0 ml blood samples were taken over a 20-min period for determination of basal glucose and insulin (the average of the values was used for basal
“fasting” concentrations). At time “0”, glucose (50 % dextrose; 300 mg/kg) was administered intravenously over 2 min. Insulin (0.02 U/kg, Humulin, Eli Lilly and Co., Indianapolis) was infused from 20 to 25 min post glucose injection. Blood samples (2.0 ml) were then col-lected at the following times (min) relative to glucose administration: 2, 3, 4, 5, 6, 8, 10, 12, 15, 19, 20, 21, 22, 24, 26, 28, 30, 35, 40, 45, 50, 55, 60, 70, 80, 100, 120, 140, 180, 210, 240.
Sera were stored at -85 °C until analyzed. Glucose and insulin values were entered into the MINMOD com-puter program (Millennium version, © Richard N.
Bergman [19]) for determination of the insulin sensitiv-ity index (SI). The acute insulin response to glucose
(AIRg) was calculated by the software as the incremental insulin area-under-the-curve from minutes 0–10 follow-ing glucose injection usfollow-ing the trapezoidal method. Disposition Index (DI) was calculated as SI x AIRg, a
composite measure of insulin secretion and insulin sensitivity. Glucose effectiveness (SG) also was generated
by the model; SG describes the extent to which glucose
uptake is stimulated, and glucose production inhibited, by glucose itself, independent of a dynamic change in insulin.
Laboratory analyses were conducted in the Core Laboratory of the CRU, Nutrition Obesity Research Center, and Diabetes Research Center. Glucose, total cholesterol, HDL-cholesterol, and triglycerides were measured using a SIRRUS analyzer (Stanbio Laboratory, Boerne, TX). Insulin was assayed by immunofluores-cence on a TOSOH AIA-II analyzer (TOSOH Corp., South San Francisco, CA); intra-assay CV of 1.5 % and inter-assay CV of 4.4 %. Adiponectin was assessed by radioimmunoassay (Linco-Millipore; Billerica, MA); inter-assay CV was 9.98 %; intra-assay CV was 4.70 %; and sensitivity (90 % bound) was 1.0μg/ml.
IR women were identified using histogram analysis of SIvalues from all valid tests, and univariate normal
mix-ture decomposition analysis. Two subgroups were noted, with the majority of observations belonging to a distri-bution with a mean of 4.1 and a SD of 1.9. A cut-point for IR was established at 7.8 based on the estimated SD for this group, which was two standard deviations from the observed mean (upper limit on the 95 % confidence interval, Fig. 1). Thus, for subsequent analyses, partici-pants were categorized as being either IR (SI< 7.8) or
insulin sensitive (IS; SI≥7.8). Eight women in the group
who completed all three phases of the study had at least one SImeasure≥7.8.
Data were analyzed by mixed-effects modeling within each subgroup (IR/IS), with waist circumference and completer status as covariates, subject ID as a group variable, and both test doses of RS contrasted against the placebo treatment. The mixed model considers all data, and thus allowed for inclusion of data from women who completed only one or two arms of the study. To confirm that the results obtained with the mixed model were valid within women who completed all three arms of the study, results also were analyzed by repeated-measures ANOVA and Student-Newman-Keuls pairwise comparisons within only those women who had valid SI
tests for all three arms (n= 23). Descriptive information was compared by ANOVA between IR and IS sub-groups using the Dose = 0 data. Ancillary, exploratory, analyses were conducted within sub-groups based on menopausal status and race/ethnicity. Due to small
Table 1Ingredient list and composition of test cookiesa
Control 15 g RS 30 g RS
Ingredients (g/100 g)
All-purpose flour 24.8 16.5 0.8
Wheat gluten 7.9 4.7 3.9
Sunflower oil 8.2 5.9 4.3
Salt 0.09 0.08 0.08
Sugar 13.3 13.4 12.9
Lemon extract 2.1 2.1 2.1
Whole eggs 10.3 10.5 10.7
Baking powder 0.4 0.4 0.4
Water 9.3 11 14.8
Dry milk 7.4 7.4 7.6
Waxy corn starchb
16.1 0 0
HAM-RS2c 0 27.7 42.2
Composition (post-baking)
Portion size (g) 28.4 36.7 46.3
Energy (kcal)d 126.9 129.6 138.2
Carbohydrate (g)d 18.5 19.2 20.8
Protein (g)d 4.7 4.6 5.0
Fat (g)d 3.8 3.8 3.9
Dietary fiber (g)d 0.5 7.8 14.8
Resistant starch (g)e 3.18 11.35 19.05
a
Cookies produced by International Food Network, Ithaca, NY. Data shown are for lemon-flavored cookies. Vanilla-flavored cookies were of similar formulation and composition (<3 % variation in composition between types of cookies; data not shown). Two servings of cookies were consumed per day
b
AMIOCA® corn starch, Ingredion Incorporated, Bridgewater, NJ
c
HI-MAIZE® 260 resistant starch, Ingredion Incorporated, Bridgewater, NJ
d
Composite analyses performed by Medallion Labs, Minneapolis, MN; Dietary fiber determined using AOAC method 991.43
e
sample sizes in these sub-groups, paired t-test was used to explore differences in SI among the three RS doses.
For all analyses,P< 0.05 was considered significant.
Results
Fifty-one women entered the study (Fig. 2), and 43 completed the first phase of the study, 40 of whom had a usable SI result. For mixed-model analysis, data from
these 40 women were used. The mean age of this sample at baseline was 48.3 ± 12.6 years; mean BMI was 29.8 ± 6.7 kg/m2. Eighteen women were pre- or peri-menopausal; 22 were postmenopausal. The ethnic composition was 24 non-Hispanic Caucasian, 14 African-American, and 2 Hispanic. Twelve women had at least one SImeasure >7.8;
all were Caucasian. Twenty-five women completed all three phases of the study; of these, 24 had usable SIresults.
Seven insulin sensitivity tests were not available for issues relating to iv access or scheduling. Reasons for discontinu-ing the study included difficulty with the time commit-ment, transportation problems, and unwillingness to consume the snacks as directed. Data from one woman were excluded due to IVGTT results indicating undiag-nosed diabetes. For ANOVA, data from the 23 non-diabetic women who completed all three phases of the study and had usable SIresults were used. The mean age
of this sample at baseline was 52.4 ± 12.0 year. Seven women were pre- or peri-menopausal; 14 were postmeno-pausal. The ethnic composition was 17 non-Hispanic Caucasian and 6 African-American. All IS women were Caucasian, and all African-American women were in the IR group. The IR group contained 4 pre-and 10
post-Fig. 1Gaussian distributions of insulin sensitivity values. Two groups [(insulin resistant (IR) and insulin sensitive (IS)] were identified based on the cut-point of 7.8
menopausal women. The IS group contained 3 pre- and 6 post-menopausal women.
Thirty-one women completed food records during at least one arm of the study, for a total of 68 records. Ana-lysis of diet data indicated that, on average, habitual diet did not change across the three arms of the study, and was not different between the IR and IS sub-groups for any treatment arm. Combined average intake of total energy was 1665 ± 496 kcal/day; %energy from carbohy-drates, protein, and fat was 45.7 ± 7.1, 16.4 ± 3.8, and 35.9 ± 5.0, respectively. Intake of dietary fiber (g/day; not including the experimental product) was not different across treatment arms. However, daily intake of total dietary fiber was significantly and consistently lower in the IR vs the IS women across the entire course of the study: Dose = 0 g/day (13.9 ± 4.1 vs 18.0 ± 4.4, P< 0.05); Dose = 15 g/day (14.0 ± 6.6 vs 21.3 ± 1.0, P< 0.05); and Dose = 30 g/day (13.4 ± 3.7 vs 19.0 ± 5.9,P< 0.01).
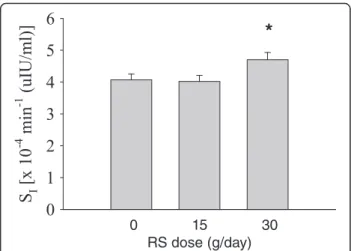
When considering the entire group of 40 women who completed at least one arm of the study, mixed model analysis among IR participants (n= 28) revealed a signifi-cant impact of the 30 g dose of RS (P< 0.05; Table 2, Fig. 3). Predicted values (Mean ± SEM) by dose were 0: 4.07 ± 0.18; 15: 4.02 ± 0.19; 30: 4.70 ± 0.23. No effect of either RS dose was observed among IS participants (n= 12). No carryover effects were detected.
Data from those women who completed all three arms of the study are shown in Table 3, by IR/IS status, at the end of each study arm. On average, IR women had higher concentrations of fasting glucose and insulin than IS women (at dose = 0). Waist circumference at dose = 0 (n= 18) averaged 99.2 ± 12.2 in the IR sub-group, and 90.7 ± 12.3 in the IS sub-group (P= 0.184). Body weight at dose = 0 was higher in the IR group (86.8 ± 16.6 kg) than in the IS group (67.0 ± 8.0 kg) (P< 0.01). BMI at dose = 0 was higher in the IR group (32.9 ± 7.3 kg/m2
) than in the IS group (25.6 ± 3.4 kg/m2) (P< 0.05).
ANOVA within the IR sub-group indicated a significant main effect (P< 0.05) of “Dose” on SI. Post-hoc
compari-son among doses indicated that the 30 g/day dose differed
from the 15 g/day dose (P< 0.05); the comparison of the 30 and 0 g doses approached significance (P= 0.068). No dose effect was observed within the IS sub-group. Further analyses indicated that the significant effect of RS was confined to the postmenopausal women (34 % higher after 30 g RS vs 0 g RS, P< 0.05). When secondary outcomes were examined within the IR sub-group, the Disposition Index (DI;P< 0.05) and AIRg (p= 0.056) were higher with the 30 g/day dose compared to the 15 g/day dose. No differences were observed within the IS sub-group.
Discussion
The primary finding from this study was that 30 g/d of RS in the form of a snack food led to greater insulin sen-sitivity among IR women, a group that included all of the African-American women in the study. These results extend observations from clinical studies involving sam-ples of healthy men and women combined, men and women with metabolic syndrome, and overweight/obese men, among whom beneficial effects of RS on insulin sensitivity have been detected. Importantly, results from this study may explain the significant treatment-by-sex interaction observed previously [12], where RS treatment increased insulin sensitivity in obese men but not women. Based on the present results, we tentatively con-clude that RS is most effective in insulin resistant populations.
One of the major findings of the study was that an effect of baseline insulin sensitivity was detected, such that RS treatment improved insulin sensitivity among IR but not IS women. The IR group included all of the African-American women enrolled in the study. In contrast, the IS group was exclusively Caucasian. African-Americans are at disproportionate risk for type 2 diabetes, and we have previously reported that SIis lower in African-Americans
Fig. 3Insulin sensitivity (SI; mean ± SEM) by dose at the end of each
4-week arm within insulin resistant women (n= 28). *Dose = 30 g/ day differed from Dose = 0 g/day (P< 0.05) by mixed-model analysis. Means ± SEM were 0: 4.07 ± 0.18; 15: 4.02 ± 0.19; 30: 4.70 ± 0.23
Table 2Mixed-effects model for the dependent variable SIa
within all IR women in the study (SI< 7.8;n= 28)
Coefficient SEM P 95 % CI
15 g/d 0.31 0.36 0.38 -0.39–1.01
30 g/d 0.87 0.38 0.02 0.12–1.62
Completer statusb 0.65 0.51 0.20 -0.34–1.65
Waist circumference -0.07 0.02 0.00 -0.11–0.03
Constant 10.20 1.86 0.00 6.56–13.83
SIinsulin sensitivity
a
SIwas obtained after 4 weeks of treatment with 0, 15 g, or 30 g RS/day.
Subject ID was included as a group variable
b
when compared to Caucasians [15, 16]. We also observed that the effect of RS on SIwas significant only within the
postmenopausal women in the IR sub-group. In these women, a significant (P< 0.05) 34 % increase in SI
occurred between the 0 and 30 g/day doses. After meno-pause, women experience increases in risk for several metabolic diseases including type 2 diabetes and cardio-vascular disease [20, 21]. Although further studies with larger samples are needed before conclusions can be drawn, results of this study suggest that RS may be par-ticularly effective at improving insulin sensitivity in African-Americans and post-menopausal women, groups that are at elevated risk for chronic metabolic disease.
We noted that the IR sub-group, on average, consumed 23–33 % less dietary fiber than did the IS sub-group. Fur-ther, in all women combined, dietary fiber intake was posi-tively associated with insulin sensitivity (r= 0.28,P< 0.05) in a simple correlation analysis (data not shown). Al-though these results must be treated with caution because compliance with food record submission was incomplete, it is possible that lower insulin sensitivity in the IR sub-group was due at least in part to habitually lower fiber consumption. It is also possible that the lack of effect of the RS treatment on insulin sensitivity in the IS sub-group was due to their greater habitual consumption of dietary fiber.
Although two doses of RS (15 and 30 g/day) were tested in this study, the effect of RS was significant only with the 30 g/day dose. In contrast, within abdominally obese men,
consumption of both 15 and 30 g/d RS for 4 weeks resulted in higher mean SI [12]. The IR women in this
study had a waist circumference of ~99 cm on average, a value that corresponds to a visceral fat area of >130 cm2, the threshold for perturbations in glucose-insulin homeo-stasis [22]. Nonetheless, these women were relatively healthy. It is possible that a cohort of women with greater metabolic dysfunction would have responded to the lower dose of RS. It is also possible that women are less respon-sive to RS, and therefore require a higher dose.
In this study, IR women exhibited greater insulin sensitivity after the 30 g/d treatment compared to pla-cebo. This insulin sensitivity was at the “whole body” level; i.e., the Minimal Model SI value includes both
insulin-stimulated glucose uptake at skeletal muscle and insulin inhibition of hepatic glucose production. Thus, we cannot determine whether RS treatment affected skeletal muscle, liver, or both. A previous study that used a tracer-based euglycemic clamp indicated that RS af-fected skeletal muscle and adipose tissue but not hepatic insulin sensitivity in insulin resistant participants [3]. Nonetheless, several studies have reported lower fasting glucose and/or insulin, markers of hepatic insulin sensi-tivity, following treatment with RS [3, 23]. Further, the effect of RS on whole-body insulin sensitivity is relatively large (e.g., 33–69 % observed with meal tolerance test or intravenous glucose tolerance test [9, 10, 12]) in contrast to the 14–16 % improvement observed with the muscle-specific euglycemic clamp [10, 11]. Studies are needed to
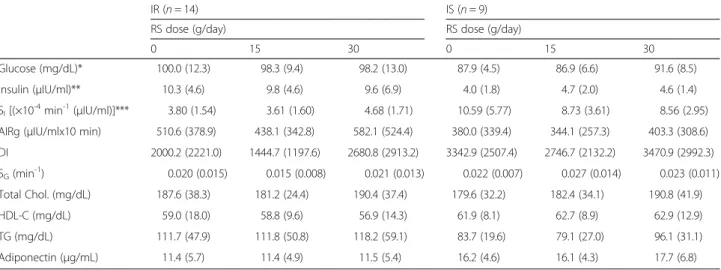
Table 3Biochemical and metabolic measures of the 23 women who completed all arms of the study by insulin sensitivity sub-group (IR/IS) after 4 weeks of exposure to the indicated dose of RS. Mean (SD)
IR (n= 14) IS (n= 9)
RS dose (g/day) RS dose (g/day)
0 15 30 0 15 30
Glucose (mg/dL)* 100.0 (12.3) 98.3 (9.4) 98.2 (13.0) 87.9 (4.5) 86.9 (6.6) 91.6 (8.5)
Insulin (μIU/ml)** 10.3 (4.6) 9.8 (4.6) 9.6 (6.9) 4.0 (1.8) 4.7 (2.0) 4.6 (1.4)
SI[(×10-4min-1(μIU/ml)]*** 3.80 (1.54) 3.61 (1.60) 4.68 (1.71) 10.59 (5.77) 8.73 (3.61) 8.56 (2.95)
AIRg (μIU/mlx10 min) 510.6 (378.9) 438.1 (342.8) 582.1 (524.4) 380.0 (339.4) 344.1 (257.3) 403.3 (308.6)
DI 2000.2 (2221.0) 1444.7 (1197.6) 2680.8 (2913.2) 3342.9 (2507.4) 2746.7 (2132.2) 3470.9 (2992.3)
SG(min-1) 0.020 (0.015) 0.015 (0.008) 0.021 (0.013) 0.022 (0.007) 0.027 (0.014) 0.023 (0.011)
Total Chol. (mg/dL) 187.6 (38.3) 181.2 (24.4) 190.4 (37.4) 179.6 (32.2) 182.4 (34.1) 190.8 (41.9)
HDL-C (mg/dL) 59.0 (18.0) 58.8 (9.6) 56.9 (14.3) 61.9 (8.1) 62.7 (8.9) 62.9 (12.9)
TG (mg/dL) 111.7 (47.9) 111.8 (50.8) 118.2 (59.1) 83.7 (19.6) 79.1 (27.0) 96.1 (31.1)
Adiponectin (μg/mL) 11.4 (5.7) 11.4 (4.9) 11.5 (5.4) 16.2 (4.6) 16.1 (4.3) 17.7 (6.8)
*P< 0.05, **P< 0.001 for IR vs IS at dose = 0 g/day
***P< 0.05 for dose effect within the IR sub-group. The 30 g/day dose differed from the 15 g/day dose (P< 0.05) and tended to differ from the 0 g/day dose (P= 0.068)
IRinsulin resistant [SIvalue <7.8 ×10 -4
min-1/ (μIU/ml)]
ISinsulin sensitive [SIvalue≥7.8 ×10 -4
min-1
/ (μIU/ml)]
SIinsulin sensitivity by minimal model
AIRgacute insulin response to glucose
DIdisposition index (dimensionless)
SGglucose effectiveness
more extensively characterize the site of RS action, and determine whether the site of action differs with the metabolic phenotype of the participants.
Strengths of this study were the double-blind, random-ized, placebo-controlled cross-over design; inclusion of African-American women, a group at disproportionate risk for type 2 diabetes; testing during only the follicular phase of the menstrual cycle; administration of two doses of RS; and administration of the RS as a snack food, which increases the translational potential of the results. The main limitation was that many of the women did not complete all three arms of the study. This was a demanding study, requiring women to commit to almost 6 months of involvement, with at least 12 weeks of product consumption, and three intravenous glucose tolerance tests. In addition, some women tired of consum-ing two servconsum-ings of cookies each day; a greater variety of snack choices may have increased adherence. The small sample size made interpretation of sub-group analyses dif-ficult; a larger sample size is needed to more closely exam-ine the response of sub-groups based on insulin sensitivity status, menopausal status, and ethnicity/race.
Conclusions
In conclusion, among IR women, consumption of RS at a dose of 30 g/d in the form of a snack food item was as-sociated with improved insulin sensitivity. RS may be an appropriate dietary ingredient to improve insulin sensi-tivity in women, particularly those at elevated risk for type 2 diabetes, such as African-American and post-menopausal women.
Competing interests
BG received a research grant from Ingredion Incorporated; RB and DS are consultants of Ingredion Incorporated; CP is an employee of Ingredion Incorporated.
Authors’contributions
BG and CP designed the study. BG was responsible for study oversight and manuscript preparation. BD was responsible for product preparation and distribution. FO provided medical oversight. DS performed statistical analysis. RB provided assistance with analysis and interpretation of minimal model data. HR, GF, and SKS provided day-to-day implementation of various aspects of the study protocol and testing. All authors read and approved the final manuscript.
Acknowledgements
The study was funded and supported by Ingredion Incorporated, P30DK56336 (Nutrition Obesity Research Center), P60DK079626 (Diabetes Research Center), UL1RR025777 (Clinical and Translational Science Award)
Author details
1Department of Nutrition Sciences, University of Alabama at Birmingham
(UAB), 616A Webb Building, 1675 University Blvd, Birmingham, AL 35294, USA.2Cedars-Sinai Diabetes and Obesity Research Institute, Los Angeles, CA,
USA.3New Bolton Center, School of Veterinary Medicine, University of
Pennsylvania, Philadelphia, PA 19104, USA.4Clinical Research Unit, UAB,
Birmingham, USA.5Department of Medicine, Division of Diabetes, Endocrinology, and Metabolism, UAB, Birmingham, USA.6Department of
Human Studies, UAB, Birmingham, USA.7Department of Nutrition Sciences,
UAB, Birmingham, USA.8Ingredion, Incorporated, Bridgewater, NJ, USA.
Received: 21 September 2015 Accepted: 5 January 2016
References
1. Robertson MD. Dietary-resistant starch and glucose metabolism. Curr Opin Clin Nutr Metab Care. 2012;15:362–7.
2. den Besten G, van Eunen K, Groen AK, Venema K, Reijngoud DJ, Bakker BM. The role of short-chain fatty acids in the interplay between diet, gut microbiota, and host energy metabolism. J Lipid Res. 2013;54:2325–40. 3. Robertson MD, Wright JW, Loizon E, Debard C, Vidal H, Shojaee-Moradie F,
et al. Insulin-sensitizing effects on muscle and adipose tissue after dietary fiber intake in men and women with metabolic syndrome. J Clin Endocrinol Metab. 2012;97:3326–32.
4. Boden G, Lebed B, Schatz M, Homko C, Lemieux S. Effects of acute changes of plasma free fatty acids on intramyocellular fat content and insulin resistance in healthy subjects. Diabetes. 2001;50:1612–7.
5. Boden G, Cheung P, Stein TP, Kresge K, Mozzoli M. FFA cause hepatic insulin resistance by inhibiting insulin suppression of glycogenolysis. Am J Physiol Endocrinol Metab. 2002;283:E12–9.
6. Zhou J, Keenan MJ, Keller J, Fernandez-Kim SO, Pistell PJ, Tulley RT, et al. Tolerance, fermentation, and cytokine expression in healthy aged male C57BL/6 J mice fed resistant starch. Mol Nutr Food Res. 2012;56:515–8. 7. Qi L, van Dam RM, Liu S, Franz M, Mantzoros C, Hu FB. Whole-grain, bran,
and cereal fiber intakes and markers of systemic inflammation in diabetic women. Diabetes Care. 2006;29:207–11.
8. Qi L, Rimm E, Liu S, Rifai N, Hu FB. Dietary glycemic index, glycemic load, cereal fiber, and plasma adiponectin concentration in diabetic men. Diabetes Care. 2005;28:1022–8.
9. Robertson MD, Currie JM, Morgan LM, Jewell DP, Frayn KN. Prior short-term consumption of resistant starch enhances postprandial insulin sensitivity in healthy subjects. Diabetologia. 2003;46:659–65.
10. Robertson MD, Bickerton AS, Dennis AL, Vidal H, Frayn KN. Insulin-sensitizing effects of dietary resistant starch and effects on skeletal muscle and adipose tissue metabolism. Am J Clin Nutr. 2005;82:559–67.
11. Johnston KL, Thomas EL, Bell JD, Frost GS, Robertson MD. Resistant starch improves insulin sensitivity in metabolic syndrome. Diabet Med. 2010;27:391–7.
12. Maki KC, Pelkman CL, Finocchiaro ET, Kelley KM, Lawless AL, Schild AL, et al. Resistant starch from high-amylose maize increases insulin sensitivity in overweight and obese men. J Nutr. 2012;142:717–23.
13. Nuutila P, Knuuti MJ, Maki M, Laine H, Ruotsalainen U, Teras M, et al. Gender and insulin sensitivity in the heart and in skeletal muscles. Studies using positron emission tomography. Diabetes. 1995;44:31–6.
14. Donahue RP, Prineas RJ, Donahue RD, Bean JA, Skyler JS. The female“insulin advantage”in a biracial cohort: results from the Miami Community Health Study. Int J Obes (Lond). 1996;20:76–82.
15. Chandler-Laney PC, Phadke RP, Granger WM, Munoz AJ, Dalla Man C, Cobelli C, et al. Adiposity and beta-cell function: relationships differ with ethnicity and age. Obesity. 2010;18:2086–92.
16. Chandler-Laney P, Phadke R, Granger WM, Fernandez JR, Munoz AJ, Dalla Man C, et al. Age-related changes in insulin sensitivity and beta-cell function among EA and AA women. Obesity. 2010;19:528–35. 17. Bergman RN, Phillips LS, Cobelli C. Physiologic evaluation of factors
controlling glucose tolerance in man. Measurement of insulin sensitivity and beta-cell glucose sensitivity from the response to intravenous glucose. J Clin Invest. 1981;68:1456–67.
18. Yang YJ, Youn JH, Bergman RN. Modified protocols improve insulin sensitivity estimation using the minimal model. Am J Physiol Endocrinol Metab. 1987;253:E595–602.
19. Boston RC, Stefanovski D, Moate PJ, Sumner AE, Watanabe RM, Bergman RN. MINMOD millennium: a computer program to calculate glucose effectiveness and insulin sensitivity from the frequently sampled intravenous glucose tolerance test. Diabetes Technol Ther. 2003;5:1003–15.
20. Heianza Y, Arase Y, Kodama S, Hsieh SD, Tsuji H, Saito K, et al. Effect of postmenopausal status and age at menopause on type 2 diabetes and prediabetes in Japanese individuals: Toranomon Hospital Health Management Center Study 17 (TOPICS 17). Diabetes Care. 2013;36:4007–14. 21. Carr MC. The emergence of the metabolic syndrome with menopause.
22. Lemieux S, Prud’homme D, Bouchard C, Tremblay A, Despres JP. A single threshold value of waist girth identifies normal-weight and overweight subjects with excess visceral adipose tissue. Am J Clin Nutr. 1996;64:685–93. 23. Bodinham CL, Smith L, Wright J, Frost GS, Robertson MD. Dietary fibre
improves first-phase insulin secretion in overweight individuals. PLoS One. 2012;7, e40834.
• We accept pre-submission inquiries
• Our selector tool helps you to find the most relevant journal
• We provide round the clock customer support
• Convenient online submission
• Thorough peer review
• Inclusion in PubMed and all major indexing services
• Maximum visibility for your research
Submit your manuscript at www.biomedcentral.com/submit

![Fig. 1 Gaussian distributions of insulin sensitivity values. Two groups [(insulin resistant (IR) and insulin sensitive (IS)] were identified based on the cut-point of 7.8](https://thumb-us.123doks.com/thumbv2/123dok_us/7906232.2104792/4.892.89.806.130.449/gaussian-distributions-insulin-sensitivity-insulin-resistant-sensitive-identified.webp)