22
ISSN 1822–8402 EUROPEAN INTEGRATION STUDIES. 2012. No 6
CORRELATION OF OBJECTIVE AND SUBJECTIVE TERRITORIAL DEVELOPMENT
INDICES IN THE WORLD
Jelena Lonska, Vera Boronenko
Daugavpils University, Rezekne Higher Education Institution, Latvia Daugavpils University, Latvia
e-mail: [email protected], [email protected]
http://dx.doi.org/10.5755/j01.eis.0.6.1468
A variety of measurement instruments is used to estimate the territorial development in the world, for instance, indicators, indices, etc. These measurement tools are applied measuring certain regions of a country and assessing the development of a territory as well as comparing territories with each other or in relation to the previous years. In Latvia, certain methodology for calculating the level of territorial development has existed for about 15 years. Parallel to the official methodology, scientists and researchers of Latvia offer to use alternative methodology and indices for measuring territorial development. Having analysed various theoretical approaches to a relatively new direction of the economic science within the framework of Economics of Development, the authors offer their own perception of the conceptual nature of the territorial development that could be used as a methodological basis for measuring territorial state of development: the main indicator of any territorial development is related to People, their material well-being, and health, level of education, spirituality, and overall satisfaction with life. In other words, a developed territory is the one, where the number of people increased, and these people are wealthy, healthy, educated, spiritually developed, and satisfied with their lives, but a relatively more developed territory is the one, where these indicators are higher. In recent years, researches in the field of territorial development resumed the idea that money as well as economic growth is insufficient to evaluate the development, particularly in developing countries: the world’s nations became increasingly wealthy; therefore, prosperity is not a pure index to evaluate country’s development. As a result, various indices and indicators, focused directly on the determination of subjective well-being level of society and people, are emerging. Therefore, many countries worldwide conclude that there is a need for assessing subjective well-being at a national level that, in its turn, could serve as a goal for reviewing the national public policy. In order to understand the interaction between territorial development indices, the authors of this article on the basis of the newly-created methodological model for measuring territorial development, analyse their correlation, considering world’s countries as an object and basing on the available official statistical information and qualitative research data. The objective of the research is to empirically analyse the way objective and subjective territorial development indices are interconnected as well as to determine whether people’s satisfaction with life and spirituality depend on people’s material welfare. The analysis led to the conclusion that people’s satisfaction with life correlates with GDP per capita in the country, although people’s spirituality (in this research - happiness) can poorly correlate with material welfare of society.
Keywords: state of development, territorial development indices, happiness, satisfaction with life.
Introduction
“People are the real wealth of a nation.” With these words, in 1990, “the Human Development Report” launched its energetic campaigns towards the new approaches to support the development. The idea that the basic objective of development is to create an enabling environment for people, which allows living long, healthy and creative lives, today may seem obvious. However, it was not always like that. The main objective of the report, over the last 20 years, has been to emphasize the fact that development itself is directly intended for people (Klugman J. 2011).
Any territory is a land with its inhabitants with all life diversity, it is also the land’s natural resources, infrastructure, culture, history, relationships with other territories (inhabitants) and many other aspects that turn this territory into what it is, its identity is formed. The change of all these aspects at a time forms the content, which must be considered in order to understand the development. Therefore, researchers
seek to create measurement methods of development that would combine many (or at least some of the most important) development aspects in a single numerical index. In these measurements, the most important issues are: to what extend people are ensured equality in the distribution of material wealth, whether equal opportunities are created in relation to employment, education, livelihood (food provision, shelter), regarding healthcare, availability of leisure time and the use of it, security, as well as political and cultural life. The most marked material factors in this group, such as material wealth, food, shelter, are often connected with the concept — standard of living, but less material factors (health, leisure, cultural life) with the concept — quality of life.
ISSN 1822–8402 EUROPEAN INTEGRATION STUDIES. 2012. No 6 aimed at evaluation of territorial development. In this research, the authors will analyse the correlation of the model elements of the indicator values concerning the world countries, taking into consideration the available official statistical data and quantitative research data.
The aim of the research is to analyse the correlation
peculiarities of index indicators of countries in the world in regard to the authors’ newly-created methodological model for measuring territorial development, taking into consideration the available official statistical data and quantitative research data.
Research tasks:
1) To provide the theoretical substantiation of the newly-created methodological model for measuring territorial development;
2) To conduct correlation analysis of index indicators of this model regarding countries;
3) To analyse the findings and formulate conclusions.
Research object – 93 countries.
Research subject – territorial development indices of 93
world countries.
Research hypothesis – such subjective elements of the
methodological model of territorial development as people’s satisfaction with life and their spirituality depend greatly on people’s material well-being.
Research methods: monographic method, logical
analysis and synthesis method, deductive method, correlation method.
Theoretical substantiation of the newly-created methodological model for measuring territorial development
The authors of this research repose on the theoretical elaborations of “economics of development,” which clarify the concept of economics of development, as well as aims and tasks of the branch of this economic science.
Economicsof development – the study of how economies
are transformed from stagnation to growth and from low-income to high-low-income status, and overcome problems of absolute poverty (Todaro M.P., Smith S.C. 2011). Economics of development seeks to understand and explain why some countries (territories) are poor and others rich, and how to reduce poverty in poor countries (territories) to give everyone on the planet a minimum standard of life and freedom from hunger and fear of the future (Thirlwall A.P. 2011).
The study of economics of development as a separate subject in economics is a relatively new phenomenon. Academic interest in the mechanics of growth and development is a renewed interest rather an entirely new preoccupation of economists. The progress and material well-being of people and nations have traditionally been at the centre of economic writing and enquiry. It constituted one of the major areas of interest of classical economists.
Smith A. (1776), Ricardo D. (1817),Malthus T. (1798), Mill J.S. (1859)– all dealt at some length with the causes and consequences of economic advance. The list of modern–day economists who have turned their fertile minds to the study of economic development is the following: Krugman P. (1991), Stiglitz J. (1994), Rostow W. (1960), Robinson J. (1996), Johnson H. (1966), Sen A. (1983).
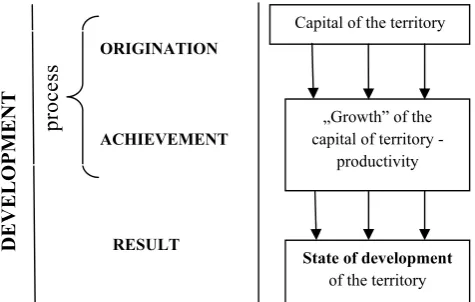
According to the economics of development, territorial
development is seen as a whole process having a particular
result: the process itself is territorial capital growth, but the result achieved within the process is territorial state
of development (see fig.1). Capital of the territory is a
determinant, which is actively studied by scientists and researchers in Europe as well as in Latvia it used to determine theoretical methodological base of territorial development – Giffinger R. (2008), Camagni R. (2008, 2009, 2011), Capello R. (2008, 2009), Valtenbergs V. (2011). Territorial capital consists of seven elements – financial capital, technical infrastructure (buildings, structures, etc.), social capital, human capital, nature capital, cultural, and political capital.
assumption that “region’s development = people’s
life-sustenance, self-esteem and freedom”, have developed a
methodological model for measuring territorial development
aimed at evaluation of territorial development. In this research,
the authors will analyse the correlation of the model elements
of the indicator values concerning the world countries, taking
into consideration the available official statistical data and
quantitative research data.
The aim of the research is to analyse the correlation peculiarities of index indicators of countries in the world in
regard to the authors’ newly-created methodological model for
measuring territorial development, taking into consideration the
available official statistical data and quantitative research data.
Research tasks:
1) To provide the theoretical substantiation of the
newly-created methodological model for measuring territorial
development;
2) To conduct correlation analysis of index indicators of
this model regarding countries;
3) To analyse the findings and formulate conclusions.
Research object – 93 countries.
Research subject – territorial development indices of 93 world countries.
Research hypothesis – such subjective elements of the methodological model of territorial development as people’s
satisfaction with life and their spirituality depend greatly on
people’s material well-being.
Research methods: monographic method, logical analysis and synthesis method, deductive method, correlation method.
Theoretical substantiation of the newly-created methodological model for measuring territorial development
The authors of this research repose on the theoretical
elaborations of “economics of development,” which clarify the
concept of economics of development, as well as aims and
tasks of the branch of this economic science.
Economicsof development – the study of how economies are transformed from stagnation to growth and from
low-income to high-low-income status, and overcome problems of
absolute poverty (Todaro M.P., Smith S.C. 2011). Economics
of development seeks to understand and explain why some
countries (territories) are poor and others rich, and how to
reduce poverty in poor countries (territories) to give everyone
on the planet a minimum standard of life and freedom from
hunger and fear of the future (Thirlwall A.P. 2011).
The study of economics of development as a separate
subject in economics is a relatively new phenomenon.
Academic interest in the mechanics of growth and development
is a renewed interest rather an entirely new preoccupation of
economists. The progress and material well-being of people and
nations have traditionally been at the centre of economic
writing and enquiry. It constituted one of the major areas of
interest of classical economists.
Smith A. (1776), Ricardo D. (1817), Malthus T. (1798),
Mill J.S. (1859)– all dealt at some length with the causes and
consequences of economic advance. The list of modern–day
economic development is the following: Krugman P. (1991),
Stiglitz J. (1994), Rostow W. (1960), Robinson J. (1996),
Johnson H. (1966), Sen A. (1983).
According to the economics of development, territorial
development is seen as a whole process having a particular result: the process itself is territorial capital growth, but the result achieved within the process is territorial state of development (see fig.1). Capital of the territory is a determinant, which is actively studied by scientists and
researchers in Europe as well as in Latvia it used to determine
theoretical methodological base of territorial development –
Giffinger R. (2008), Camagni R. (2008, 2009, 2011), Capello
R. (2008, 2009), Valtenbergs V. (2011). Territorial capital
consists of seven elements – financial capital, technical
infrastructure (buildings, structures, etc.), social capital, human
capital, nature capital, cultural, and political capital.
Figure 1. Development as a process and as a result(compiled by the authors, basing on Boronenko V. (2007)
Analysing Figure 1, it can be concluded that state of
development is hardly conceivable without growth, however
growth is possible without state of development. Although the
state of development is virtually impossible without growth, it
is possible without increasing income per capita. To analyse the
development, there should be improved standard of living and
welfare, when the increase in income per capita is a sufficient
condition to improve the well-being of individuals – it is an
indispensable element to achieve prosperity without radical
institutional innovations. (Thirlwall A.P. 2011).
The economists Goulet D. (1977) and Sen A. (1983) argue
that economic development must mean much more than just a rise in the average level of per capita income of a country. A
concept of development is required that embraces all of the
economic and social objectives and values that countries strive
for – not simply material progress, but, in particular, the
self-esteem of peoples and nations, and freedom.
Economist Goulet D. (1977) this broad concept
“development” expounds and substantiates using three core
components, defined in terms of life-sustenance, self-esteem
and freedom.
Life-sustenance is concerned with the provision of basic
needs. The basic needs approach to development was initiated
Capital of the territory
„Growth” of the capital of territory -
productivity
State of development
of the territory
D
E
V
E
L
O
P
M
E
N
T
ORIGINATION
ACHIEVEMENT
RESULT
process
Figure 1. Development as a process and as a result (compiled by the authors, basing on Boronenko V. (2007)
Analysing Figure 1, it can be concluded that state of development is hardly conceivable without growth, however growth is possible without state of development. Although the state of development is virtually impossible without growth, it is possible without increasing income per capita. To analyse the development, there should be improved standard of living and welfare, when the increase in income per capita is a sufficient condition to improve the well-being of individuals – it is an indispensable element to achieve prosperity without radical institutional innovations. (Thirlwall A.P. 2011).
The economists Goulet D. (1977) and Sen A. (1983) argue that economic development must mean much more than just a rise in the average level of per capita income of a country. A concept of development is required that embraces all of the economic and social objectives and values that countries strive for – not simply material progress, but, in particular, the self-esteem of peoples and nations, and freedom.
Economist Goulet D. (1977) this broad concept “development” expounds and substantiates using three core components, defined in terms of life-sustenance,self-esteem
and freedom.
Life-sustenance is concerned with the provision of basic needs. The basic needs approach to development was initiated by the World Bank in the 1970s. No country may be regarded as fully developed if it cannot provide all its people with such basic needs as housing, clothing, food and minimal education. A major objective of development must be to raise people out of primary poverty and to provide basic needs simultaneously.
ISSN 1822–8402 EUROPEAN INTEGRATION STUDIES. 2012. No 6
24 power and influence to conduct relations on equal terms. All peoples and societies seek some basic form of self-esteem, although they may call it authenticity, identity, dignity, respect, honour, or recognition. The nature and form of this self-esteem may vary from society to society and from culture to culture.
Freedom refers to that people are more able to determine their own destiny. No person is free if they cannot choose; if they are imprisoned by living on the margin of subsistence with no education and no skills. The advantage of material development is that it expands the range of human choice open to individuals and societies at large. Freedom here is to be understood in the sense of emancipation from alienating material conditions of life and from social servitude to nature, other people, misery, oppressive institutions, and dogmatic beliefs, especially that poverty is predestination.
All three of these components are interrelated. Lack of self-esteem and freedom result from low levels of life sustenance, and both lack of self-esteem and economic imprisonment become links in a circular, self-perpetuating chain of poverty by producing a sense of fatalism and acceptance of the established order – the “accommodation to poverty” as Galbraith (1980) once called it (Thirlwall A.P. 2011).
Goulet’s (1977) three core components of development are related to Sen’s (1983) vision of development defined in terms of the expansion of entitlements and capabilities, the former giving life-sustenance and self-esteem; the latter giving freedom.
Sen A. (1983) considers freedom as a precondition of development; freedom is primary instrument to reach development. Development includes the process of eliminating “unfreedoms” widening individuals’ choices and opportunities. One understands “unfreedoms” as starvation and insufficient food, bad health and lack of basic needs, lack of political freedom and basic civil rights as well as economic insecurity.
Sen A. (1983) defines development as expansion of person’s freedom – the possibility to expand person’s self-fulfilment, as well as freedom of choice regarding different ways of living.
In his researches Sen A. (1983) used the “capability
approach” and substantiated the idea that the process of
development – it is not only the increase of material and economic well-being, but also widening of individuals’ opportunities, which means greater freedom of choice to let each one choose from several options the aim and lifestyle they consider to be the best.
In the economics of development, analysing territorial development the emphasis is put not only on economic, material but also on other objective indices. Much attention is also paid to the analysis of such subjective, “intangible” indices as people’s life satisfaction, happiness, people’s subjective well-being, and quality of life. These indices are summarized and analysed by so called “Happiness
Economics” mainly using surveys where people have to
answer a set of questions about their subjective feeling of life satisfaction and happiness.
The greatest cornerstone of “happiness economics” is the question: “Does the feeling of happiness/subjective well-being depend on material conditions?”, in other words: “Is happiness found in money?”. The first one, who researched
correlations between GDP of countries and subjective well-being of individuals, the American economist Easterlin R. (1974); in 1974 he discovered the “Easterlin paradox” according to which individuals’ subjective well-being is a very relative notion: while a person is more prosperous than other members of the society, he feels happy; as soon as the surrounding people reach his material level, he does not feel so happy, e.g., people try to be not simply rich, but richer than others. Easterlin asserts “In all societies, more money for the individual typically means more individual happiness. However, raising the incomes of all does not increase the happiness of all”.
Analysing Easterlin’s approach to the analysis of subjective well-being the authors of the article point that Easterlin does not consider separately how individuals’ life satisfaction and feeling of happiness changes depending on income, usually combining them into one term “subjective well-being”.
The approach of the American scientist Inglehart R. (2008) and his co-researchers to the solution of regularities mentioned above is closer to the authors of the article. Inglehart’s terms “people’s life satisfaction” and “feeling of happiness” are defined separately considering to what extent each phenomenon is related to the individual and state well-being. Inglehart believes that material well-being mostly affects people’s life satisfaction, not happiness because life satisfaction is more sensitive to economic conditions than happiness. Happiness is a felling which can be reached on the spot; it is directly related to the solidarity of a group of people, religiosity and national pride. However, at higher levels of economic security, the impact of free choice surpasses that of solidarity. In his researches Inglehart uses Subjective Well-being Index (SWB index): SWB = life satisfaction –
2.5 x happiness to assess the obtained data. The results of
the research show the more tolerant the society, the larger SWB Index – the tolerance of the society widens individual’s freedom of choice, reduces the inequality of genders, thus facilitating the increase of happiness. Inglehart also points that religiosity and national pride are stronger in less developed countries explaining the fact that low-income countries have a relatively high SWB Index.
25 self”. The well-being conception “Experiencing self” means immediate experiencing and sensing happiness, but the conception “Remembering self” – means to what extent an individual is satisfied thinking about his life.
Exploring people’s subjective well-being Deaton and Kahneman (2010) happiness (emotional well-being) is assessed by questions about the presence of various emotions in the experience of yesterday (e.g., enjoyment, happiness, anger, sadness, stress, worry). Satisfaction with life (life evaluation) is measured using Cantril’s ladder scale, which has the respondent rate his or her current life on a ladder scale in which 0 is „the worst possible life for you” and 10 is “the best possible life for you”. Answering the question “How satisfied are you with your life as a whole these days?” an individual should place himself/herself on the most appropriate step of the ladder.
As a result of this research Deaton and Kahneman (2010) discovered the following correlations: people’s feeling of happiness increases when their income increase, but to a certain point of ≈ 75000 USD per year, exceeding this limit people do not feel happier.
As regards people’s total satisfaction with life – after this income threshold money can still influence people’s satisfaction with life, but not emotional well-being.
Perhaps 75000 USD is a threshold beyond which further increases in income no longer improve individuals’ ability to do what matters most to their emotional well-being, such as spending time with people they like, avoiding pain and disease, and enjoying leisure. Besides, the more people’s income exceeds the threshold of 75000 USD per year, the less simple joy of life makes them happy. But when the income level decreases, people feel less happy, they are more stressful and disappointed. It has been observed that religion has a substantial influence on improving positive affect and reducing reports of stress, but no effect on reducing sadness or worry (Kahneman and Deaton 2010).
Summing up everything mentioned above it can be concluded that development takes place when the basic needs
are improved, when economic success facilitates increase of self-respect in the individuals and state, and when the improvement of the material status broadens people’s rights, opportunities, freedom and increases people’s subjective well-being and emotional state, e.g., when growth leads to development (see Fig.1).
Empiric indicators of the newly-created methodological model for measuring territorial development
The authors of the research suggest substantiating the evaluation of the level of territorial growth on the newly-created methodological model for measuring territorial development, the indicators of which are focused directly on the people’s existence and determination of the level of their welfare.
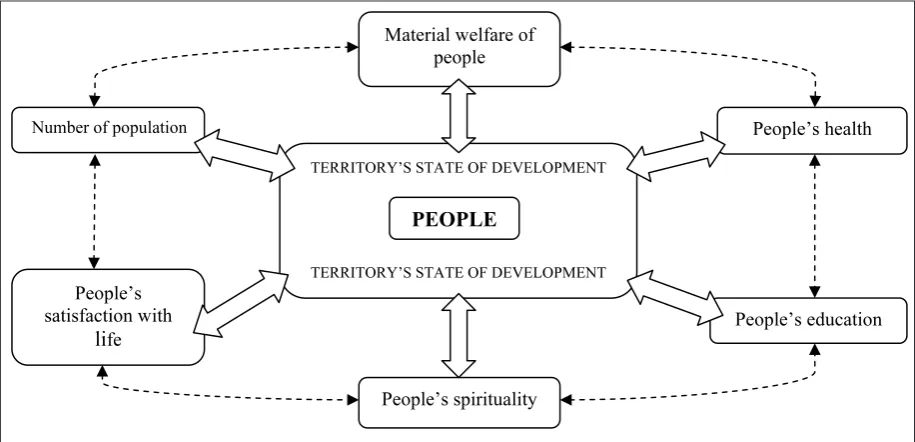
This model consists of 6 key elements (see Fig.2): 1) Number of population;
2) Material welfare of people; 3) People’s health;
4) People’s education; 5) People’s spirituality; 6) People’s life satisfaction.
The following indicators have been chosen to be the empirical indicators of the basic elements of the newly-created methodological model of territorial development:
1) Element “Number of population” – average increase
in the number of population %, 2010/2015 (“Human
Development Report 2011”).
2) Element “Material welfare of people” – GDP per capita, calculated at purchasing power parity (USD), which is often used instead of the market rate to compare the economic indicators of various states and currencies because then they reflect definite amount of goods or a definite level of well-being not taking into consideration the price differences (“Human Development Report 2011”).
Figure 2.Key elements of the newly-created methodological model for measuring territorial development and their interrelation (compiled by the authors)
Correlation analysis of the newly-created methodological model for measuring territorial development
As not all countries in the world calculate all indicators
mentioned above, only 93 countries were selected for analysis,
including Latvia; the authors succeeded to find all eight groups
of indicators for these countries. These 93 countries were
ranged according to the values of the indicators attributing each
country a certain place in the range according to each indicator.
After that, this information was fed into the SPSS («Statistical
Package for the Social Sciences») statistical analysis software,
with the help of which, the correlation strength was determined, applying the Spearman’s rank correlation coefficient, which
does not depend on the mathematical direction of the
correlation – direct or reverse, and is determined according to
the absolute value of the correlation coefficient. The maximum
absolute value of the correlation coefficient is r=1.000,
minimum – r=0.000. The degree of correlation was determined
by Chertok’s scale having six gradations of correlation: |r|<0.1
– there is practically no correlation; 0.1<|r|<0.3 – very weak
correlation; 0.3<|r|<0.5 – weak correlation; 0.5<|r|<0.7 –
average correlation; 0.7<|r|<0.9 – close (strong) correlation;
0.9<|r|<1 – very close (very strong) correlation
(http://matstats.ru/). Spearmen’s range correlation coefficient
was chosen because all variables belong to the range scale as
analysis is performed not on the basis of the absolute values of
the chosen indicators, but on their ranges – the place of a
country among others according to each indicator. Correlation
can be statistically very significant (** - with probability of
99%), statistically significant (* - with probability of 95%) and
statistically insignificant.
The authors will consider in analysis only the strong and
statistically significant correlations.
The following information has been obtained (see
Appendix 1):
1) Strong correlation and statistically very significant correlation is observed between the indicator “GDP per
element “Material welfare of people” and the indicator “Infant mortality” of the element “People’s health” – the correlation coefficient is negative -0.898**. It means when the state income increases, infant mortality
decreases (see Table 1). In the 1970s the American
demographist and sociologist Samuel H.Preston (1975)
revealed general regularities basing on the materials of
different countries from different periods of the 20 th
century: the greater economic success of the society and
GDP per capita, the more favourable situation in the
public health, lower mortality and, respectively, longer
life expectancy.
Table 1
Infant mortality in the world (number of dead infants in the first
year of their life per 1000 live infants)
(compiled by the authors using the statistical database of the
World Bank)
*Classification of the states by the World Bank basing on
GNP per capita in 2010 in USD
The data compiled in Table 1 clearly indicate the result of
correlation – when state income increases, infant mortality
decreases.
2) Strong and statistically significant correlations with a coefficient 0.869** is also observed between the indicator “GDP per capita calculated at purchasing power parity” of
the element “Material welfare of people” and the
2000 2005 2009
High income states (GNP ≥
12276 $ per capita)* 6.7 6.0 5.5
States with income above the average level (3976 $ < GNP < 12275 $ per capita)
27.6 21.6 17.4
States with income below the average level (1006 $ < GNP < 3975 $ per capita)
63.2 56.3 51.4
Low income states ( GNP ≤ 1005 $ per capita)
86.5 77.8 71.2
TERRITORY’S STATE OF DEVELOPMENT
TERRITORY’S STATE OF DEVELOPMENT PEOPLE
Number of population
Material welfare of
people
People’s health
People’s
satisfaction with
life
People’s spirituality
People’s education
Figure 2.Key elements of the newly-created methodological model for measuring territorial development and
ISSN 1822–8402 EUROPEAN INTEGRATION STUDIES. 2012. No 6
26 3) Element “People’s health” – infant mortality (the
number of deaths in their first year of life per 1000 live births) and life expectancy at birth (years) (“The Global Competitiveness Report 2011/2012”).
4) Element “People’s education” – the number of people enrolled in primary school (net) % from
the total number of inhabitants and the number of
people enrolled into tertiary education institutions (gross) % from the total number of inhabitants (“The Global Competitiveness Report 2011/2012”). 5) Element “People’s spirituality” – Happiness index
(Overview of the database “ASEP/JDS” for the period of 1999/2009 – World Map of Happiness).
6) Element “People’s satisfaction with life” – coefficient
of people’s satisfaction with life (“Human
Development Report 2011”).
Correlation analysis of the newly-created methodological model for measuring territorial development
As not all countries in the world calculate all indicators mentioned above, only 93 countries were selected for analysis, including Latvia; the authors succeeded to find all eight groups of indicators for these countries. These 93 countries were ranged according to the values of the indicators attributing each country a certain place in the range according to each indicator. After that, this information was fed into the SPSS («Statistical Package for the Social Sciences») statistical analysis software, with the help of which, the correlation strength was determined, applying the Spearman’s rank correlation coefficient, which does not depend on the mathematical direction of the correlation – direct or reverse, and is determined according to the absolute value of the correlation coefficient. The maximum absolute value of the correlation coefficient is r=1.000, minimum – r=0.000. The degree of correlation was determined by Chertok’s scale having six gradations of correlation: |r|<0.1 – there is practically no correlation; 0.1<|r|<0.3 – very weak correlation; 0.3<|r|<0.5 – weak correlation; 0.5<|r|<0.7 – average correlation; 0.7<|r|<0.9 – close (strong) correlation; 0.9<|r|<1 – very close (very strong) correlation (http:// matstats.ru/). Spearmen’s range correlation coefficient was chosen because all variables belong to the range scale as analysis is performed not on the basis of the absolute values of the chosen indicators, but on their ranges – the place of a country among others according to each indicator. Correlation can be statistically very significant (** - with probability of 99%), statistically significant (* - with probability of 95%) and statistically insignificant.
The authors will consider in analysis only the strong and statistically significant correlations.
The following information has been obtained (see Appendix 1):
1) Strong correlation and statistically very significant
correlation is observed between the indicator “GDP
per capita calculated at purchasing power parity” of the element “Material welfare of people” and the indicator “Infant mortality” of the element “People’s
health” – the correlation coefficient is negative
-0.898**. It means when the state income increases,
infant mortality decreases (see Table 1). In the 1970s
the American demographist and sociologist Samuel H.Preston (1975) revealed general regularities basing on the materials of different countries from different periods of the 20th century: the greater economic success of the society and GDP per capita, the more favourable situation in the public health, lower mortality and, respectively, longer life expectancy.
Table 1. Infant mortality in the world (number of dead
infants in the first year of their life per 1000 live infants) (compiled by the authors using the statistical database of the World Bank)
2000 2005 2009
High income states (GNP
≥ 12276 $ per capita)* 6.7 6.0 5.5 States with income above
the average level (3976 $ < GNP < 12275 $ per capita)
27.6 21.6 17.4
States with income below the average level
(1006 $ < GNP < 3975 $ per capita)
63.2 56.3 51.4
Low income states
(GNP ≤ 1005 $ per capita) 86.5 77.8 71.2 *Classification of the states by the World Bank basing on GNP per capita in 2010 in USD
The data compiled in Table 1 clearly indicate the result of correlation – when state income increases, infant mortality decreases.
1) Strong and statistically significant correlations with
a coefficient 0.869** is also observed between the indicator “GDP per capita calculated at purchasing power parity” of the element “Material welfare of people” and the indicator “Life expectancy” of the element “People’s
health”. It can be explained by the fact that countries
Table 2. Expected infants’ life expectancy at the birth
moment (years) (compiled by the authors using the
statistical database of the World Bank)
2000 2005 2009
High income states (GNP
≥ 12276 $ per capita)* 77.6 78.7 79.6
States with income above the average level
(3976 $ < GNP < 12275 $ per capita)
70.6 71.5 72.6
States with income below the average level
(1006 $ < GNP < 3975 $ per capita)
62.3 63.8 65
Low income states
(GNP ≤ 1005 $ per capita) 54.7 56.7 58.4
The data of Table 2 confirm the obtained results of correlation that the people’s life expectancy directly depends on the state income level.
2) Strong negative and statistically significant
correlation is also observed between the indicators
“Infant mortality” and “Life expectancy” of the element “People’s health” – the correlation coefficient
is -0.887**. It can be explained by the fact that both
of these indices are closely correlated and depend on the state income.
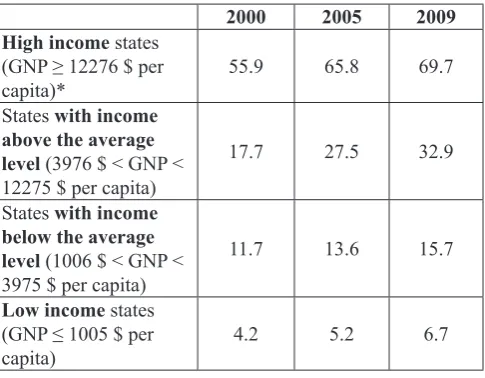
3) Strong and statistically significant correlation is
observed between the indicator “GDP per capita calculated at purchasing power parity” of the element “Material welfare of people” and the indicator “The number of people enrolled into tertiary education institutions (gross) % from the total number of inhabitants” of the element “People’s education” – the correlation coefficient is 0.730**. It means the more prosperous the country, the more candidates can be enrolled in higher education institution and obtain higher education (see Table 3).
Table 3. Distribution (%) of persons enrolled in higher education institution in the world (total) (compiled by the authors using the statistical database of the World Bank)
2000 2005 2009
High income states
(GNP ≥ 12276 $ per
capita)* 55.9 65.8 69.7
States with income above the average
level (3976 $ < GNP <
12275 $ per capita)
17.7 27.5 32.9
States with income below the average
level (1006 $ < GNP <
3975 $ per capita)
11.7 13.6 15.7
Low income states
(GNP ≤ 1005 $ per
capita) 4.2 5.2 6.7
The statistical information reflected in Table 3 clearly shows that the number of persons enrolled in higher education institutions directly depends on the state income level. High income states have better developed higher education, it is available to larger number of people, the state can satisfy demand for higher education by providing the infrastructure and qualified academic staff. It leads to feedback: a person with higher education is a person with higher “added value”, thus this person has higher return and the contribution of this person into the national economy completely state expenditure on higher education.
4) Strong negative and statistically significant
correlation is observed between the indicator ”Infant mortality” of the element “People’s health” and the indicator “The number of people enrolled into tertiary education institutions (gross) % from the total number of inhabitants” of the element “People’s education” – the correlation coefficient is -0.769**. This correlation is based on the correlations 1) and 2) mentioned above because both the health condition of people and higher education directly depend on the state income level.
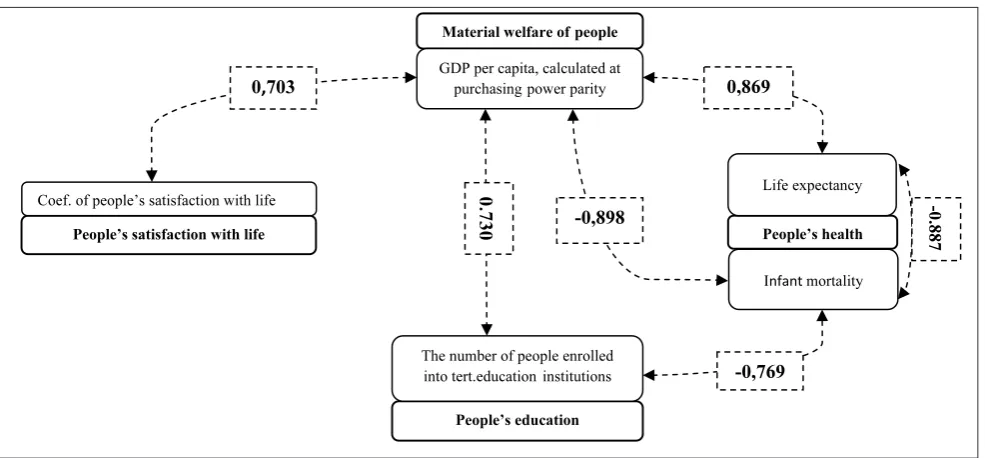
5) A strong statistically significant correlation exists
between the indicator “GDP per capita, calculated at purchasing power parity” of the element “Material welfare of people” and the indicator “coefficient of people’s satisfaction with life” of the element “People’s satisfaction with life” – strength of the correlation coefficient is 0.703**. Inglehart and his research team conducting a survey on people’s satisfaction with life and happiness regarding the world’s countries and taking the period from 1981 to 2007 found out that there is a strong correlation between well-being and the level of satisfaction with life. Satisfaction with life is “more sensitive” to the changing economic situation, it is more connected with the economic level of society than happiness. The higher the public welfare, the greater is its impact on people’s overall satisfaction with life Inglehart R. (2010).
In order to depict strong and statistically significant correlations the authors used the correlations graph, where they reflected strong correlations between model indices mentioned above (see Fig.3).
Other links between the indicators of the territorial development model observed in the correlation analysis within the research are average strong, weakly strong or insignificant. Due to the space restrictions the authors of the article will not consider these correlations.
However, taking into consideration that the hypothesis put forward in the research envisages exploring the dependence of subjective model indicators on the state income level the authors will consider the link between the indicator “Happiness Index” of the element “People’s spirituality” and the indicator “GDP per capita calculated at purchasing power parity” of the element “Material welfare of people”. The analysis lets conclude that these two indicators have a
weak statistically significant correlation coefficient 0.488**.
ISSN 1822–8402 EUROPEAN INTEGRATION STUDIES. 2012. No 6
28 Observing the correlation between two subjective indicators “coefficient of people’s satisfaction with life” and “Happiness index” – there was observed a weak statistically
significant correlation with the coefficient 0.497**. As it was
mentioned above, people’s satisfaction with life correlates strongly with people’s material welfare. On the contrary, happiness is more determined by public solidarity, religiosity, and national pride. Religiosity contributes to the sense of certainty and security, especially in countries with unstable economies. Happiness reflects not only people’s objective experience but also the way people evaluate this experience under the influence of life values and religious ideological beliefs. These two indices have poor correlation (Inglehart R. 2010).
Conclusions
Summarising the research findings, it can be concluded that the hypothesis put forward has been partially proven. Such subjective indicator “coefficient of people’s satisfaction with life” of the element “People’s satisfaction with life” of the newly-created methodological model for measuring territorial development correlates with people’s material welfare, whereas, the “Happiness index” of the element “People’s spirituality” has poor correlation with people’s material state. Scientific researches conducted in the world indicate that people’s happiness depends on the material values, but not as much as people’s satisfaction with life. The results are heavily dependent on the applied survey methodology, by asking questions directly about people’s perception of happiness, as well as on what researchers understand by the concept “happiness,” whether this concept is separate from the satisfaction with life or it is just a substitute.
Happiness is an indicator with a broad meaning that encompasses such areas of people’s lives as people’s spirituality, religiosity, people’s trust to members of society and country, national pride, family and cultural values, etc. Happiness is dependent on positive emotions, joy, pleasure, self-esteem, independence, presence of friends and interesting job. Together with increasing people’s
self-Figure 3. Strong correlations between model indices (compiled by the authors)
reflected strong correlations between model indices mentioned
above (see Fig.3).
Figure 3. Strong correlations between model indices (compiled by the authors)
Other links between the indicators of the territorial
development model observed in the correlation analysis within
the research are average strong, weakly strong or insignificant.
Due to the space restrictions the authors of the article will not
consider these correlations.
However, taking into consideration that the hypothesis put
forward in the research envisages exploring the dependence of
subjective model indicators on the state income level the
authors will consider the link between the indicator “Happiness
Index” of the element “People’s spirituality” and the indicator “GDP per capita calculated at purchasing power parity” of the
element “Material welfare of people”. The analysis lets conclude that these two indicators have a weak statistically significant correlation coefficient 0.488**. It is substantiated by the consideration that happiness more depends on spiritual
values, and, as researches show, in poor states as well as people
feel comparatively happy even if they do not have sufficient
education or health care (Inglehart R. 2010).
Observing the correlation between two subjective
indicators “coefficient of people’s satisfaction with life” and
“Happiness index” – there was observed a weak statistically significant correlation with the coefficient 0.497**. As it was mentioned above, people’s satisfaction with life correlates
strongly with people’s material welfare. On the contrary,
happiness is more determined by public solidarity, religiosity,
and national pride. Religiosity contributes to the sense of
certainty and security, especially in countries with unstable
economies. Happiness reflects not only people’s objective
experience but also the way people evaluate this experience
under the influence of life values and religious ideological
beliefs. These two indices have poor correlation (Inglehart R.
2010).
Conclusions
Summarising the research findings, it can be concluded
that the hypothesis put forward has been partially proven. Such
subjective indicator “coefficient of people’s satisfaction with
life” of the element “People’s satisfaction with life” of the
newly-created methodological model for measuring territorial
development correlates with people’s material welfare,
whereas, the “Happiness index” of the element “People’s
spirituality” has poor correlation with people’s material state.
Scientific researches conducted in the world indicate that
people’s happiness depends on the material values, but not as
much as people’s satisfaction with life. The results are heavily
dependent on the applied survey methodology, by asking
questions directly about people’s perception of happiness, as
well as on what researchers understand by the concept
“happiness,” whether this concept is separate from the
satisfaction with life or it is just a substitute.
Happiness is an indicator with a broad meaning that
encompasses such areas of people’s lives as people’s
spirituality, religiosity, people’s trust to members of society and
country, national pride, family and cultural values, etc.
Happiness is dependent on positive emotions, joy, pleasure,
self-esteem, independence, presence of friends and interesting
job. Together with increasing people’s self-expression
possibilities and freedom of choice, people’s sense of happiness
also increases.
Material welfare of people
People’s health People’s satisfaction with life
People’s education GDP per capita, calculated at
purchasingpower parity
Infant mortality Life expectancy
The number of people enrolled into tert.educationinstitutions Coef. of people’s satisfaction with life
0,869
-0
.
8
8
7
0
,
7
3
0 -0,898
-0,769 0,703
expression possibilities and freedom of choice, people’s sense of happiness also increases.
References
Bohnke, P. (2005). First European Quality of Life Survey: Life satisfaction, happiness and sense of belonging. European Foundation for the Improvement of Living and Working Conditions.Luxembourg: Office for Official Publications of the European Communities, 2005. 112 p. Boronenko, V. (2007). Klasteru pieeja regionu attistibai
zinasanu ekonomikas apstaklos. Daugavpils: DU akademiskais apgads “Saule”, 2007. 348 lpp. Camagni, R., Capello, R., Chizzolini, P. (eds.) (2008).
Regional Competitiveness: Towards a Theory of
Territorial Capital. Modelling Regional Scenarios for the
Enlarged Europe: EuropeanCompetitiveness and Global
Strategies. Berlin: Springer-Verlag XVI, 2008. 321 p.
Camagni, R., Capello, R., Nijkamp, P. (eds.) (2009). Territorial Capital and Regional Development. Handbook of Regional Growth and Development Theories, Northampton, Mass.: Edward Elgar Publ., 2009, p. 118-132
Camagni, R., Caragliu, A., Perucca, G. (2011) Territorial Capital: Relational and Human Capital. Il Capitale Territoriale: scenari quali-quantitativi di superamento della crisi economica, Politecnico di Milano, 2011 On-line: http://www.inter-net.it/aisre/minisito/CD2011/ pendrive/ Paper/Camagni _Caragliu_Perucca.pdf Capello, R., Caragliu, A., Nijkamp, P. (2009). Territorial
Capital and Regional Growth: Increasing Returns
in Cognitive Knowledge Use. Tinbergen Institute
Discussion Paper TI 2009-059/3. On-line: http://www. tinbergen.nl/discussionpapers/09059.pdf
Preston, S. (1975). The Changing Relation between Mortality and Level of Economic Development. Population Studies Vol.29, No.2. Great Britain, 1975, p.231-248 On-line:
http://www.ncbi.nlm.nih.gov/pmc/articles/PMC2572360/ pdf/14758412.pdf
Ricardo, D. (1817). On the Principles of Political Economy, and Taxation. 1st edition, 1817. - Harmondsworth: Penguin reprint [R. M. Hartwell, editor], 1971. Robinson, J. A. (1996). “Distribution and Institutional
Structure: Some Preliminary Notes.” Paper presented at MacArthur Foundation, May 3. University of Southern California, Los Angeles.
Rostow, W. (1960). The Stages of Economic Growth: A Non-Communist Manifesto - Cambridge: Cambridge University Press, 1960
Schwab, K., Sala-I-Martin, X. (2011). The Global
Competitiveness Report 2011-2012. World Economic
Forum, Geneva 2011. 528 p.
Sen, A. (1983). Development: Which Way Now? Economic Journal, Royal Economic Society. 1983. Vol. 93(372), p.742-762
Smith, A. (1776). Glasgow Edition of the Works and Correspondence Vol. 2a “An Inquiry Into the Nature and Causes of the Wealth of Nations”, Vol. 1 [1776]. On-line: http://files.libertyfund.org/files/220/0141-02_Bk.pdf Stiglitz J.E. (1994). “Economic Growth Revisited.”
International and Corporate Change 3 (1), p. 65–110.
http://dx.doi.org/10.1093/icc/3.1.65
Thirlwall, A.P. (2011). Economics of Development - Palgrave Macmillan, 2011. 678 p.
Todaro, M.P., Smith, S.C. (2011). Economic Development
(11th Edition) (The Pearson Series in Economics) -
Prentice Hall, 2011. 801 p.
Valtenbergs, V. (2011). Vidzemes ilgtermina attistibas scenariju ieteikumi un rekomendacijas. Prezentacija Vidzemes planosanas regiona attistibas padomes sede. Online: http://www.vidzeme.lv/upload/Prezentacija_ Valtenbergs_31.08.2011_VPR.pdf
World Bank data base. On-line: www.worldbank.org „Rangovije korrljaciji i vzajimostvjazi v pedagogicheskih
eksperimentah. Algoritmika”, Statistika i Teorija Verojatnostej. On-line: http://matstats.ru/rang.html
The article has been reviewed. Received in April, 2012; accepted in June, 2012. Giffinger, R. (2008). Territorial Capital – Understanding and
Challenges for a Knowledge Based Strategic Approach.
Territorium, No.8, 2008, p. 7-15
Goulet, D. (1977). The cruel choice: A new concept in the theory of development. - Atheneum, 1st edition, 360 p. Inglehart, R., Foa, R. (2008). Development, Freedom, and
Rising Happiness: A Global Perspective (1981-2007). The World Values Survey, Association for Psychological Science, Perspectives on Psychological Science Volume 3-Number4. On-line: http://www.worldvaluessurvey. org/wvs/articles/folder_published/article_base_122/files/ RisingHappinessPPS.pdf
Johnson, H.G. (1966). The Neoclassical One-sector Growth Model: A Geometrical Exposition and Extension to a Monetary Economy. Economica, Vol.33, 1966, p.265-287 http://dx.doi.org/10.2307/2552404
Kahneman, D., Deaton, A. (2010). High income improves evaluation of life but not emotional well-being. PNAS, Vol.107, No.38, September 2010 On-line: http://www. pnas.org/content/early/2010/08/27/1011492107 Kahneman, D., Krueger., A.B. (2006). Developments in
the Measurement of Subjective Well-Being. Journal of Economic Perspectives, Vol.20, No.1, Winter 2006, p.3-24 On-line:http://www.krueger.princeton.edu/ PDF%20 of%20 Kahneman%20Krueger%20paper.pdf
Klugman, J. (2011). Human Development Report 2011. United States of America: Palgrave Macmillan, 2011. 178 p.
Krugman, P. (1991). Geography and Trade. MIT Press: Cambridge, 1991
Layard, R. (2005). Happiness: Lessons From a New Science- United States of America: Penguin Books Ltd, 310 p. Malthus T.R. (1798). An essay on the principle of
population. Chapter 1, In Oxford World’s Classics reprint, p.18
“Map of Happiness”. ASEP/JDS data base. On-line: http:// www.jdsurvey.net/jds/jdsurveyActualidad.jsp?Idioma=I &SeccionTexto=0404&NOID=103
Mill J.S. (1859) “On Liberty” ed. Gertrude Himmelfarb - UK: Penguin, 1985, p.83–84
ISSN 1822–8402 EUROPEAN INTEGRATION STUDIES. 2012. No 6
30
Appendix 1
Correlation values of the indices of the newly-created methodological model for measuring territorial development (compiled by the author)
GDP per capita PPP $ 201 1 Population
average annual growth % 2010/2015
Infant
mortality
,
deaths/1000 live births 201
1 Life expectancy , years 201 1
Primary education enrollment, net % 201
1
Tertiary education enrollment, gross % 201
1
Overall life satisfaction 201
1 Index of happiness 1997-2008 Spearman’ s rho GDP
per capita PPP
$ 201 1 Correlation Coefficient 1,000 -,432(**) -,898 (**) ,869 (**) ,566(**) ,730 (**) ,703 (**) ,488(**) Sig. (2-tailed) . ,000 ,000 ,000 ,000 ,000 ,000 ,000 N 93 93 93 93 93 93 93 93
Population average annual growth % 2010/2015
Correlation Coefficient -,432(**) 1,000 ,530(**) -,342(**) -,223(*) -,575(**) -,032 ,176 Sig. (2-tailed) ,000 . ,000 ,001 ,032 ,000 ,761 ,092 N 93 93 93 93 93 93 93 93 Infant mortality
, deaths/1000 live
births 201 1 Correlation Coefficient -,898(**) ,530(**) 1,000 -,887 (**) -,544(**) -,769 (**) -,601(**) -,365(**) Sig. (2-tailed) ,000 ,000 . ,000 ,000 ,000 ,000 ,000 N 93 93 93 93 93 93 93 93 Life expectancy
, years 201
1 Correlation Coefficient ,869(**) -,342(**) -,887(**) 1,000 ,616(**) ,665(**) ,683(**) ,436(**) Sig. (2-tailed) ,000 ,001 ,000 . ,000 ,000 ,000 ,000 N 93 93 93 93 93 93 93 93
Primary education enrollment, net % 201
1 Correlation Coefficient ,566(**) -,223(*) -,544(**) ,616(**) 1,000 ,450(**) ,478(**) ,376(**) Sig. (2-tailed) ,000 ,032 ,000 ,000 . ,000 ,000 ,000 N 93 93 93 93 93 93 93 93
Tertiary education enrollment, gross % 201
1 Correlation Coefficient ,730(**) -,575(**) -,769(**) ,665(**) ,450(**) 1,000 ,493(**) ,206(*) Sig. (2-tailed) ,000 ,000 ,000 ,000 ,000 . ,000 ,048 N 93 93 93 93 93 93 93 93
Overall life satisfaction 201
1 Correlation Coefficient ,703(**) -,032 -,601(**) ,683(**) ,478(**) ,493(**) 1,000 ,497(**) Sig. (2-tailed) ,000 ,761 ,000 ,000 ,000 ,000 . ,000 N 93 93 93 93 93 93 93 93
Index of happiness 1997-2008
Correlation Coefficient ,488(**) ,176 -,365(**) ,436(**) ,376(**) ,206(*) ,497(**) 1,000 Sig. (2-tailed) ,000 ,092 ,000 ,000 ,000 ,048 ,000 . N 93 93 93 93 93 93 93 93