DISPARITIES IN HOSPITALIZATION RATES AMONG PERSONS WITH HIV IN THE UNITED STATES AND CANADA BETWEEN 2005 AND 2015
Thibaut Davy-Mendez
A dissertation submitted to the faculty at the University of North Carolina at Chapel Hill in partial fulfillment of the requirements for the degree of Doctor of Philosophy in the Department of
Epidemiology in the Gillings School of Global Public Health.
Chapel Hill 2020
© 2020
ABSTRACT
Thibaut Davy-Mendez: Disparities in Hospitalization Rates among Persons with HIV in the United States and Canada between 2005 and 2015
(Under the direction of Sonia Napravnik)
Increased antiretroviral therapy (ART) use with potent regimens has increased virologic suppression and life expectancy among persons with HIV (PWH) and might have affected hospitalization rates among different sub-groups of PWH. Among PWH in care in six clinical cohorts in the United States (US) and Canada 2005–2015, we examined (1) racial/ethnic and gender disparities in hospitalization rates, and (2) associations between CD4 cell count and hospitalizations across years of virologic suppression. We used Poisson regression models with robust variances to estimate incidence rate ratios (IRR).
Of 27,085 patients (122,566 person-years), 80% were cisgender men, 1% transgender, 43% White, 33% Black, 17% Hispanic, and 1% Indigenous. Unadjusted all-cause hospitalization rates were higher for Black (IRR 1.46, 95% CI 1.32-1.61) and Indigenous (1.99, 1.44-2.74) versus White cisgender men, and for Indigenous versus White cisgender women (2.55, 1.68-3.89). Unadjusted AIDS-related hospitalization rates were also higher for Black, Hispanic, and Indigenous versus White cisgender men (all P<0.05). Transgender patients had 1.50 times (1.05-2.14) and cisgender women 1.37 times (1.26-1.48) the unadjusted hospitalization rate of cisgender men. In adjusted analyses, among cisgender men and women, Black patients had higher rates of cardiovascular and renal/genitourinary hospitalizations compared to Whites (all P<0.05).
with a current CD4 count 200–350 versus >500 had an adjusted IRR of hospitalization of 1.44 during suppression years 2–5 (95% CI 1.01, 2.06), and 1.67 (1.03, 2.72) during years 6–11. Among patients whose lowest pre-suppression CD4 was ≥200 (56%), during suppression years 6–11, for patients whose current CD4 count 351–500 versus >500, the adjusted hospitalization IRR was 2.09 (1.18, 3.70).
ACKNOWLEDGMENTS
A journey of a thousand miles begins with a single step. This one began when I stepped into Maison d’Hérelle in Montreal, Quebec in 2011, with little more knowledge about HIV than what its letters stood for. I am grateful to Aurélie Bernard and the staff and residents of Maison d’Hérelle for the lessons in solidarity, selflessness, patience, and acceptance that I received as a volunteer.
I am grateful to Ricardo García Bernal for his guidance during my internship with UNAIDS in Panama, and to Cleopatra Mugyenyi for hers during my internship with Liverpool VCT in Kenya. While brief, my time with these two organizations was dense with lessons about HIV, advocacy, public health, and the impact of research. I also want to thank the McGill University Faculty of Arts Internship Office who made these experiences possible.
In 2014, I started working for the UNC Center for AIDS Research. I am forever indebted to Sonia Napravnik and Joe Eron for hiring me, training and teaching me, supporting my
application to graduate school, continuing to mentor me through this day with so much
dedication, while always making me feel like a friend and colleague. I also wish to thank Oksana Zakharova and Ali Fokar, for the help and training they provided before I started graduate school.
I am grateful to the other members of my dissertation committee Steve Berry, Steve Cole, David van Duin, and David Wohl, whose teachings were invaluable during this course of this dissertation work. I have also been inspired and motivated by their work ethic, their
In the UNC Department of Epidemiology, I want to thank Nancy Colvin and Valerie Hudock for their support and patience, the members of the faculty for their dedication to
teaching in a collegial environment, and Andy Olshan and Til Stürmer for their leadership. I also want to thank my fellow classmates and fellow trainees, whose support, friendship, and
guidance made these five years the personally and professionally enriching journey that it was. I am grateful for the recognition and financial support I received during my time at UNC from the UNC Center for AIDS Research (P30AI50410), the UNC HIV/STI Training Program (T32AI007001), the UNC Department of Epidemiology (Nancy A. Dreyer Endowed Scholarship Award, H. Michael and Barbara Arrighi Endowed Scholarship Award), the UNC Graduate School (Graduate Education Advancement Board Impact Award), and the International Antiviral Society-USA (Young Investigator Awards).
I want to thank the NA-ACCORD leadership and Data Management Core for making this dissertation work possible and for their substantial help in preparing the data for analysis.
On a personal note, I want to express my love and gratitude to my parents, Gaëtane and Philippe, my sister, Raphaëlle, my grandparents, Jean, Jacqueline, Max, and Yvette, for their many years of care, love, and support, for their patience and their guidance, and for teaching me the value, pleasure, and privilege of working hard at one’s passion in service of others.
TABLE OF CONTENTS
LIST OF TABLES ... x
LIST OF FIGURES ... xii
LIST OF ABBREVIATIONS ... xiv
CHAPTER I: SPECIFIC AIMS ... 1
CHAPTER II: BACKGROUND ... 4
Mortality among persons with HIV (PWH) ... 4
Morbidity among PWH ... 5
Immune recovery among PWH ... 7
Hospitalizations among PWH ... 9
Summary ...11
CHAPTER III: RESEARCH DESIGN AND METHODS ...13
Study population ...13
Hospitalization data ...14
Data quality control ...14
Hospitalization diagnostic codes ...15
Other study variables ...16
Analysis ...17
Aim 1 ...17
Aim 2 ...18
CHAPTER IV: RACIAL, ETHNIC, AND GENDER DISPARITIES IN HOSPITALIZATION RATES AMONG PERSONS WITH HIV IN THE UNITED STATES AND CANADA, 2005–2015 ...20
Methods ...21
Study population and follow-up ...21
Study measures ...22
Statistical analysis ...23
Results ...23
Study sample ...23
All-cause hospitalization rates over time ...24
Hospitalization rates by gender, race, and ethnicity ...25
Discussion ...26
Tables ...30
Figures ...43
CHAPTER V: CURRENT AND PAST IMMUNODEFICIENCY ARE ASSOCIATED WITH HIGHER HOSPITALIZATION RATES AMONG PERSONS ON VIROLOGICALLY SUPPRESSIVE ANTIRETROVIRAL THERAPY FOR UP TO ELEVEN YEARS ...45
Introduction ...45
Methods ...46
Data source ...46
Patient inclusion and follow-up ...46
Study measures ...47
Statistical analysis ...48
Sensitivity analyses ...49
Results ...49
Study sample ...49
CD4 cell count and hospitalization rates ...51
Sensitivity analyses ...52
Figures ...68
CHAPTER VI: CONCLUSIONS ...72
Summary ...72
Strengths ...73
Limitations ...74
Missing data ...74
Measurement error ...75
Generalizability ...75
Public health significance ...76
Future directions ...77
LIST OF TABLES
Table 3.1. Diagnostic categories and representative diagnoses for hospital
discharge diagnoses. Adapted from Berry et al. 2013 [90]. ...16 Table 4.1. Characteristics of 27,085 patients in care in six NA-ACCORD cohorts
between 2005 and 2015, stratified by race/ethnicity. ...30 Table 4.2. Annual percentage change in rates and incidence rate ratios for
all-cause hospitalizations, stratified by gender, among 26,928 cisgender
patients in HIV care in six NA-ACCORD cohorts between 2005 and 2015. ...31 Table 4.3. Unadjusted incidence rate ratios (IRR) with 95% confidence intervals
for cause-specific hospitalizations. IRR were not estimated for Asian, Indigenous, or multiracial/other cisgender women due to small group
sizes. ...32 Table 4.4. Adjusted incidence rate ratios with 95% confidence intervals for
cause-specific hospitalizations. White cisgender men are the referent category. IRR were not estimated for Asian, Indigenous, or
multiracial/other cisgender women due to small group sizes. ...33 Table 4.5. Distribution of diagnostic categories and most frequent diagnoses for
21,036 hospitalizations taking place among 27,085 patients in care in six
NA-ACCORD cohorts between 2005 and 2015. ...34 Table 4.6. Distribution of diagnostic categories among cisgender men stratified
by race and ethnicity. ...38 Table 4.7. Distribution of diagnostic categories among cisgender women
stratified by race and ethnicity, and among transgender adults. ...39 Table 4.8. Unadjusted all-cause hospitalization rates over 2005–2015, in 2005,
and in 2015, among 27,085 patients in care in six NA-ACCORD cohorts,
stratified by gender and race/ethnicity. ...40 Table 4.9. Incidence rate ratios for all-cause hospitalizations, in a sensitivity
analysis using 18 months to define loss to follow-up. ...41 Table 4.10. Incidence rate ratios and 95% confidence intervals for all-cause and
cause-specific hospitalizations comparing cisgender women and
transgender patients to cisgender men. ...42 Table 5.1. Demographic and clinical characteristics of 6997 patients who
achieved and maintained virologic suppression for at least a year in six NA-ACCORD cohorts, 2005–2014, stratified by lowest known CD4 count
Table 5.2. Incidence rate ratios for all-cause hospitalizations comparing CD4 count categories, stratified by lowest pre-suppression CD4 count, and by
duration of virologic suppression. ...57 Table 5.3. Distribution of diagnostic categories of 2035 hospitalizations with the
three most frequent diagnoses in each category. Diagnosis was missing
for 25 (1%) of hospitalizations. ...58 Table 5.4. Distribution of hospitalizations and person-years, and unadjusted
hospitalization rates per 100 person-years for each CD4 count category
and stratum of analysis. ...61 Table 5.5. Incidence rate ratios for all-cause hospitalizations, censoring
person-time after a chemotherapy hospitalization or CD4 count decline. ...62 Table 5.6. Distribution of hospitalizations and person-time, and hospitalization
rates per 100 person-years, counting only one hospitalization per
six-month interval. ...63 Table 5.7. Incidence rate ratios for all-cause hospitalizations, when including only
one hospitalization per six-month interval. ...64 Table 5.8. Incidence rate ratios for all-cause hospitalizations, when excluding
ART-experienced patients. ...65 Table 5.9. Incidence rate ratios for all-cause hospitalizations, when adjusting for
age using restricted quadratic splines with four equidistant knots. ...66 Table 5.10. Incidence rate ratios for all-cause hospitalizations, among patients
LIST OF FIGURES
Figure 2.1. Age-adjusted mortality rates and life expectancy at age 20 for HIV-infected and HIV-unHIV-infected individuals, Kaiser Permanente California, 1996–2011. Rates are represented by solid lines for HIV-infected and dotted lines for HIV-uninfected individuals (P < 0.001 and P = 0.43 for changes over time, respectively). Life expectancies at age 20 are represented by solid circles for infected and open circles for
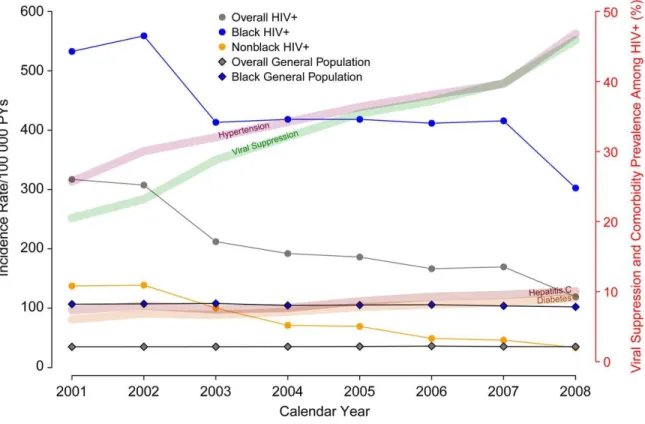
HIV-uninfected individuals. From Marcus et al. 2016 [9]. ... 5 Figure 2.2. Age- and sex-standardized incidence of end-stage renal disease
among human immunodeficiency virus (HIV)-infected adults stratified by race and compared with age- and sex-standardized rates in the general population (US Renal Database System). Incidence rates are 3-year rolling averages. Abbreviation: PY, person-years. From Abraham et al.
2015 [16]. ... 6 Figure 2.3. Plots of predicted median (continuous line) and 5th and 95th
percentiles (dashed line) for recovery in CD4 counts following initiation of combination antiretroviral therapy (cART). Shown are patients initiating cART with a CD4 of 200 (A), 350 (B), and 500 (C) cells/µL. Adapted from
Stirrup et al. 2018 [54] ... 8 Figure 2.4. Unadjusted hospitalization rates by diagnostic categories. *GI/Liver,
0.96 (0.92, 1.00). †Psych, 0.96 (0.93, 1.00). NAD, non–AIDS-defining; GI, gastrointestinal; Psych, psychiatric; Cardiovasc, cardiovascular;
Endo/Met, endocrine/metabolic/nutritional/immune; GU, genitourinary.
Adapted from Berry et al. 2012 [21]. ...10 Figure 3.1. Map showing the location and contribution of sites participating in
NA-ACCORD. From https://statepiaps7.jhsph.edu/naaccord/ ...14 Figure 4.1. Annual all-cause hospitalization rates stratified by race/ethnicity and
gender. Panel A shows unadjusted rates. Panel B shows rates
standardized to the distribution in 2010 in the entire study sample of age, CD4 cell count, HIV viral load, and injection drug use (IDU) as HIV risk factor. Standardization strata were defined according to the following categories: age <40, 40–49, 50–59, and ≥60 years; CD4 count <50, 50– 200, 201–350, 351–500, and >500 cells/μL; HIV viral load <400 and ≥400 copies/mL; IDU risk factor, yes or no. Due to small group sizes, annual rates were not estimated for Asian cisgender women, Indigenous,
multiracial/other, or transgender patients. ...43 Figure 4.2. Percentage of patients in care with HIV RNA viral load <400
copies/mL (A) and median CD4 cell count/μL (B), stratified by
race/ethnicity and gender. Due to small group sizes, estimates are not displayed for Asian cisgender women, Indigenous, multiracial/other, or
Figure 5.2. CD4 cell count distribution from the first HIV viral load <400
copies/mL to Year 10 of sustained virologic suppression, among patients with a lowest pre-suppression CD4 count <200 (A) and ≥200 cells/µL (B). Shown are the median (solid line), interquartile range (band), and 5th and
95th percentiles (dashed lines). CD4 counts are 24-month weighted
moving averages of up to three measurements, updated every six months of virologic suppression. Values for Year 11 are not displayed due to
small sample sizes. ...69 Figure 5.3. Unadjusted all-cause hospitalization rates by CD4 cell count
category, stratified by early (Years 2–5) or long-term (Years 6–11)
virologic suppression, among patients with a lowest pre-suppression CD4 count <200 (A) and ≥200 cells/µL (B). Error bars are the 95% confidence intervals. Rates were not estimated for categories with less than 100
person-years. ...70 Figure 5.4. Inclusion, exclusion, and censoring criteria when censoring
LIST OF ABBREVIATIONS
ACA Patient Protection and Affordable Care Act AIDS Acquired immune deficiency syndrome ART Antiretroviral therapy
CCS Clinical Classifications Software ESLD End-stage liver disease
ESRD End-stage renal disease
HBV Hepatitis B virus
HCV Hepatitis C virus
HIV Human immunodeficiency virus
ICD International Classification of Diseases
MI Myocardial infarction
NA-ACCORD North American AIDS Cohort Collaboration on Research and Design
PWH Person(s) with HIV
CHAPTER I: SPECIFIC AIMS
Clinical management of persons with HIV (PWH) has changed substantially in the past 25 years. The introduction of combination antiretroviral therapy (ART) in 1996 led to drastic decreases in AIDS morbidity and mortality in the United States (US) and Canada [1, 2]. ART initiation early in HIV infection, which prevents AIDS and non-AIDS morbidity and mortality, and the use of safer, more potent ART regimens, which has resulted in improvements in virologic suppression rates, together have contributed to further reductions in mortality [3-12]. Meanwhile, PWH in the US and Canada are aging, with almost half over 50 years of age, and experiencing an increasing burden of comorbidities [13-18].
Hospitalization rates among PWH also decreased with the introduction of ART [19, 20]. However, after 2000, evidence has been mixed as to whether hospitalization rates might be decreasing, plateauing, or even increasing for some causes, possibly due to cumulative exposure to HIV or ART [19-22]. Studies also showed a shift in hospitalization causes from AIDS-defining illnesses to non-AIDS infections and chronic conditions [19, 21]. It is not well-known how hospitalization rates may differ according to race, ethnicity, gender, and the extent of CD4 recovery after viral suppression.
comorbidities [8, 12, 29, 30]. Studies from the 2000s showed hospitalization rate differences across demographic and clinical characteristics [19, 21, 22]. Recent studies have suggested that disparities persist, but these have been limited to particular geographic areas or populations such as veterans [31-33]. In addition, few studies have focused on virologically suppressed PWH [34, 35]. Up-to-date evidence identifying patients at highest risk of hospitalization could inform clinical management strategies to prevent disease progression requiring inpatient care.
The North American AIDS Cohort Collaboration on Research and Design (NA-ACCORD) is a large consortium of HIV cohorts in North America [36]. Five US and one Canadian cohort have collected hospitalization records including discharge diagnoses for the period 2005–2015. In this study, we used NA-ACCORD data to investigate differences in hospitalization rates by gender, race/ethnicity, and CD4 count recovery. Specifically, we pursued the following aims.
Aim 1: Among PWH in care in the US and Canada, assess changes in racial/ethnic and gender disparities in all-cause and cause-specific hospitalization rates across
calendar years 2005–2015. For all-cause hospitalizations, we estimated annual hospitalization
Aim 2: Among PWH in the US and Canada on virologically suppressive ART, estimate the association between CD4 cell count and hospitalization rates. Among
CHAPTER II: BACKGROUND
Mortality among persons with HIV (PWH)
The introduction of combination antiretroviral therapy (ART) in 1996 led to sharp
decreases in mortality among PWH in the United States (US) and Canada, from 30 deaths per 100 person-years in 1995 to 10 deaths per 100 person-years in 1997 [1, 37]. With growing evidence of the benefits of earlier ART initiation, treatment guidelines progressively
recommended ART at higher CD4 cell counts [38, 39]. In 2012, US treatment guidelines began recommending ART for all PWH irrespective of CD4 cell count [3]. Canadian treatment
guidelines have been similar [4]. Guidelines changes led to increased ART use in the US and Canada, with associated improvements in viral suppression and CD4 cell counts [6, 7].
Figure 2.1. Age-adjusted mortality rates and life expectancy at age 20 for infected and HIV-uninfected individuals, Kaiser Permanente California, 1996–2011. Rates are represented by solid lines for HIV-infected and dotted lines for HIV-uninfected individuals (P < 0.001 and P = 0.43 for changes over time, respectively). Life expectancies at age 20 are represented by solid circles for HIV-infected and open circles for HIV-uninfected individuals. From Marcus et al. 2016 [9].
Morbidity among PWH
conditions, have become more frequent, reaching prevalences of 50%, 10%, and 10% in 2008, respectively (Fig. 2.2) [16]. In parallel, the co-occurrence of morbidity, most commonly
hypertension, hypercholesterolemia, and chronic kidney disease, has also increased, with 22% of PWH having more than one comorbidity in 2009 [44]. However, the role of increasing HCV prevalence in liver disease progression is likely to be mitigated by the introduction of direct-acting antiviral agents with high HCV cure rates in both trial and clinical settings, including among PWH [45, 46]. Notably, compared to people with HIV, PWH are at higher risk of
myocardial infarction (MI), ESRD, and all types of cancers, including non-AIDS cancers [14-16, 44]. HIV-related risk factors, such as low CD4 counts, uncontrolled viremia, and history of AIDS, and non-HIV risk factors, such as smoking, have both been shown to contribute to morbidity among PWH [47].
Comorbid burden is not identical in the entire HIV population. PWH who are Black have a higher incidence of ESRD and are at higher risk of developing hypertension, type 2 diabetes, and chronic kidney disease, which are risk factors for developing more severe morbidity [24]. Women are at higher risk of developing ESRD and type 2 diabetes compared to male PWH [16, 24]. In contrast, PWH who develop ESLD are more likely to be male and white [17]. Those with IDU as a risk factor, compared to men who have sex with men (MSM) or heterosexual
transmission, are more likely to experience ESRD and ESLD [16, 17]. Having low CD4 cell counts prior to or during ART or having an unsuppressed viral load both lead to higher incidence of comorbid conditions, including ESRD, ESLD, MI, and several types of cancer [14, 16, 17, 30, 48]. Intuitively, older PWH are also at higher risk of developing severe comorbidities, as well as multimorbidity [14, 16, 17, 44]. These disparities in comorbidities by demographic and clinical characteristics are likely to play a role in the changes of hospitalization rates and causes within different subpopulations of PWH.
Immune recovery among PWH
Initiating ART at higher CD4 cell counts prevents AIDS, severe non-AIDS outcomes, and mortality [8, 11, 40]. For this reason, HIV treatment guidelines recommend universal ART early in HIV infection [49]. However, CD4 counts at HIV entry to care have not increased substantially over time, and about 25% of PWH continue be diagnosed late in HIV infection, with a low CD4 count or rapid progression to AIDS [25, 26, 50]. Black, Hispanic, and Indigenous PWH continue to experience delayed HIV diagnosis or entry to care compared to White PWH [26, 51-53].
ART initiation, those who start treatment more than one year after HIV infection are less likely to experience complete CD4 recovery, with approximately 35% reaching CD4 >900 after four years of ART [27].
Figure 2.3. Plots of predicted median (continuous line) and 5th and 95th percentiles (dashed line) for recovery in CD4 counts following initiation of combination antiretroviral therapy (cART). Shown are patients initiating cART with a CD4 of 200 (A), 350 (B), and 500 (C) cells/µL.
Adapted from Stirrup et al. 2018 [54]
More severe immunodeficiency at ART initiation leads to lower CD4 count recovery during virologic suppression (Fig. 2.3) and leads to chronic immune activation and inflammation [27, 54, 57, 58]. This immune dysfunction leads to tissue damage and contributes to the
development of morbidity [28, 59]. Lower CD4 cell counts prior to and on ART are associated with higher incidence of morbidity, including AIDS-defining opportunistic infections, non-AIDS infections such as bacterial pneumonia, skin and soft tissue infections, and bacteremia, myocardial infarctions, end-stage renal disease, and cancers [8, 12, 16, 29, 30, 60-62].
management of comorbidities such as hypertension, even adjusting for virologic suppression [66].
Hospitalizations among PWH
Rates of hospitalization among PWH in the US and Canada decreased sharply after the introduction of combination ART, though rate estimates vary substantially by region and
population, ranging 15–40 admissions per 100 person-years around the year 2001 [19-22, 67, 68]. After 2000, studies have generally reported either a plateau or a continued decreased in hospitalization rates through the mid- to late 2000s, with estimates ranging 17–27 admissions per 100 persons-years around the year 2008 [19, 21, 22, 69]. Cause-specific hospitalization rates for AIDS-defining conditions and non-AIDS infections have also decreased over time, but some studies have found increasing rates for hospitalizations due to cardiovascular, renal, and pulmonary disease (Fig. 2.4) [19-21]. Among hospitalized patients, AIDS-defining conditions have made up a decreasing proportion of hospital discharge diagnoses, with increasing proportions due to non-AIDS infections, cardiovascular disease, renal disease, and liver/gastrointestinal disease [21, 70-72].
More recent evidence on hospitalization rates in North America is scarce. One study reported a hospitalization rate of 37 admissions per 100 person-years among PWH in New York City in 2013, with 20% due to non-AIDS infections [33]. One study in North Carolina found a persistent decrease in rates reaching 22 admissions per 100 person-years in 2016 [73]. Among veterans with HIV, rates have decreased through 2011 for hospitalizations due to any cause, AIDS-defining conditions, and non-AIDS infections, and increased for admissions due to cardiovascular and renal disease [32]. Outside of North America, an Italian study has reported all-cause hospitalization rates as low as 13 admissions per 100 person-years in 2013–2016, with decreasing rates for most causes [74]. Additional studies have focused on specific
[34, 35, 75, 76]. One study focusing on PWH with CD4>350 did not report any changes in rates over the period 2005–2011 [35].
Figure 2.4. Unadjusted hospitalization rates by diagnostic categories. *GI/Liver, 0.96 (0.92, 1.00). †Psych, 0.96 (0.93, 1.00). NAD, non–AIDS-defining; GI, gastrointestinal; Psych,
psychiatric; Cardiovasc, cardiovascular; Endo/Met, endocrine/metabolic/nutritional/immune; GU, genitourinary. Adapted from Berry et al. 2012 [21].
having a suppressed viral load is associated with lower all-cause hospitalization, as well as hospitalizations for AIDS-defining illnesses, non-AIDS infections, and cardiovascular disease [19, 21, 22]. Several studies have previously reported higher hospitalization rates with CD4 counts below <500 cells/μL, often with progressively higher rates as CD4 counts decrease [19, 21, 22, 31, 35, 78]. However, few studies have examined CD4 counts among patients who are virologically suppressed, and these were limited by shorter follow-up or restricted to special populations, such as young members of the military [34, 76].
In the US, another factor that may have impacted hospitalization rates among PWH is the Patient Protection and Affordable Care Act (ACA), passed in 2010, which included several reforms related to hospitalization. The expansion of Medicaid eligibility in some states led to a drastic increase in Medicaid coverage among PWH from 23% to 38%, and a decrease in the proportion without insurance, from 28% to 13% [79]. The ACA promotes care coordination aiming to prevent hospital admission and readmission, and it instituted Medicare/Medicaid payment penalties for hospitals with excess readmissions [80]. Medicare and Medicaid together insure over half of PWH and reimburse approximately 70% of hospitalizations among PWH [69, 79, 81]. In addition, quality metrics developed by the Centers for Medicare and Medicaid
Services (CMS) also impact health care practices for recipients of other insurance types [82]. The ACA is therefore likely to have affected hospitalization rates among PWH, with potential differences for Black PWH, women, and those with IDU risk factor, who are more likely to be uninsured or receiving Medicaid coverage [22, 79].
Summary
disparities in morbidity between demographic groups and according to clinical history could lead to differences in hospitalization rates among PWH. In the US, changes in health policy might have affected health care access and efforts to prevent hospitalizations, but not equally among all groups of PWH. Yet little is known about hospitalizations among PWH in more recent years, including about causes of hospitalizations and rates in different patient subgroups. This
CHAPTER III: RESEARCH DESIGN AND METHODS
Study population
This dissertation work was based in the North American AIDS Cohort Collaboration on Research and Design (NA-ACCORD) [36]. NA-ACCORD is part of the International
epidemiologic Databases to Evaluate AIDS (IeDEA), a global consortium of data centers funded by the National Institutes of Health to collect and harmonize data on the HIV epidemic [83]. NA-ACCORD comprises 25 prospective clinical and interval cohorts of 190,000 persons with HIV (PWH) in the United States (US) and Canada, including over 200 separate study sites (Fig. 3.1). The granular data of these observational cohorts stem from a combination of electronic medical records, manual review and abstraction of medical information, protocol-adjudicated clinical endpoints, and linked records from state and national death indices. Collected variables include, with variability by site: demographic data, HIV risk factors, laboratory measurements (both HIV- and non-HIV-related), medication history (antiretroviral drugs as well as treatment for other conditions), drug resistance testing, diagnostic history, inpatient services utilization, and geocoded residence data [36, 84, 85].
Overall, participants in NA-ACCORD are approximately 30% women, 45% White, 45% Black, and 10% Hispanic, with a median age close to 50 years [36]. NA-ACCORD is
Figure 3.1. Map showing the location and contribution of sites participating in NA-ACCORD. From https://statepiaps7.jhsph.edu/naaccord/
This study was conducted in six NA-ACCORD clinical cohorts, five in the US and one in Canada, that have collected hospitalization data for the period 2005–2015, including hospital admission and discharge dates and International Classification of Diseases (ICD) codes for discharge diagnoses. Local institutional review boards (IRBs) approved data collection for each cohort, and the University of North Carolina IRB approved these secondary data analyses. Each cohort either obtained written, informed consent from cohort participants, or received a waiver of informed consent from their local IRB.
Hospitalization data Data quality control
additional quality control of hospitalization data by examining discharge diagnoses and crude annual hospitalization rates by cohort. The following exclusion criteria were applied:
Cohorts considered to have substantial data completeness issues were excluded. This included cohorts with >50% annual hospitalization rate change and <1000 participants in care annually; cohorts with >40% annual rate change and 1000–2999 annual participants; cohorts with >30% annual rate change and >3000 annual participants; cohorts with an annual rate <5 per 100 person-years, irrespective of number of participants in care.
Cohorts that did not capture ICD codes for hospital discharge diagnoses were excluded.
Cohorts that recorded discharge diagnoses without a ranking order were excluded. Hospitalizations with identical or overlapping dates were de-duplicated to keep only the hospitalization record with the longest duration. Hospitalizations with same-day discharge were not included as outcomes in any analyses. These are rare events, and for some cohorts these were indistinguishable from outpatient procedures, such as endoscopies.
Hospitalization diagnostic codes
For cause-specific analyses, we assigned the primary discharge diagnosis of
Mappings (GEMs) from the Centers for Medicare and Medicaid Services, with additional manual review by a physician [89]. In order to describe frequent diagnoses within each diagnostic category, a physician combined ICD-9-CM codes into meaningful groups, e.g.
cellulitis/cutaneous abscess. Table 3.1 displays 10 common diagnostic categories and some representative diagnoses they include, adapted from a prior study using this algorithm [90].
For hospitalizations that had more than one ICD code ranked as the top discharge diagnosis, the cause of hospitalization was deemed missing, unless all top-ranked ICD codes were categorized similarly by the CCS program. Hospitalizations with missing causes were included in all-cause analyses but excluded from cause-specific analyses.
Other study variables
Mortality was captured from health records, death certificates, and state and national death indices. Sex, race/ethnicity, and year of birth were collected from electronic health records at cohort entry. Transgender status and HIV risk group were collected from cohort-specific processes including manual chart reviews. CD4 cell count and HIV viral load measurements were captured from electronic health records as they were performed.
Table 3.1. Diagnostic categories and representative diagnoses for hospital discharge diagnoses. Adapted from Berry et al. 2013 [90].
Diagnostic Category Representative Diagnoses
Oncologic Lymphoma, liver cancer, lung cancer
AIDS-defining illness Pneumocystis pneumonia, recurrent bacterial pneumonia, candida esophagitis
Liver/gastrointestinal Pancreatitis, non-infectious gastroenteritis, cirrhosis Renal/genitourinary Acute kidney injury, chronic kidney injury, nephrolithiasis Endocrine/metabolic Hypovolemia, diabetic ketoacidosis, hyponatremia Pulmonary Asthma, chronic obstructive pulmonary disease
Analysis
Aim 1
Patient inclusion and follow-up: We included patients in care at the six eligible cohorts between 2005 and 2015, defined as having at least one HIV RNA or CD4 cell count
measurement in that period. Patients contributed person-time from either NA-ACCORD cohort entry or January 1, 2005, whichever occurred later, and until death, December 31, 2015, or loss to follow-up (LTFU), whichever occurred earlier. LTFU was defined as 12 months without an outpatient HIV RNA or CD4 cell count measurement in primary analyses. Patients who re-entered HIV care could contribute additional person-time. Days spent in the hospital were not counted as person-time at risk. Person-time was then divided into calendar years for analysis, allowing patients to contribute partially to a calendar year.
Study measures: The variables included in this analysis were gender, race/ethnicity, injection drug use (IDU) as HIV risk factor, and time-updated age, CD4 count, and HIV viral load (VL). Age was categorized as <40, 41–50, 51–60, and >60 years. CD4 count was categorized as <50, 51–200, 201–350, 351–500, and >500 cells/µL. VL was dichotomized as <400 or ≥ copies/mL, as that was the lowest level of quantification used by some assays in the study period. Patients missing race/ethnicity were excluded. Person-years missing CD4 count or VL were included in unadjusted analyses but excluded in adjusted analyses.
with an independent correlation matrix were used in all models to account for patients
contributing to more than one hospitalization to analysis. Unadjusted models included only NA-ACCORD cohort as a covariate. Adjusted models also included age, IDU risk factor, CD4 count, and VL. SAS software version 9.4 (SAS Inc., Cary, NC) was used for all analyses. P values were two-sided.
Aim 2
Patient inclusion and follow-up: We included patients who entered NA-ACCORD with a VL >1000 copies/mL and were observed to have a first virologic suppression between 2005 and 2014, defined as two consecutive VL <400 copies/mL at least 30 days apart within 12 months. We excluded patients if they had any VL ≥400 copies/mL or died before experiencing a
complete year of virologic suppression, and patients with no CD4 count prior to suppression. To avoid including immortal person-time, the person-time for analysis began one year after the start of virologic suppression. Person-time was then censored at death, loss to follow-up, virologic failure, or December 31, 2015, whichever occurred first. Loss to follow-up was defined as 12 months without an outpatient CD4 count or VL. Virologic failure was defined as the first of two VL ≥400 copies/mL at least two weeks apart within 90 days, or one VL ≥400 copies/mL with no confirmatory VL in the next 90 days. Person-time was then divided into six-month time intervals from the start of virologic suppression.
least 30 days apart to avoid overweighing CD4 counts measured closely together. We restricted each moving average to three measurements to limit variability in CD4 count frequency. Without this restriction, each moving average calculation would have used a median of five CD4 count measurements (interquartile range 4, 7; range 1, 18). We excluded person-years in time intervals that did not have any CD4 count measured in the prior 24 months.
Statistical analysis: We estimated hospitalization rates by current CD4 count category. Analyses were stratified by lowest CD4 count prior to the start of suppression <200 or ≥200 cells/µL, and by early suppression (Years 2–5) versus long-term suppression (Years 6–11). This approach allowed us to compare patients according to their CD4 cell count trajectories over the duration of suppression. For example, among patients with severe immunodeficiency, i.e. a lowest pre-suppression CD4 count <200 cells/µL, we could compare patients who during years of suppression 6–11 had a CD4 count 351–500 versus >500 cells/µL.
We used Poisson regression models to estimate IRR comparing CD4 count categories within each strata, excluding strata with less than 100 person-years. Unadjusted models included only NA-ACCORD cohort as a covariate. Adjusted models also included age, gender, calendar year, and duration of virologic suppression. Age, calendar year, and duration of virologic suppression were updated for each six-month time interval and included in models as continuous variables. Parametrization approaches such as use of splines were examined. SAS software version 9.4 (SAS Inc., Cary, NC) was used for all analyses. P values were two-sided.
CHAPTER IV: RACIAL, ETHNIC, AND GENDER DISPARITIES IN HOSPITALIZATION RATES AMONG PERSONS WITH HIV IN THE UNITED STATES AND CANADA, 2005–2015
Introduction
Effective combination antiretroviral therapy (ART) use has decreased AIDS-related morbidity, mortality, and hospitalizations among persons with HIV (PWH) in the United States (US) and Canada [1, 19, 20, 37]. Despite these improvements, disparities in hospitalization rates emerged between different sub-populations of PWH. Studies showed that, through the mid-2000s, women and Black PWH continued to be hospitalized 30–40% more frequently than men and White PWH, respectively, overall and for hospitalizations due to non-AIDS-defining infections, cardiovascular, and renal conditions [19, 21, 22].
Changes in HIV care in the last decade might have affected gender, racial, and ethnic disparities in hospitalization rates. PWH are now diagnosed and initiate ART earlier in HIV infection, and are more likely to be virologically suppressed, partly due to more effective ART, with notable reductions in morbidity and mortality [7, 8]. Yet Black, Hispanic, and Indigenous (including Native American, Alaska Native, and Aboriginal individuals) PWH still frequently enter HIV care with a CD4 count <350 cells/μL or an AIDS-defining illness [26, 51, 53]. Women, Black, and Indigenous PWH are more likely to experience viral rebound or unsuppressed viral loads [7, 93], and Black and Indigenous PWH experience worse retention in HIV care [23, 94]. Uncontrolled viremia and resulting immunocompromised status put these patients at continued risk of AIDS and non-AIDS morbidity.
PWH are at higher risk of developing hypertension and type 2 diabetes mellitus, risk factors for cardiovascular events [24]. Women are at higher risk of developing type 2 diabetes mellitus compared to men with HIV [24]. In contrast, PWH who develop end-stage liver disease are more likely to be men and White [17].
It is not known how these trends have affected racial, ethnic, and gender differences in hospitalizations among PWH in the US and Canada, though some studies suggest that
disparities persist [31, 33, 95]. In addition, there is sparse evidence on hospitalization rates among smaller sub-groups of PWH, such as Asian, Hispanic, Indigenous, and transgender individuals. Therefore, we aimed to describe hospitalization rates stratified by racial, ethnic, and gender groups among PWH in clinical care between 2005 and 2015 in the US and Canada.
Methods
Study population and follow-up
Study measures
Annual hospitalization rates were calculated as the number of hospitalizations divided by the person-time in a calendar year, allowing more than one hospitalization per patient.
Hospitalizations with same-day discharge were not counted as outcomes, as these are rare events and could not be distinguished from outpatient procedures (e.g. endoscopies). We used modified Clinical Classifications Software to categorize International Classification of Diseases (ICD), Ninth Revision, Clinical Modification (ICD-9-CM) codes for the primary discharge
diagnosis [21, 87]. Using a validated approach, if the top-ranked diagnosis was HIV or chronic hepatitis C infection, we used the next diagnosis [77]. ICD, Tenth Revision codes (11% of hospitalizations) were converted to ICD-9-CM. Primary analyses examined all-cause
hospitalizations, and secondary analyses examined cause-specific hospitalizations for the ten most frequent categories.
Race, ethnicity, and gender were combined into a composite variable. Transgender patients were identified from locally collected data (n=149), or as individuals with female birth sex reported as being men who have sex with men (MSM) [n=8]. We did not have data on whether transgender patients identified as transfeminine, transmasculine, or non-binary. Because of small numbers, we examined transgender patients in a secondary analysis comparing gender groups. We excluded 972 patients with unknown race and ethnicity.
Statistical analysis
We examined trends in clinical covariates by plotting the proportion of patients with a VL<400 copies/mL and the median CD4 count across calendar years, stratified by race, ethnicity, and gender. For all-cause hospitalizations, we plotted unadjusted and standardized annual rates, stratified by race, ethnicity, and gender. Rates were standardized to the entire sample’s distribution of covariates in 2010, adjusting for changes over time and differences between groups.
We estimated incidence rate ratios (IRR) using Poisson regression models with
generalized estimating equations with an independent correlation matrix to account for patients contributing more than one hospitalization. We fit separate models to estimate calendar time trends stratified by race, ethnicity, and gender, and to compare rates between racial and ethnic groups stratified by gender. Unadjusted models included only NA-ACCORD cohort as a
covariate. Adjusted models included all covariates. IRR for trends were reported as a mean percentage change, e.g. an IRR of 0.95 per one-year increase was reported as a -5% annual rate change. Because of small group sizes, we did not estimate trends and annual rates for Asian, Indigenous, and multiracial/other cisgender women, or for transgender patients. P values were two-sided. Analyses were conducted in SAS, version 9.4 (SAS Institute Inc., Cary, NC).
Results Study sample
The 27,085 included patients contributed 122,566 person-years of follow-up and were 80% cisgender men, 19% cisgender women, and 1% transgender adults. Patients were 43% White, 33% Black, 17% Hispanic of any race, 4% Asian, 1% Indigenous, and 2%
US-based cohort. White patients had higher CD4 counts at cohort entry than other groups (median 425 vs 350–396 cells/μL). Among cisgender men, cisgender women, and transgender patients, respectively, 13, 15, and 18% had a history of IDU, and the median CD4 count at cohort entry was 389, 374, and 369 (not shown). From 2005 to 2015, the proportion of patients with VL<400 copies/mL and median CD4 counts increased in all groups (Figure 4.2).
Of 21,036 included hospitalizations, the most frequent diagnostic category was non-AIDS-defining infection (25%) followed by cardiovascular (10%) [Table 4.5]. Stratified by race, ethnicity, and gender (Tables 4.6 and 4.7), non-AIDS-defining infection was the most common category across all groups. The second most frequent category was psychiatric for Black and multiracial/other cisgender women, and pregnancy for Asian and Indigenous cisgender women.
All-cause hospitalization rates over time
study period, unadjusted hospitalizations rates were 24.7 per 100 person-years (95% CI 18.0-33.8) for Indigenous cisgender men, 42.0 (95% CI 29.7-59.3) for Indigenous cisgender women, and 24.8 (95% CI 17.4-35.5) for transgender patients.
Hospitalization rates by gender, race, and ethnicity
In unadjusted analyses, Black cisgender men had 1.46 times (95% CI 1.32-1.61) and Indigenous cisgender men 1.99 times (95% CI 1.44-2.74) the all-cause hospitalization rates of White cisgender men (Table 4.2). All-cause hospitalization rates were lower for Asian compared to White cisgender men, with an unadjusted IRR of 0.62 (95% CI 0.50-0.75). There was no association between rates and Hispanic ethnicity or multiracial/other race. Estimates were similar in adjusted models. Indigenous cisgender women experienced 2.55 times (95% CI 1.68-3.89) the all-cause hospitalization rate of White cisgender women in unadjusted analyses, and 1.82 times (95% CI 1.27-2.59) in adjusted analyses. Cisgender women in the remaining race and ethnicity groups did not have different hospitalization rates compared to White cisgender women, in unadjusted or adjusted analyses. Using 18 months to define LTFU, IRR estimates were similar to the main findings (Table 4.9).
excluding AIDS-defining cancer. In adjusted analyses (Table 4.4), hospitalization rates for ADI did not differ by race or ethnicity for cisgender men or women, while IRR for other categories were similar to unadjusted estimates.
In analyses comparing gender groups (Table 4.10), cisgender women had higher rates compared to cisgender men for all-cause hospitalization and several diagnostic categories including non-AIDS-defining infection, in both unadjusted and adjusted analyses. In addition, transgender patients had 1.50 times (95% CI 1.05-2.14) the rate of cisgender men for all-cause hospitalizations, and 2.51 times (95% CI 1.35-4.66) for ADI in unadjusted analyses, with similar adjusted estimates.
Discussion
Among US and Canadian PWH in care 2005–2015, unadjusted all-cause hospitalization rates decreased for most racial, ethnic, and gender groups and were highest among Black cisgender women. In adjusted analyses, Black and Indigenous cisgender men were approximately 1.5 times more likely to be hospitalized than White cisgender men, and
transgender patients 1.4 times more likely than cisgender men. Indigenous cisgender women had 1.8 times the adjusted rate of White cisgender women. Adjusted rates were lower for Asian than White cisgender men. In cause-specific analyses, unadjusted hospitalization rates for ADI were higher for Black, Hispanic, and Indigenous versus White cisgender men, and for
transgender patients versus cisgender men. Black cisgender men and women also experienced higher adjusted rates than White counterparts for cardiovascular and renal/genitourinary
conditions.
women compared to men and Black compared to White PWH [31, 33, 95]. A previous NA-ACCORD analysis found a small decrease in adjusted rates over time overall [96]. In this study, there was no change in adjusted rates stratified by race, ethnicity, and gender, possibly from reduced sample size when examining individual groups.
Differences in HIV treatment outcomes likely contributed to the hospitalization disparities we observed. Prior studies have shown that women and transgender patients, compared to men, and Black and Indigenous PWH, compared to White PWH, are more likely to experience unsuppressed viral loads or viral rebound [7, 93, 97]. HIV care interruptions occur more frequently among Black and Indigenous than White PWH [23, 94]. Although earlier initiation of ART can prevent AIDS and non-AIDS morbidity, Black, Hispanic, and Indigenous PWH continue to experience delayed HIV diagnosis or entry to care compared to White PWH, with a low CD4 count or an ADI diagnosis [8, 26, 51-53]. Ongoing viral replication and severe immunodeficiency also contribute to end-organ damage, immune dysregulation, and inflammation, which can lead to further non-AIDS morbidity, including myocardial infarction and HIV-associated nephropathy [30, 98]. In our study, while median CD4 counts and viral suppression rates increased for all patients, they were lowest for Black and Hispanic cisgender women. These clinical differences can therefore partly explain the higher unadjusted hospitalization rates experienced by some racial, ethnic, and gender groups, for all-cause but also ADI and other hospitalization causes.
rates in these categories and overall. In addition, PWH with IDU as an HIV risk factor, as opposed to sexual transmission, are more likely to develop end-stage renal and liver diseases, partly due to hepatitis C virus co-infection [16, 17]. Ongoing IDU can also cause non-AIDS-defining infections, including sepsis/bacteremia and cellulitis/cutaneous abscesses. Over 30% of indigenous patients in our study had IDU history and potentially ongoing use, which might explain higher rates for hospitalizations for liver/gastrointestinal conditions and non-AIDS-defining infections. Obesity might also have contributed to hospitalization differences, as it is more common among women, Black, and Hispanic PWH and is a risk factor for
cellulitis/cutaneous abscesses and progression of infections to sepsis [99, 100].
In addition to differences in HIV care outcomes and chronic conditions, unmet social needs might contribute to disparities in hospitalization rates. Out-of-pocket health expenses, difficulty finding transportation to clinic, or lapses in insurance coverage can prevent PWH from accessing both HIV and non-HIV care [101, 102]. Caregivers, frequently women, might be unable to seek outpatient care for themselves because of their care responsibilities to others [103]. Vulnerable populations, such as people who use drugs and Indigenous, transgender, and immigrant PWH, might delay accessing care because of discrimination or stigma [104-108]. Other barriers, including mental illness, homelessness, and food insecurity, have been associated with poorer health outcomes among PWH and could lead to more frequent hospitalizations [109, 110]. Some PWH might also lack a support network to assist with outpatient management of illness, requiring inpatient admission. Efforts should continue to be made to provide safe environments and culturally competent care, as well as resources to mitigate structural factors leading to poorer health outcomes. For example, interventions providing medication-assisted treatment for opioid use disorder in an HIV clinic and culturally competent care to Hispanic PWH can improve visit attendance [111, 112].
important changes in HIV care, such as expansion of ART to all PWH and the introduction of integrase inhibitors, and provides the most recent evidence on racial, ethnic, and gender
hospitalization disparities among PWH in this region. Patients in this study were engaged in HIV care, therefore our findings may not be generalizable to all PWH. Nonetheless, our study
sample included a racially diverse population, in different geographic areas, receiving care coverage through integrated health systems, private insurers, US Medicaid and Medicare, and Canadian provincial health systems.
To our knowledge, this is the first large study to report that Indigenous and transgender PWH bear a particularly high burden of hospitalizations. However, it is likely that not all
transgender patients in our sample were identified, and we were not able to examine
transgender men, women, and non-binary individuals separately. In addition, race and ethnicity do not fully capture the lived experiences of PWH, especially across different parts of the US and Canada. We did not capture data on immigration status, which could lead to heterogeneity in health outcomes within a racial or ethnic group. Data on important barriers to care and hospitalization risk factors, such as socioeconomic status and mental health disorders were not available in this study. Future studies should continue to examine drivers of racial, ethnic, and gender disparities in hospitalizations among PWH and evaluate interventions addressing them.
Tables
Table 4.1. Characteristics of 27,085 patients in care in six NA-ACCORD cohorts between 2005 and 2015, stratified by race/ethnicity. White N=11,526 Black N=8947 Hispanic, any race N=4611 Asian N=1052 Indigenous N=320 Multiracial or other N=629 Characteristic No. (%) or
median (IQR)
No. (%) or median (IQR)
No. (%) or median (IQR)
No. (%) or median (IQR)
No. (%) or median (IQR)
No. (%) or median (IQR) Gender
Cisgender men 10,507 (91%) 5803 (65%) 3786 (82%) 925 (88%) 225 (70%) 515 (82%) Cisgender
women
975 (8%) 3095 (35%) 782 (17%) 115 (11%) 91 (28%) 109 (17%)
Transgender a 44 (<1%) 49 (<1%) 43 (1%) 12 (1%) 4 (1%) 5 (<1%)
HIV acquisition risk factor
MSM 7942 (69%) 2556 (29%) 2530 (55%) 722 (69%) 90 (28%) 362 (58%)
IDU 1506 (13%) 1450 (16%) 449 (10%) 52 (5%) 114 (36%) 45 (7%)
Heterosexual or other
2078 (18%) 4941 (55%) 1632 (35%) 278 (26%) 116 (36%) 222 (35%) Enrolled in a United
States based cohort
10,119 (88%) 8395 (94%) 4543 (99%) 925 (88%) 91 (28%) 602 (96%) Age at study start,
years
42 (35, 50) 41 (32, 48) 39 (32, 47) 37 (31, 44) 36 (30, 43) 38 (30, 46) CD4 count at cohort
entry, b cells/µl
425 (233, 628) 350 (158, 548) 372 (184, 573) 372 (210, 550) 307 (177, 510) 396 (231, 607)
Abbreviations: IDU, injection drug use; MSM, men who have sex with men; NA-ACCORD, North American AIDS Cohort Collaboration on Research and Design.
Table 4.2. Annual percentage change in rates and incidence rate ratios for all-cause
hospitalizations, stratified by gender, among 26,928 cisgender patients in HIV care in six NA-ACCORD cohorts between 2005 and 2015.
Gender a &
Race/ethnicity
Annual Percentage
Change (95% CI) Incidence Rate Ratio (95% CI) Unadjusted b Adjusted c Unadjusted d Adjusted e
Cisgender men
White -3 (-4, -2) -1 (-2, 1) 1 (ref.) 1 (ref.)
Black -6 (-7, -4) -2 (-4, 0) 1.46 (1.32, 1.61) 1.27 (1.14, 1.41) Hispanic, any race -5 (-7, -3) -2 (-4, 1) 1.01 (0.90, 1.13) 0.98 (0.87, 1.10) Asian -2 (-8, 4) 0 (-6, 7) 0.62 (0.50, 0.75) 0.64 (0.53, 0.78) Indigenous 1 (-7, 9) 4 (-5, 14) 1.99 (1.44, 2.74) 1.62 (1.18, 2.22) Multiracial or other 4 (-3, 11) 6 (-1, 14) 0.82 (0.53, 1.28) 0.88 (0.57, 1.38) Cisgender women
White -7 (-10, -3) -2 (-6, 2) 1 (ref.) 1 (ref.)
Black -5 (-7, -3) -2 (-5, 0) 1.13 (0.94, 1.35) 1.15 (0.97, 1.37) Hispanic, any race -5 (-8, -1) -2 (-6, 2) 1.10 (0.88, 1.38) 1.11 (0.89, 1.38)
Asian f 0.68 (0.43, 1.08) 0.74 (0.47, 1.15)
Indigenous f 2.55 (1.68, 3.89) 1.88 (1.31, 2.68)
Multiracial or other f 0.70 (0.35, 1.39) 0.80 (0.41, 1.56)
Abbreviations: CI, confidence interval; IDU, injection drug use; NA-ACCORD, North American AIDS Cohort Collaboration on Research and Design; ref., referent.
a Transgender patients were identified from locally collected data or as individuals with reported female sex and being men who have sex with men.
b Estimates and 95% confidence intervals from separate Poisson regression models with generalized estimating equations to account for patients contributing more than one hospitalization to the analysis. Models are adjusted for NA-ACCORD cohort only.
c Estimates and 95% confidence intervals from separate Poisson regression models with generalized estimating equations, adjusted for NA-ACCORD cohort, calendar year, IDU risk factor, and annually-updated age, CD4 cell count, and HIV viral load.
d Estimates and 95% confidence intervals from two Poisson regression models with generalized estimating equations, stratified by gender, adjusted for NA-ACCORD cohort only.
e Estimates and 95% confidence intervals from two Poisson regression models with generalized estimating equations, stratified by gender, adjusted for NA-ACCORD cohort, calendar year, IDU risk factor, and annually-updated age, CD4 cell count, and HIV viral load.
Table 4.3. Unadjusted incidence rate ratios (IRR) with 95% confidence intervals for cause-specific hospitalizations. IRR were not estimated for Asian, Indigenous, or multiracial/other cisgender women due to small group sizes.
Cisgender men (compared to White cisgender men) a Cisgender women (compared to White cisgender women) a
Diagnostic category b Black Hispanic, any
race Asian Indigenous
Multiracial or
other Black
Hispanic, any race Non-AIDS-defining
infection
1.35 (1.19, 1.54) 1.01 (0.86, 1.19) 0.69 (0.52, 0.93) 3.03 (2.02, 4.56) 0.90 (0.55, 1.49) 1.04 (0.81, 1.35) 0.99 (0.72, 1.37)
Cardiovascular 1.58 (1.23, 2.01) 0.88 (0.67, 1.15) 0.43 (0.26, 0.71) 1.25 (0.47, 3.35) 1.04 (0.36, 3.00) 1.84 (1.10, 3.08) 1.45 (0.89, 2.37) Liver/ gastrointestinal 1.15 (0.92, 1.45) 1.20 (0.95, 1.52) 0.44 (0.26, 0.74) 2.17 (1.16, 4.08) 1.13 (0.61, 2.09) 1.15 (0.76, 1.72) 1.60 (1.01, 2.53) Psychiatric 1.24 (0.92, 1.67) 0.82 (0.58, 1.14) 0.83 (0.48, 1.43) 1.16 (0.52, 2.59) 0.89 (0.40, 1.99) 0.52 (0.34, 0.78) 0.69 (0.26, 1.82) AIDS-defining illness 1.90 (1.43, 2.51) 1.77 (1.33, 2.35) 1.17 (0.50, 2.76) 2.79 (1.50, 5.22) 1.00 (0.39, 2.55) 0.89 (0.57, 1.37) 0.93 (0.54, 1.61) Neoplasms excluding
AIDS-defining cancer
0.98 (0.75, 1.28) 0.92 (0.66, 1.27) 0.43 (0.20, 0.95) 1.51 (0.46, 4.99) 0.12 (0.03, 0.47) 1.80 (1.13, 2.87) 2.09 (1.14, 3.84)
Injury/poisoning/ complications of therapy
1.21 (0.98, 1.49) 0.75 (0.59, 0.97) 0.56 (0.34, 0.92) 1.49 (0.84, 2.62) 0.65 (0.31, 1.36) 0.70 (0.47, 1.05) 0.64 (0.38, 1.09)
Renal/genitourinary 3.35 (2.66, 4.21) 1.65 (1.17, 2.32) 0.68 (0.31, 1.49) 1.73 (0.59, 5.09) 0.58 (0.22, 1.55) 1.97 (1.28, 3.04) 0.96 (0.52, 1.75) Endocrine/metabolic c 2.02 (1.51, 2.70) 1.11 (0.79, 1.56) 0.52 (0.26, 1.03) 0.30 (0.04, 2.10) 0.54 (0.22, 1.33) 1.15 (0.71, 1.87) 0.68 (0.36, 1.29) Pulmonary 1.75 (1.22, 2.49) 0.85 (0.55, 1.31) 0.28 (0.12, 0.70) 1.60 (0.74, 3.48) 0.67 (0.26, 1.72) 1.84 (1.03, 3.29) 1.93 (1.02, 3.66)
Abbreviations: ICD-9-CM, International Classification of Disease, Ninth Revision, Clinical Modification; IDU, injection drug use; NA-ACCORD, North American AIDS Cohort Collaboration on Research and Design.
a Transgender patients were identified from locally collected data or as individuals with reported female sex and being men who have sex with men. Estimates and 95% confidence intervals from separate Poisson regression models, stratified by gender, with generalized estimating equations to account for patients contributing more than one hospitalization to the analysis. Models are adjusted for NA-ACCORD cohort only.
b Shown are the ten most frequent diagnostic categories, ordered by frequency. We used modified Clinical Classifications Software to categorize ICD-9-CM codes for primary discharge diagnoses. Discharge diagnosis was missing for 204 hospitalizations.
Table 4.4. Adjusted incidence rate ratios with 95% confidence intervals for cause-specific hospitalizations. White cisgender men are the referent category. IRR were not estimated for Asian, Indigenous, or multiracial/other cisgender women due to small group sizes.
Cisgender Men (compared to White cisgender men) a Cisgender Women (compared to White cisgender women) a Diagnostic category b Black Hispanic, any
race Asian Indigenous
Multiracial or
Other Black Hispanic
Non-AIDS-defining infection
1.14 (0.99, 1.30) 0.92 (0.79, 1.08) 0.67 (0.50, 0.88) 2.12 (1.46, 3.10) 0.92 (0.56, 1.50) 1.07 (0.83, 1.37) 1.01 (0.74, 1.39)
Cardiovascular 1.61 (1.23, 2.10) 1.07 (0.81, 1.40) 0.58 (0.35, 0.94) 1.46 (0.51, 4.19) 1.40 (0.49, 4.01) 1.92 (1.13, 3.25) 1.51 (0.92, 2.48) Liver/ gastrointestinal 1.04 (0.80, 1.34) 1.19 (0.94, 1.51) 0.47 (0.28, 0.78) 1.98 (1.05, 3.76) 1.25 (0.68, 2.33) 1.09 (0.73, 1.62) 1.52 (0.96, 2.41) Psychiatric 1.17 (0.86, 1.58) 0.75 (0.53, 1.05) 0.74 (0.43, 1.29) 0.93 (0.40, 2.15) 0.83 (0.37, 1.87) 0.64 (0.43, 0.95) 0.86 (0.31, 2.35) AIDS-defining illness 1.17 (0.87, 1.59) 1.29 (0.98, 1.70) 1.01 (0.42, 2.42) 1.43 (0.80, 2.57) 0.86 (0.35, 2.11) 0.86 (0.58, 1.27) 0.89 (0.53, 1.51) Neoplasms excluding
AIDS-defining cancer
0.82 (0.61, 1.11) 0.92 (0.65, 1.31) 0.49 (0.23, 1.08) 1.50 (0.45, 4.97) 0.14 (0.03, 0.56) 1.78 (1.11, 2.85) 2.04 (1.11, 3.76)
Injury/poisoning/ complications of therapy
1.22 (0.98, 1.52) 0.81 (0.63, 1.04) 0.64 (0.38, 1.05) 1.52 (0.86, 2.68) 0.77 (0.37, 1.59) 0.72 (0.48, 1.09) 0.65 (0.38, 1.12)
Renal/ genitourinary 2.89 (2.24, 3.72) 1.66 (1.17, 2.35) 0.74 (0.34, 1.64) 1.55 (0.52, 4.58) 0.67 (0.25, 1.79) 2.03 (1.31, 3.16) 0.99 (0.53, 1.83) Endocrine/Metabolic c 1.79 (1.33, 2.42) 1.09 (0.76, 1.55) 0.56 (0.28, 1.10) 0.29 (0.04, 1.99) 0.60 (0.25, 1.49) 1.07 (0.65, 1.77) 0.63 (0.33, 1.22) Pulmonary 1.67 (1.11, 2.51) 0.91 (0.58, 1.43) 0.33 (0.13, 0.82) 1.39 (0.62, 3.12) 0.84 (0.33, 2.14) 1.87 (1.06, 3.32) 1.81 (0.95, 3.43)
Abbreviations: ICD-9-CM, International Classification of Disease, Ninth Revision, Clinical Modification; IDU, injection drug use; NA-ACCORD, North American AIDS Cohort Collaboration on Research and Design.
a Transgender patients were identified from locally collected data or as individuals with reported female sex and being men who have sex with men. Estimates and 95% confidence intervals from separate Poisson regression models, stratified by gender, with generalized estimating equations to account for patients contributing more than one hospitalization to the analysis. Models are adjusted for NA-ACCORD cohort, calendar year, IDU risk factor, and annually-updated age, CD4 cell count, and HIV viral load.
b Shown are the ten most frequent diagnostic categories, ordered by frequency. We used modified Clinical Classifications Software to categorize ICD-9-CM codes for primary discharge diagnoses. Discharge diagnosis was missing for 204 hospitalizations.
c Includes diabetes-related hospitalizations.
Table 4.5. Distribution of diagnostic categories and most frequent diagnoses for 21,036 hospitalizations taking place among 27,085 patients in care in six NA-ACCORD cohorts between 2005 and 2015.
Diagnostic category (italic) or diagnosis (Roman)
No. (% of hospitalizations
or of category)
ICD-9 codes
Non-AIDS-defining infection 5274 (25%)
Sepsis and bacteremia 1179 (22%) 003.1, 038.0–038.9, 788.52, 790.7, 995.91, 995.92
Bacterial pneumonia 956 (18%) 481–486
Cellulitis and cutaneous abscess 658 (12%) 035, 680.0–686.9
Cardiovascular 2132 (10%)
Congestive heart failure 441 (21%) 398.91, 402.00–404.93, 428.0– 428.9 Acute ischemic events including
myocardial infarction and unstable angina
265 (12%) 410.00–411.89
Chest pain 224 (11%) 413.9, 786.50–786.59
Liver/gastrointestinal 1841 (9%)
Acute or chronic pancreatitis 295 (16%) 577.0–577.2
Gastrointestinal bleed, upper or lower tract
168 (9%) 456.0, 531.00, 531.01, 531.20, 531.21, 531.40, 531.41, 531.60, 531.61, 532.00, 532.01, 532.20, 532.21, 532.40, 532.41, 532.60, 532.61, 533.00, 533.01, 533.20, 533.21, 533.40, 533.41, 533.60, 533.61, 534.00, 534.01, 534.20, 534.21, 534.40, 534.41, 534.60, 534.61, 537.83, 562.03, 562.12, 562.13, 569.85, 569.3, 578.0–
578.9
Appendicitis 129 (7%) 540.0–542
Psychiatric 1675 (8%)
Major depressive disorder, single or recurrent episode
316 (19%) 296.20–296.36
Bipolar disorder 200 (12%) 296.40–296.89
AIDS-defining illness 1373 (7%)
Pneumocystis jirovecii pneumonia
247 (18%) 136.3
Burkitt lymphoma 161 (12%) 200.20–200.28
Bacterial pneumonia, recurrent a 153 (11%) 481–486
Neoplasms excluding AIDS-defining cancer
1270 (6%)
Non-Hodgkin's lymphoma 296 (23%) 153.5, 153.9, 202.80–202.88
Leiomyoma of the uterus 73 (6%) 218.0–218.9
Lung Cancer 70 (6%) 162.2–162.9, V10.11
Injury/poisoning/complication of therapy
1112 (5%)
Femoral neck fracture 49 (4%) 820.03, 820.20, 820.21
Poisoning by cocaine,
amphetamine, or other stimulant
47 (4%) 969.7, 969.72, 970.1, 970.8, 970.81, 970.89
Ankle fracture 42 (4%) 824.0–824.8
Renal/genitourinary 1078 (5%)
Acute renal failure 523 (49%) 584.9
Chronic (including end-stage) renal disease
202 (19%) 403.00–403.91, 585–585.9
Calculus of kidney or ureter 82 (8%) 592.0–592.9
Endocrine/metabolic 992 (5%)
Diabetes mellitus, not diabetic ketoacidosis or hyperosmolar state
334 (34%) 249.00–250.93
Hypovolemia 73 (7%) 276.50–276.52
Hyperkalemia 64 (6%) 276.7
Pulmonary 953 (4%)
COPD exacerbation 231 (24%) 491.0–492.8
Asthma exacerbation 213 (22%) 493.00–493.92
Acute respiratory failure 187 (20%) 518.81–518.89, 786.09
Musculoskeletal 710 (3%)
Aseptic necrosis of head and neck of femur
Osteoarthritis of the lower leg 90 (13%) 715.16, 715.26, 715.36, 715.96, 715.97 Osteoarthritis of the pelvis and/or
thigh
70 (10%) 715.15, 715.25, 715.35, 715.95
Symptoms 620 (3%)
Fever 120 (19%) 780.6, 780.60, 780.61
Abdominal pain 91 (15%) 789.00–789.09
Rehabilitative care 64 (10%) V57.89, V57.9
Pregnancy 569 (3%)
Delivery in the setting of other viral disease
86 (15%) 647.61
Delivery in the setting of previous cesarean delivery
69 (12%) 654.21
Delivery in the setting of abnormal fetal heart rate or rhythm
32 (6%) 659.71
Neurological 504 (2%)
Epilepsy 96 (19%) 345.00–345.91
Other convulsions 52 (10%) 780.39
Headache 47 (9%) 784.0
Hematological 453 (2%)
Neutropenia 65 (14%) 288.00
Immune thrombocytopenic purpura
46 (7%) 287.31
Anemia, unspecified 43 (9%) 285.9
Dermatological 84 (<1%)
Lower extremity (non-pressure) ulcer
22 (26%) 707.10–707.19
Pressure ulcer 14 (17%) 707.00–707.05, 707.23
Stevens-Johnson Syndrome/toxic epidermal necrolysis
7 (8%) 693.13–693.15
Congenital 24 (<1%)
Anomalies of cerebrovascular system
3 (13%) 747.81
Congenital insufficiency of aortic valve
2 (8%) 746.4
Other residual codes 360 (2%)
Accidents occurring in residential institution
76 (21%) E849.7
Personal history of
noncompliance with medical treatment, presenting hazards to health
67 (19%) V15.81
Home accidents 57 (16%) E849.0
Abbreviations: AIDS, acquired immunodeficiency syndrome; COPD, Chronic Obstructive
Pulmonary Disease; ICD-9-CM, International Classification of Diseases, Ninth Revision, Clinical Modification.
Table 4.6. Distribution of diagnostic categories among cisgender men stratified by race and ethnicity.
Cisgender Men
Diagnostic category a
White N=6639 Black N=5252 Hispanic N=2320 Asian N=298 Indigenous N=246 Multiracial/ Other N=182 Non-AIDS-defining infection
24% 26% 27% 28% 35% 30%
Cardiovascular 11% 11% 9% 8% 6% 13%
Liver/gastrointestinal 8% 10% 12% 7% 10% 13%
Psychiatric 8% 9% 6% 12% 7% 8%
AIDS-defining illness 7% 5% 9% 8% 9% 7%
Neoplasms excluding AIDS-defining cancer
5% 7% 7% 5% 5% 1%
Injury/poisoning/ complication of therapy
5% 7% 5% 6% 6% 5%
Renal/genitourinary 8% 3% 5% 3% 2% 2%
Metabolic/endocrine 6% 4% 5% 3% <1% 3%
Pulmonary 5% 4% 3% 2% 4% 3%
Musculoskeletal 3% 5% 2% 2% 3% 4%
Symptoms 3% 3% 2% 5% 4% 3%
Pregnancy <1% <1% 0 0 0 0
Neurological 3% 2% 2% 3% 2% 4%
Hematological 2% 2% 3% 2% 2% 1%
Dermatological 1% <1% <1% 0 2% 0
Congenital <1% <1% <1% <1% 0 1%
Other 1% 2% 2% 5% 1% 2%
Abbreviations: ICD-9-CM, International Classification of Disease, Ninth Revision, Clinical Modification; NA-ACCORD, North American AIDS Cohort Collaboration on Research and Design.
Table 4.7. Distribution of diagnostic categories among cisgender women stratified by race and ethnicity, and among transgender adults.
Cisgender Women
Trans-gender, Any race N=144 Diagnostic
category a
White N=994 Black N=3743 Hispanic N=930 Asian N=74 Indigenous N=152 Multiracial/ Other N=62 Non-AIDS-defining infection
24% 23% 23% 23% 35% 29% 25%
Cardiovascular 6% 10% 9% 9% 1% 0 6%
Liver/
gastrointestinal
6% 7% 8% 9% 7% 10% 2%
Psychiatric 14% 6% 5% 7% 13% 18% 10%
AIDS-defining illness
7% 6% 7% 3% 3% 3% 12%
Neoplasms excluding AIDS-defining cancer
3% 6% 7% 1% 1% 10% 5%
Injury/poisoning/ complication of therapy
6% 4% 3% 0 5% 0 6%
Renal/ genitourinary
4% 6% 3% 3% 3% 3% 8%
Metabolic/ endocrine
4% 5% 4% 5% 0 3% 8%
Pulmonary 3% 6% 8% 0 4% 5% 8%
Musculoskeletal 3% 2% 3% 3% 1% 2% 3%
Symptoms 2% 3% 3% 1% 3% 2% 2%
Pregnancy 8% 9% 9% 22% 18% 15% 0
Neurological 3% 2% 4% 0 1% 0 1%
Hematological 2% 3% 3% 5% 2% 0 1%
Dermatological <1% <1% <1% 0 0 0 1%
Congenital <1% 0 <1% 0 0 0 0
Other 2% 1% 1% 7% 2% 2% 2%
Abbreviations: ICD-9-CM, International Classification of Disease, Ninth Revision, Clinical Modification; NA-ACCORD, North American AIDS Cohort Collaboration on Research and Design.