66
Measuring gas demand security using Principal Component
Analysis: A case study
Pourya Souri
1*, Hadi Sahebi
21 Department of Industrial Engineering & Management Systems, Amirkabir University of Technology,
Tehran, Iran
2 School of Industrial Engineering, Iran University of Science and Technology, Tehran, Iran
[email protected], [email protected]
Abstract
Safeguarding the energy security is an important energy policy goal of every country. Assuring sufficient and reliable resources of energy at affordable prices is the main objective of energy security. Due to such reasons as special geopolitical position, terrorist attacks and other unrest in the Middle East, securing Iran’s energy demand and increasing her natural gas exports have turned into a critical issue. The aim of this paper is to develop a composite index for evaluating the gas demand security. To this purpose, six individual indices (i.e. gas exports dependency, transportation cost, economic dependency, political stability of the exporting country, political stability of the importing country, and the purchasing power of the importing country) are identified and the Principle Component Analysis (PCA) method is employed to weigh and combine the indices into GDSI (Gas Demand Security Index). The results show an interesting counter-intuitive phenomenon that the political stability of the importing and exporting countries have respectively the most and the least effects on the obtained composite index.
Keywords:
Gas demand security index, natural gas export, Principal Component Analysis (PCA)1-Introduction
Natural gas has become the third most consumed energy in the world, and its share in the global energy consumption has reached the point 23.7% (BP statistical review of world energy. 2002-2014, 2014). The level of natural gas consumption has increased from 1960.14 bcm (billion cubic meters) in 1990 to 3468.6 bcm in 2015 and raised to around 3630 bcm in 2016, with expected increase rate of 1.6% per year (Gas. Analysis and Forecasts to 2022, 2017). Due to its flexibility, versatility, reliability, high efficiency, easy storage and transportation, capability of being highly compressed, and having less environmentally harmful impacts, compared to other fuels, natural gas is gaining much share in the global energy mix in the recent years (International Energy Agency (IEA), 2014).
It is anticipated that the natural gas consumption will have the fastest growing rate among other energy sources and is estimated to triple by 2025 in the Asian emerging markets which are going to be the center of this growth (Energy Information Administration (EIA), 2005).
*Corresponding author
ISSN: 1735-8272, Copyright c 2019 JISE. All rights reserved
Journal of Industrial and Systems Engineering
Vol. 12, Special issue on Statistical Processes and Statistical Modeling, pp. 66-80 Winter (January) 2019
67
China is taking EU’s place to become the second largest market in terms of natural gas consumption after US (Zhi-Guo, Cheng and Dong-Ming, 2018).
Considering the rich reserves of natural gas, high success rate in the new gas fields exploration, and increasing growth of fossil fuels demand in highly import dependent countries such as China, European Union, India, and Turkey which are potential markets for Iran’s natural gas export (through pipelines or in the LNG form), There is a promising outlook for Iran’s natural gas exports.
However, recent political instabilities, natural disasters, and terrorist attacks in some exporting/ importing countries of the Middle East have caused the energy security to be considered in different countries in its various supply chain layers including production, distribution, conversion, transportation, supply, and demand. Out of these layers, supply and demand are more important and have been addressed more both politically and strategically because factors affecting them are mostly out of a government’s control; they highly depend on the energy exporting/importing country. On the other hand, energy experts believe that use of oil or gas weapon by a major oil or gas exporting country is a threat to world’s energy security (Alhajji, 2007). Hence, securing energy demand and increasing natural gas exports of Iran has become an interesting topic because of her specific geopolitical position and other reasons mentioned earlier.
The 2017 and 2018 World Economic Forum reports (The Global Risks, 2017), and (The Global Risks, 2018) clearly suggest various environmental, geopolitical, and social risks could bring economics insecurities. Therefore, for all gas exporting countries, including Iran, demand security is important. This paper aims to quantify and evaluate this security based on six individual indices: dependency on gas export, transportation cost, economic dependency, exporting country’s political stability, importing country’s political stability, and the purchasing power of the importing country. The gas demand security depends on various factors ought to be considered collectively not individually. In other words, due to the correlation between the individual indices, determining the impact of each one on the gas demand security without considering other indices is impossible and we need to address the issue through a holistic approach. To determine the GDSI by weighting and combining the individual indices, the PCA method is employed to calculate the weights and avoid assigning ad hoc and arbitrary weights to the indices. The 1993-2015 time series data of each index on an annual basis are used as the input variables for the PCA method. The GDSI measures the gas demand security of Iran quantitatively with higher values meaning higher demand security against disruptions and shocks in the demand. We also calculate the contribution of each individual index in determining the proposed model. Through the proposed GDSI, policy-makers can analyze Iran’s gas demand security status in the future under different scenarios and select the potential energy markets to maximize the value of GDSI.
The scientific originality of this paper lays in considering demand side of a country’s energy security performance for the first time using composite index.
The rest of the paper has been structured as follows: Section 2 presents the literature on the energy supply and demand security. Section 3 discusses Iran’s status in terms of production, consumption, and major gas importers and the methodology used for the selection of individual indices. Section 4 constructs the GDSI using PCA method and analyzes the results. Section 5 discusses the numerical results and finally Section 6 presents conclusions and provides ideas for further researches.
2-Literature review
Energy security means ensuring the adequate amount of energy for people, economic and social activities, and defensive targets at a reasonable price (Koyama and Kutani, 2012). Although there are a large number of energy security definitions provided by researchers and policy-makers, there is no precise definition mainly due to its multidimensional and esoteric nature. Majority of studies address the energy supply security or energy security in its general form. Accordingly, it is possible to define the energy demand security as the “availability of a sustainable and continuous demand for energy exports at a market price that covers the transaction and production costs” (Dike, 2013).
68
One can classify the related studies at the micro level (rural areas, villages, islands, etc.) or at the macro level (a country or a set of countries) utilizing individual or composite indicators, type of energy examined, and the focus on the demand or on the supply security (Narula and Reddy, 2015).
To date, almost all of the studies on energy security have addressed the supply aspect, while works on the demand side are few. Further, most studies that have examined the supply aspect, concentrate more on the primary energy sources, particularly crude oil and natural gas. these studies adopt an aggregated approach and construct a composite index.
Gupta (2008) measures 26 oil-importing countries’ vulnerability to supply disruptions and constructs by using the PCA method, a composite index named Oil Vulnerability Index (OVI). Biresselioglu, Yelkenci and Oz (2015) evaluate the supply security of the natural gas in 23 importing countries using six individual indices which have been aggregated to supply security index (SSI) through PCA method. M. Radovanović, Filipović and Pavlović (2017) develop a composite energy security index (ESI) for 28 European Union countries with a sustainable approach, proposing six individual indicators which have been combined to ESI through PCA method. Proposing 23 individual indicators, Wang and Zhou (2017) employ the Subjective and Objective Weight Allocation method to develop a framework for evaluation of the energy security in different countries. They apply the Z-standardization and PCA methods to normalize and weigh the indicators respectively. Erahman et al. (2016) assess the performance of Indonesia’s energy security through constructing an energy security composite index based on fourteen individual indicators which have been weighted through PCA and equal weights methods. Narula, Sudhakara Reddy and Pachauri (2015) develop a Sustainable Energy Security (SES) index for India’s energy demand sub-system by using a hierarchical structure. Shaikh, Ji and Fan (2016) construct a holistic indicator which measures the network system stability based on Ecological Network Analysis (ENA) approach to evaluate the LNG supply stability for top five gas importing countries in Asia Pacific region.
Scope of some studies has been confined to such micro scales as rural regions and manufacturing companies.
Zhang and Su (2016) propose ten individual indicators for China’s sustainable development of rural household energy and have aggregated them to establish the “Rural Energy Sustainable Development Index” using a novel method called grouped PCA. Mainali et al (2014) measure the energy sustainability of rural regions of five developing countries by constructing a composite index called “Energy Sustainability Index” and have used the PCA method to aggregate thirteen individual indicators into that composite index. Zhang et al.
Not many studies have used the aggregated approach; they have proposed several individual indicators without aggregating them into a composite index.
Dastan and Selcuk (2016) review the energy supply security of the electricity and natural gas in Turkey in 2012 and suggest several indicators to measure the underlying risks. Tongsopit et al (2016) study the energy security of the ASEAN (Association of Southeast Asian Nations) countries based on a 4-A individual indicator framework: Applicability, Availability, Affordability, and Acceptability. Radovanović, Filipović and Pavlović (2017a) determine the impact level of five variables on energy security of 28 European states between 1990 and 2012 using panel data analysis.
As mentioned earlier, studies that have investigated the energy demand security are very rare, however, as an example, Dike (2013) addresses the exports demand security of oil and gas in OPEC members with a disaggregated approach and develop two main indicators that measure the level of energy demand security risks.
With respect to the existing literature in the energy security, from the international perspective, there are few contributions in the demand side since the most countries/ regions are net importers, and as a result the supply side of those countries/ regions’ energy security ought to be considered. The only study addressing energy demand security employs a disaggregated approach which develops several indicators to investigate the exports demand security of OPEC members. On the other hand, From the national perspective, all of research work with qualitative or quantitative indicators, investigate the demand or supply security with a disaggregated approach. Therefore, to fill the research gaps, we seek to
69
quantitatively measure Iran’s gas demand security performance in recent years with a composite index based on six individual indicators which are weighted and then aggregated to that composite index through PCA method.
3-Methodology
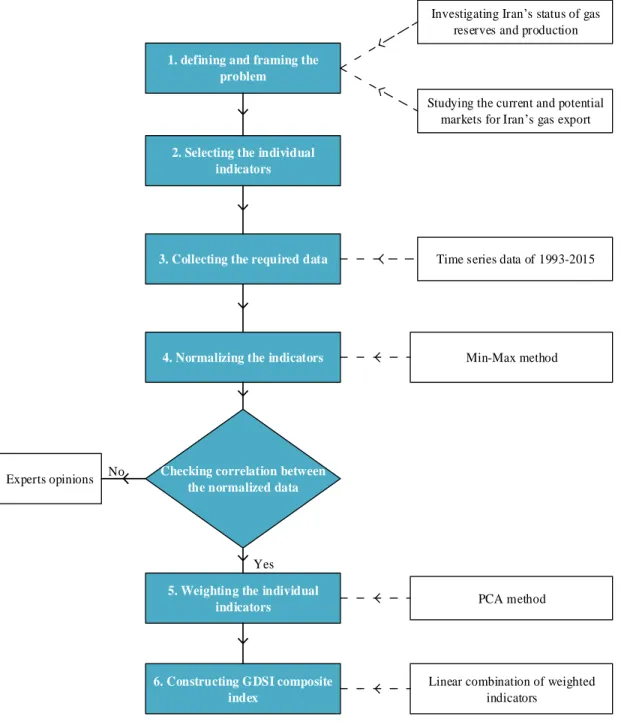
This section details the methodology employed. Fig 1 presents an outline of the steps for constructing the GDSI.
1. defining and framing the problem
2. Selecting the individual indicators
3. Collecting the required data
4. Normalizing the indicators
5. Weighting the individual indicators
6. Constructing GDSI composite index
Investigating Iran s status of gas reserves and production
Min-Max method Time series data of 1993-2015
PCA method
Studying the current and potential markets for Iran s gas export
Linear combination of weighted indicators
Checking correlation between the normalized data Experts opinions No
Yes
70
3-1-Iran’s situation of natural gas reserves and production
After Russia, Iran has the second-largest proved reserves of natural gas in the world. 17% of the world’s total natural gas reserves and more than 33% of OPEC’s belong to Iran. Further, Iran’s rate of natural gas exploration is estimated to be 79% which is approximately 44- 49% higher than the world’s average (U.S. Energy Information Administration, 2015). However, most of these rich reserves of natural gas are assigned to meet the domestic consumption causing Iran’s share in the global gas trade to be very low. This is mainly due to the lack of modern infrastructures for importing or exporting natural gas in the LNG form. As shown in Fig 2, natural gas reserves of Iran reached their maximum in 2014. Fig 3 illustrates Iran’s marketed production of natural gas between 2005 and 2015.
Fig 2. Iran’s proved natural gas reserves by the year (source: OPEC ASB from 2005 to 2016)
Fig 3. Iran’s marketed production of natural gas by the year (source: OPEC ASB from 2005 to 2016)
3-2-Current gas exports markets of Iran
In spite of having rich natural gas reserves and incremental exploration rate of new gas fields, Iran accounts for less than 1% of the international gas trade (U.S. Energy Information Administration, 2015). The country has failed to increase the export despite various efforts. to date, only Turkey, Azerbaijan, and Armenia import natural gas from Iran. With 7.8 bcm import in 2015 Turkey is the main export market for Iran’s natural gas (BP Statistical Review of World Energy, 2016). Based on a swap deal, Iran exports gas to Armenia and receives part of the electricity produced in Hrazdan in return. Similarly, Iran-Azerbaijan gas trade is actually a swap contract by which Iran imports gas from Azerbaijan and exports it to Nakhchivan autonomous republic in Azerbaijan (Jalilvand, 2013). In this research, the amount of gas exported to Nakhchivan has been regarded as that exported to Azerbaijan.
3-3-Indicators for assessing Iran’s gas demand security
In this paper, six individual indicators are selected and classified in two categories: first, indicators that address the exporting country (Iran) and second, indicators that address the importing country/countries. The former consists of three indicators: gas exports dependency, economic dependency, and political stability of the exporting country. Similarly, the latter contains three indicators: political stability of the importing country, purchasing power of the importing country, and transportation costs. We have collected the time series data of each indicator between 1993 and 2015. The six indicators are scrutinized as follows:
Gas exports dependency (X1)
This indicator stands for the ratio of Iran’s gas exports value to the total exports value in a given year.
(1)
𝐺𝑎𝑠 𝑒𝑥𝑝𝑜𝑟𝑡𝑠 𝑣𝑎𝑙𝑢𝑒
𝑇𝑜𝑡𝑎𝑙 𝑒𝑥𝑝𝑜𝑟𝑡𝑠 𝑣𝑎𝑙𝑢𝑒
0 10000 20000 30000 40000
2015 2014 2013 2012 2011 2010 2009 2008 2007 2006 2005
Iran's Natural Gas Reserves (bm3)
0 10000 20000 30000 40000
2015 2014 2013 2012 2011 2010 2009 2008 2007 2006 2005
Iran's Marketed Production of Natural Gas (bm3)
71
Economic dependency (X2)
This indicator stands for the ratio of Iran’s gas exports value to the GDP.
(2)
𝐺𝑎𝑠 𝑒𝑥𝑝𝑜𝑟𝑡𝑠 𝑣𝑎𝑙𝑢𝑒
𝐺𝐷𝑃
Political stability of the exporting country (X3)
To quantify this index, we use ICRG (International Country Risk Guide) index developed by PRSG (Political Risk Services Group). ICRG index is ranged between 0 to 100 in which values between 80 and 100 refer to the countries with a very low political risk and values between 0 and 50 refer to the countries with a very high political risk (Howell, 2011).
Political stability of the importing country (X4)
Similar to the previous index, the political stability of the three importing markets of Iran’s natural gas including Turkey, Azerbaijan, and Armenia has been assessed according to their ICRG ratings. Ratio of the natural gas volume exported to each of these countries to the total natural gas exports of Iran in a year is considered as the weight to construct the weighted average of the political stability index in the importing countries. Therefore, we use this weighted average in the calculations.
(3)
1
i
i i
Import
ICRG
TotalExports
Where Importi
TotalExports denotes the share of country i in Iran’s total gas exports in a specific year. Transportation costs (X5)
This index is stemmed from infrastructural and transportation disruptions. Similar to what Dike (2013) and Le Coq and Paltseva (2009) have done, the distance between the capitals of the importing and exporting countries is employed as a proxy for the gas transportation’s potential risks. Regarding distance, this index can take three different values as shown in equation (4). The longer is the distance between the two capitals, the more will be the vulnerability of the exporting country to disruptions in the gas imports of the importing countries because of the technical failures in the pipelines and other gas production facilities. Since this index has only three values in different years, we use ICRG rating of each importing country as the weight to develop the weighted average of the transportation costs as shown in equation 0.
(4)
distance < 1500 km
1 2 3
Di
1501 km < distance < 4000 km distance > 4001 km
72
(5)
1
ICRGi
Di
TotalICRG
i
Purchasing power of the importing country (X6)
The GDP of each importing country in a given year represents the purchasing power of that country. Since in this paper there are three importing countries with different GDP values, we consider the average of each country’s GDP in a given year for this index.
3-4- Collecting data
Time series data for six individual indicators have been derived from the World Bank annual reports of such international energy associations as the British Petroleum (BP), International Energy Agency (IEA), Energy Information Administration (EIA), and Oil Producing Exporting Countries (OPEC), and direct contacts with the Plan and Budget Organization (PBO) gas experts (See Table 7 and Table 8 in Appendix).
3-5-Normalizing indicators
Contrary to other researches that have addressed the energy security in multiple countries in a specific year, this paper has focused only on one single country (Iran). Hence, the required data of each index had to be collected for several years. Accordingly, we have used the time series data of each index between 1993 and 2015. Then, the Min-Max method has been used to normalize the indicators.
3-6-Weighting indicators
PCA is a multivariate statistical method used for studying a set of correlated variables in such various fields as economy, social issues, environmental concerns, job satisfaction, political situation, security of energy demand or supply and to some extent supply chain network design (Moradi et al., 2018). For more information about supply chain and its applications, interested readers can refer to (Sabbaghnia et al., 2018), (Razmi and Sabbaghnia, 2015), and (Rabbani et al., 2018).
The logic behind the PCA is to transform a set of correlated to uncorrelated variables called principal components or PCs, so that they are a linear combination of the initial variables. These PCs have two major attributes: first, they are uncorrelated, i.e. the covariance among them is zero and second, their variance from the first PC to the last declines in a descending order. In this research, the PCA approach is employed mainly, due to its capability in index construction and data dimensionality reduction. In fact, in lieu of considering six individual indicators, we have based our analysis on a PC, which is the linear combination of these indicators. In other words, the latent or unobserved variable in this study is Iran’s gas demand security index called GDSI which is the linear combination of six individual indicators.
4-Constructing GDSI using PCA
PCA consists of the following steps: forming the correlation or covariance matrix of indicators, calculating the Eigenvalues, and finally determining the coefficients or weights. Using time series data of the individual indicators during 1993-2015 as the input variables for the Minitab statistical software requires that two prerequisites be met: first, there is no correlation among the time series data of each individual indicator, and second, at least two of the individual indicators must be correlated. For the first constraint, we check the interdependence among time series data of each index. If there is no correlation among them, they will be interdependent and using them for the PCA method will be possible. However, when they are correlated, their being stationary or non-stationary must be investigated. If they are stationary, we can apply them as inputs for the PCA method, but if the time series is non-stationary, a first (or higher) order difference of that time series must be calculated to make that time series stationary. therefore, we adjust the indicators’ data to tailor them for the PCA method. Using the Pearson correlation test in Minitab, the correlation among the indicators is calculated and the results are shown in Table 1. As
73
shown, the results clearly indicate that the individual indicators are correlated enough to implement the PCA method.
To obtain the Eigenvalues (
i ), the following equation must be solved for
where I is the identical matrix and R is the covariance matrix of the normalized indicators according to Table 2, calculated eigenvalues are shown in Table 3.(6)
0
R
I
Table 1. results of the correlation test among the normalized indicators
indicators X1 X2 X3 X4 X5 X6
X1 1
X2 0.439 1
X3 0.155 -0.419 1
X4 0.004 0.158 -0.197 1
X5 -0.295 -0.314 -0.020 0.017 1
X6 -0.068 -0.512 0.368 -0.525 -0.076 1
Table 2. Covariance matrix
indicators X1 X2 X3 X4 X5 X6
X1 0.01413
X2 0.01050 0.04046
X3 0.00170 -0.00780 0.00818
X4 0.00012 0.00816 -0.00446 0.06263
X5 -0.00118 -0.00594 0.00083 -0.00961 0.01148
X6 -0.00074 -0.00949 0.00299 -0.01185 0.00221 0.00812
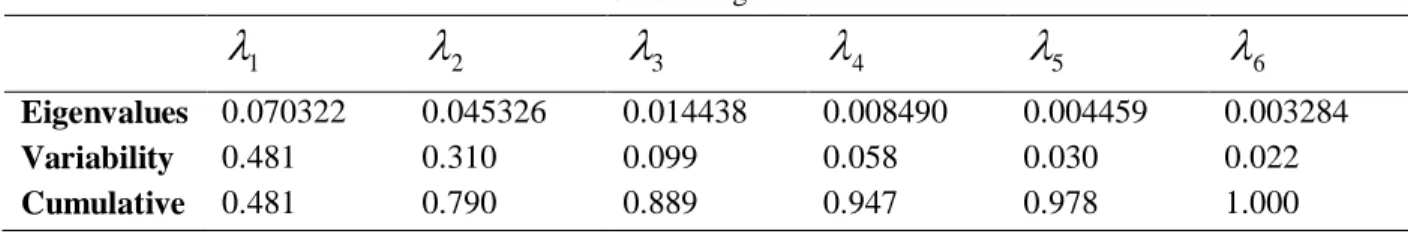
As shown in Table 3, 1 2 3 4 5 6 because jVar PC( j)and variance of the PCj changes in
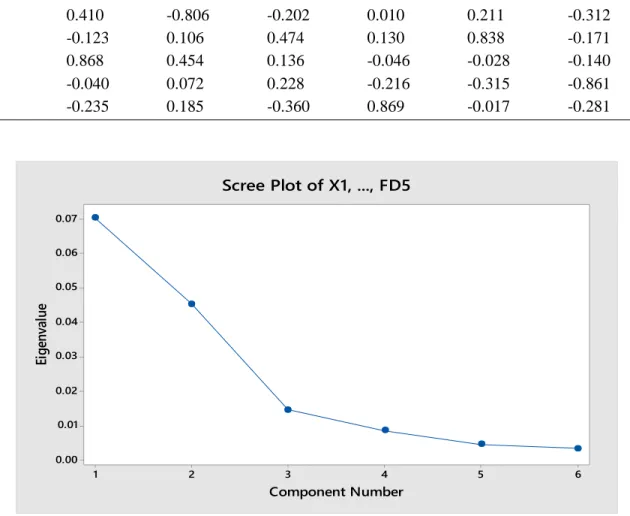
a descending order for j=1, 2, …, 6. The scree plot of the individual indicators has been illustrated in Fig 4and implies that the first three PCs are most important in establishing the GDSI. As mentioned earlier, we want to provide only one composite indicator called GDSI, hence, the coefficient of each individual indicator belonging to the first PC (not the first three PCs) with utmost importance in determining the GDSI, has been considered as the weight of that indicator as shown in table 4.
Due to using min-max in lieu of z-standardization method for data normalization, as shown in table 3, cumulative amount of eigenvalues is not equal to the number of the indicators, i.e. 6.
Table 3. Eigenvalues
1
2
3
4
5
6Eigenvalues 0.070322 0.045326 0.014438 0.008490 0.004459 0.003284
Variability 0.481 0.310 0.099 0.058 0.030 0.022
74
Table 4. Weights of the indicators
Indicator PC1 PC2 PC3 PC4 PC5 PC6
X1 0.085 -0.307 0.731 0.423 -0.391 0.181
X2 0.410 -0.806 -0.202 0.010 0.211 -0.312
X3 -0.123 0.106 0.474 0.130 0.838 -0.171
X4 0.868 0.454 0.136 -0.046 -0.028 -0.140
X5 -0.040 0.072 0.228 -0.216 -0.315 -0.861
X6 -0.235 0.185 -0.360 0.869 -0.017 -0.281
Fig 4. Scree plot of X1, ..., X6
As a result, according to table 4, the GDSI is calculated through the following equation where t refers to a specific year between 1993 and 2015 and X1 ,…, X6 represent the normalized values of the gas exports
dependency, economic dependency, political stability of the exporting country, political stability of the importing country, transportation costs, and the purchasing power of the importing country respectively.
(7)
0.085
1
0.410
2
0.123
3
0.868
4
0.040
5
0.235
6
GDSI
t
X
X
X
X
X
X
5-Discussing the results
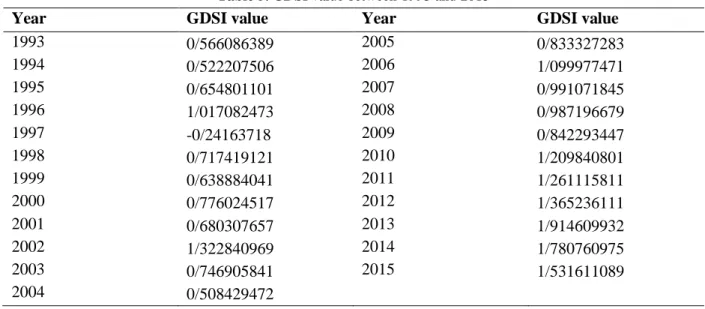
According to the proposed PCA model, the GDSI value is calculated for each year between 1993 and 2015. As shown in Table 5, the GDSI value is negative only in 1997 while it has reached its highest value in 2013. In other words, GDSI can assume any real number whether positive or negative. Hence, the sign
6 5
4 3
2 1
0.07 0.06 0.05
0.04 0.03
0.02 0.01 0.00
Component Number
Ei
ge
nv
al
ue
75
of the GDSI must be regarded in comparing its values through the time period. Results indicate that the higher is the value of GDSI in a year, the higher will be the gas exports demand security in the same year.
Table 5. GDSI value between 1993 and 2015
Year GDSI value Year GDSI value
1993 0/566086389 2005 0/833327283 1994 0/522207506 2006 1/099977471 1995 0/654801101 2007 0/991071845 1996 1/017082473 2008 0/987196679 1997 -0/24163718 2009 0/842293447 1998 0/717419121 2010 1/209840801 1999 0/638884041 2011 1/261115811 2000 0/776024517 2012 1/365236111 2001 0/680307657 2013 1/914609932 2002 1/322840969 2014 1/780760975 2003 0/746905841 2015 1/531611089 2004 0/508429472
It is important to note that the calculated weights should not be interpreted as the partial regression coefficients, because contrary to the typical linear regression, the latent or dependent variable of the model, i.e. the GDSI index, has not been considered in the model. Hence, more weight or coefficient of a variable does not necessarily mean more contribution of that variable in establishing the composite index. Similarly, a variable sign (positive or negative) does not mean its direct or indirect relation with the GDSI. For example, the purchasing power of the importing country (X6) is directly related to the GDSI,
however, its coefficient in the PCA model is negative.
The average share of the indicators in the model can be estimated based on the weights obtained for each indicator. Accordingly, following Gupta (2008), the normalized value of every indicator in a specific year has been multiplied by its weight in the model and then divided by the value of the GDSI in the same year to calculate the average share of every indicator in the GDSI (Table 6).
Table 6. average share of each index in the PCA model
X1 X2 X3 X4 X5 X6
Average share (%) 6.72 30.75 7.16 37.42 2.21 15.72
As shown, there is a considerable difference among the shares of the indicators in determining the GDSI. The political stability of the importing countries (X4) has the most share. Obviously, it can be
concluded that the effect of the political stability of the importing country on the GDSI is significantly higher than that of the exporting country.
Considering the significance of the indicators in the proposed GDSI, to reduce the vulnerability to possible disruptions in the gas demand of the importing countries, Iran’s energy policymakers should: (a) accord high priority to the political stability of the importing countries, (b) lessen the share of the natural gas in Iran’s total exports value by adopting appropriate economic policies, and (c) select the potential exports markets with high GDP values, i.e. high purchasing power.
6-Conclusions
The main contribution of this research was the development of a composite index (GDSI) to assess Iran’s gas demand security performance based on six individual indicators which have been weighted and
76
then aggregated to that composite index through PCA method. Accordingly, the main objective of this study is to establish a composite index to quantify and evaluate Iran’s gas exports demand security for which there are many influential individual indicators. Analyzing Iran’s situation of the natural gas reserves and production, and investigating the current and potential gas exports markets in this research led to proposing six individual indicators. These indices were then aggregated to GDSI using the PCA approach. Results have indicated that the GDSI reached its maximum in 2013 and its minimum in 1997. Further, the GDSI model has provided us with some key points in terms of the impact of each individual indicator on Iran’s gas demand security status. Considering the contribution of each indicator in determining the GDSI model, we suggested some policies that the energy policymakers may adopt to promote Iran’s gas demand security level.
Our study, being of an exploratory nature, raises a number of opportunities for future research. First, new research may address more indicators such as: stage of economic development, energy expenditures, price & market volatility, climate or environment factors, technology innovation and adoption, and develop similar composite index for other energy sources, specifically the crude oil. Further, from the international perspective, it may be an interesting topic to develop a composite index for measurement of the energy demand security in energy exporting countries/ regions.
References
Alhajji, A. F. (2007) ‘The impact of Iran’s nuclear standoff on world energy security’, Energy & Environment. SAGE Publications Sage UK: London, England, 18(5), pp. 549–564.
Biresselioglu, M. E., Yelkenci, T. and Oz, I. O. (2015) ‘Investigating the natural gas supply security: A new perspective’, Energy. Elsevier, 80, pp. 168–176.
BP Statistical Review of World Energy June 2016 (2016) BP Statistical Review. Available at: https://www.bp.com/content/dam/bp/pdf/energy-economics/statistical-review-2016/bp-statistical-review-of-world-energy-2016-full-report.pdf.
British Petroleum (BP). BP statistical review of world energy. 2002-2014. http://www.bp.com/statisticalreview. (2014). Available at: http://www.bp.com/statisticalreview.
Le Coq, C. and Paltseva, E. (2009) ‘Measuring the security of external energy supply in the European Union’, Energy Policy. Elsevier, 37(11), pp. 4474–4481.
Dastan, S. A. and Selcuk, O. (2016) ‘Review of the security of supply in Turkish energy markets: Lessons from the winter shortages’, Renewable and Sustainable Energy Reviews. Elsevier, 59, pp. 958–971. Dike, J. C. (2013) ‘Measuring the security of energy exports demand in OPEC economies’, Energy policy. Elsevier, 60, pp. 594–600.
Energy Information Administration (EIA). (2005) International Energy Outlook, US Department of Energy, p. 37 /http://www.eia.doe.gov/oiaf/ieo/nat_gas.htmlS.
Erahman, Q. F., Purwanto, W. W., Sudibandriyo, M. and Hidayatno, A. (2016) ‘An assessment of Indonesia’s energy security index and comparison with seventy countries’, Energy. Elsevier, 111, pp. 364–376.
Gas 2017, Analysis and Forecasts to 2022 Market Report Series, Executive Summary (2017). Available at: https://www.iea.org/Textbase/npsum/gas2017MRSsum.pdf.
Gupta, E. (2008) ‘Oil vulnerability index of oil-importing countries’, Energy policy. Elsevier, 36(3), pp. 1195–1211.
77
Howell, L. D. (2011) ‘International country risk guide methodology’, East Syracuse, NY: PRS Group. International Energy Agency (IEA). (2014) Natural Gas Information.
Jalilvand, D. R. (2013) Iran’s Gas Exports: Can Past Failure Become Future Success?. Oxford Institute for Energy Studies. Available at: http://www.oxfordenergy.org/wpcms/wp-content/uploads/2013/06/NG-78.pdf.
Koyama, K. and Kutani, I. (2012) ‘Study on the Development of an Energy Security Index and an Assessment of Energy Security for East Asian Countries’, Books. Economic Research Institute for ASEAN and East Asia (ERIA).
Mainali, B., Pachauri, S., Rao, N. D. and Silveira, S. (2014) ‘Assessing rural energy sustainability in developing countries’, Energy for Sustainable Development. Elsevier, 19, pp. 15–28.
Moradi, A., Razmi, J., Babazadeh, R. and Sabbaghnia, A. (2018) ‘An integrated Principal Component Analysis and multi-objective mathematical programming approach to agile supply chain network design under uncertainty’, Journal of Industrial & Management Optimization, pp. 433–459.
Narula, K. and Reddy, B. S. (2015) ‘Three blind men and an elephant: The case of energy indices to measure energy security and energy sustainability’, Energy. Elsevier, 80, pp. 148–158.
Narula, K., Sudhakara Reddy, B. and Pachauri, S. (2015) ‘Sustainable Energy Security for India: An assessment of energy demand sub-system’. doi: 10.1016/j.apenergy.2016.02.142.
Rabbani, M., Sabbaghnia, A., Mobini, M. and Razmi, J. (2018) ‘A graph theory-based algorithm for a multi-echelon multi-period responsive supply chain network design with lateral-transshipments’,
Operational Research. Springer, pp. 1–21.
Radovanović, M., Filipović, S. and Pavlović, D. (2017a) ‘Energy prices and energy security in the European Union: Panel data analysis’, Energy Sources, Part B: Economics, Planning, and Policy. Taylor & Francis, 12(5), pp. 415–419.
Radovanović, M., Filipović, S. and Pavlović, D. (2017b) ‘Energy security measurement–A sustainable approach’, Renewable and Sustainable Energy Reviews. Elsevier, 68, pp. 1020–1032.
Razmi, J. and Sabbaghnia, A. (2015) ‘Tracing the impact of non-uniform forecasting methods on the severity of the bullwhip effect in two-and three-level supply chains’, International Journal of Management Science and Engineering Management. Taylor & Francis, 10(4), pp. 297–304.
Sabbaghnia, A., Razmi, J., Babazadeh, R. and Moshiri, B. (2018) ‘Reducing the Bullwhip effect in a supply chain network by application of optimal control theory’, RAIRO-Operations Research. EDP Sciences.
Shaikh, F., Ji, Q. and Fan, Y. (2016) ‘Assessing the stability of the LNG supply in the Asia Pacific region’, Journal of Natural Gas Science and Engineering. Elsevier, 34, pp. 376–386.
The Global Risks , Report 2017, 12th Edition (2017). doi: 10.1017/CBO9781107415324.004.
The Global Risks , Report 2018, 13th Edition (2018). Available at: http://www3.weforum.org/docs/WEF_GRR18_Report.pdf.
Tongsopit, S., Kittner, N., Chang, Y., Aksornkij, A. and Wangjiraniran, W. (2016) ‘Energy security in ASEAN: A quantitative approach for sustainable energy policy’, Energy Policy. Elsevier, 90, pp. 60–72. U.S. Energy Information Administration (2015) Iran international analysis. Available at: http://www.eia.gov/beta/international/analysis.cfm?iso=IRN.
78
Wang, Q. and Zhou, K. (2017) ‘A framework for evaluating global national energy security’, Applied Energy. Elsevier, 188, pp. 19–31.
Zhang, M. and Su, B. (2016) ‘Assessing China’s rural household energy sustainable development using improved grouped principal component method’, Energy. Elsevier, 113, pp. 509–514.
Zhi-Guo, L., Cheng, H. and Dong-Ming, W. (2018) ‘Empirical research on the relationship between natural gas consumption and economic growth in the Northeast Asia’, Energy & Environment, 29(2), pp. 216–231. doi: 10.1177/0958305X17745273.
79 Appendix
Table 7. Research Data (Source: OPEC and World Bank)
Year
Iran’s Total Export Value (million USD)
Iran’s Gas Export Value (million USD)
Iran’s Gas Export Volume (mcm)
Iran’s GDP (million USD)
Azerbaijan’s GDP (million USD)
Armenia’s GDP (million USD)
Turkey’s GDP (million USD)
1993 18080 321/33 500 73766 3973 1201 180170 1994 19434 344/41 420 105878 3314 1315 130690 1995 18360 367/48 100 104763 3052 1468 169486 1996 22391 390/56 100 107455 3177 1597 181476 1997 18381 413/63 0/00 100877 3963 1639 189835 1998 13118 436/70 0/00 117861 4446 1894 269287 1999 21030 459/78 275/00 104656 4581 1845 249751 2000 28345 482/85 350/00 96440 5273 1912 266568 2001 23904 505/93 358 115435 5708 2118 196005 2002 28186 529/00 670 115234 6236 2376 232535 2003 33991 552/07 3520 132251 7276 2807 303005 2004 44403 633/95 3560 158828 8681 3577 392166 2005 64366 1145/32 4320 187438 13245 4900 482980 2006 76190 1456/95 5690 222128 20983 6384 530900 2007 97668 1514/74 6160 307355 33050 9206 647155 2008 101289 1462/30 5800 350588 48852 11662 730337 2009 88326 1061/11 5670 360625 44291 8648 614554 2010 112788 1733/35 8420 463971 52903 9260 731168 2011 144874 2231/20 9100 564459 65952 10142 774754 2012 107409 2111/05 8400 583164 68731 10619 788863 2013 91793 2362/84 9400 380348 73560 11121 823243 2014 86235 1940/49 9600 416490 75198 11644 798797 2015 77974 1375/36 8400 387611 53047 10561 718221
80
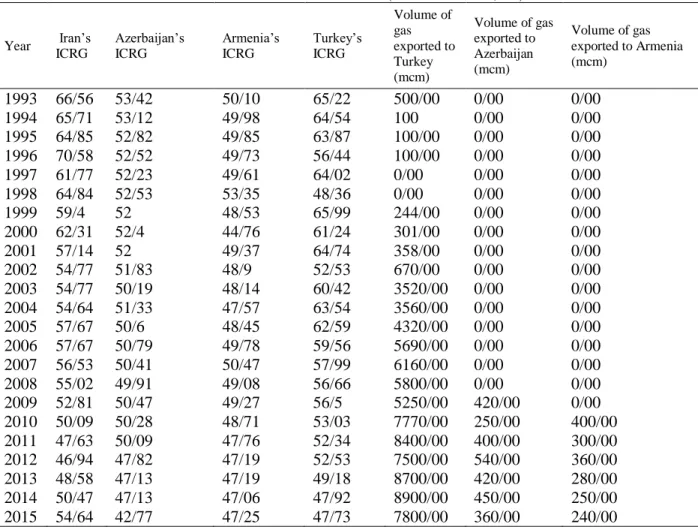
Table 8. Research Data. Continued (Source: PRS and, BP)
Year Iran’s ICRG
Azerbaijan’s ICRG
Armenia’s ICRG
Turkey’s ICRG
Volume of gas exported to Turkey (mcm)
Volume of gas exported to Azerbaijan (mcm)
Volume of gas exported to Armenia (mcm)
1993 66/56 53/42 50/10 65/22 500/00 0/00 0/00 1994 65/71 53/12 49/98 64/54 100 0/00 0/00 1995 64/85 52/82 49/85 63/87 100/00 0/00 0/00 1996 70/58 52/52 49/73 56/44 100/00 0/00 0/00 1997 61/77 52/23 49/61 64/02 0/00 0/00 0/00 1998 64/84 52/53 53/35 48/36 0/00 0/00 0/00 1999 59/4 52 48/53 65/99 244/00 0/00 0/00 2000 62/31 52/4 44/76 61/24 301/00 0/00 0/00 2001 57/14 52 49/37 64/74 358/00 0/00 0/00 2002 54/77 51/83 48/9 52/53 670/00 0/00 0/00 2003 54/77 50/19 48/14 60/42 3520/00 0/00 0/00 2004 54/64 51/33 47/57 63/54 3560/00 0/00 0/00 2005 57/67 50/6 48/45 62/59 4320/00 0/00 0/00 2006 57/67 50/79 49/78 59/56 5690/00 0/00 0/00 2007 56/53 50/41 50/47 57/99 6160/00 0/00 0/00 2008 55/02 49/91 49/08 56/66 5800/00 0/00 0/00 2009 52/81 50/47 49/27 56/5 5250/00 420/00 0/00 2010 50/09 50/28 48/71 53/03 7770/00 250/00 400/00 2011 47/63 50/09 47/76 52/34 8400/00 400/00 300/00 2012 46/94 47/82 47/19 52/53 7500/00 540/00 360/00 2013 48/58 47/13 47/19 49/18 8700/00 420/00 280/00 2014 50/47 47/13 47/06 47/92 8900/00 450/00 250/00 2015 54/64 42/77 47/25 47/73 7800/00 360/00 240/00