The association between obesity and
coronary artery disease detected during non-emergent angiography: A comparison between black and white patients.
By Caleb Stalls
A Master’s Paper submitted to the faculty of the University of North Carolina at Chapel Hill
in partial fulfillment of the requirements for the degree of Master of Public Health in
the Public Health Leadership Program.
Chapel Hill 2011
__________________________
Advisor:
____________________________________
Date
_________________________________
Second Reader:
_________________________________
Table of Contents
Abstract………3
Systematic Review..……….…………5
Abstract
Introduction: Despite known associations between obesity and the development of cardiovascular disease, the relationship between obesity as reflected by BMI and
angiographically demonstrated CAD is not fully understood. Moreover, this relationship has not been adequately defined in black patients, a group demonstrated to have lower rates of
angiographic CAD despite higher rates of traditional CAD risk factors, cardiovascular events, and CAD-related mortality. In order to more fully characterize the association between obesity, race, and CAD, a systematic review and subsequent analysis of secondary data from a major academic medical center was performed. The review informed the approach to the analysis and underscores the significance of the resulting manuscript—with potentially important clinical implications in the evaluation and management of patients with suspected CAD.
Methods: The review canvassed literature using multiple academic search engines. The
contribution of obesity to black-white differences in angiographically demonstrated CAD proved too narrow a topic for an adequate systematic review; therefore the study focus was broadened to include articles evaluating the relationship between BMI and CAD. Potential studies for full review were narrowed using appropriate inclusion and exclusion criteria. Systematic data extraction facilitated the organized comparison of internal and external validity, strength of evidence, and overall quality of selected studies. The secondary data analysis was performed using an angiography database from a single academic hospital. We studied patients undergoing first-time, non-emergent angiography from 2001 to 2010. From this cohort, we selected those lacking a previous CAD diagnosis, without previous cardiac intervention, and with complete anthropomorphic measures and outcome data. Using models that controlled for patient
whites by obesity status (BMI ≥ 30 kg/m2) and BMI class. Significant CAD was defined by the presence of a significant lesion (≥50% stenosis in the left main artery or ≥70% stenosis
elsewhere), and also quantified by a modified Gensini score of global disease.
Results: The review found three out of five studies to lack sufficient, overall quality as to draw reliable conclusions from their results. The two stronger studies found no consistent relationship between BMI and CAD, with statistically nonsignificant inverse relationships. In preparation for the original manuscript’s analysis, we identified 4,022 white and 1,963 black eligible patients.
Black patients had higher rates of diabetes and hypertension, and were more likely to be obese than whites (OR 1.85;95% CI 1.65-2.06). Nevertheless, black patients were less likely to have a significant stenosis (adjusted OR 0.57; 95% CI 0.48–0.66), and were found to have a lower mean Gensini score (7.33 vs. 8.83, P=0.001). Obesity was not associated with the presence of CAD. In fact, black obese patients were significantly less likely to have a severe stenosis than their non-obese counterparts, and there was a non-significant trend for obese patients of both races to have less disease than non-obese patients using the Gensini score.
Systematic Review
INTRODUCTION
The growing epidemic of obesity is a major public health concern. In light of this trend, increasing relevance of overweight- and obesity-associated morbidity and mortality has directed attention to the role of excess body fat in various disease states. Several risk factors for heart disease are associated with adiposity, including diabetes, hypertension, endothelial dysfunction, and lipid disorders.1-3 Many studies have established the strong association between obesity, as measured by body mass index (BMI), and the incidence of coronary events.4-11 Long-term follow-up studies found that obesity may be associated with heart disease independent of other risk factors.12-14 Thus, the contribution of excess body fat to the eventual development of heart disease and subsequent cardiac events is one of confirmed significance. The American Heart Association echoes the totality of the evidence by defining obesity as a major risk factor for the development of cardiovascular disease.15
However, despite the known associations between obesity and heart disease, the
METHODS
Search Strategy
An electronic search of MEDLINE, ISI Web of Knowledge, and Google Scholar were used to search for pertinent studies. Keywords utilized to narrow search results included: Obesity; Coronary Artery Disease, Coronary Angiography, Body Mass Index, Atherosclerosis, Adiposity, CAD Severity; Body Fat; Gensini; Duke Myocardial Jeopardy Score; Coronary Heart Disease; Cardiovascular Disease; and Weight. Citations of relevant studies in articles using this strategy were also included. Additional original articles cited by papers found using this search strategy were also considered and included pending satisfaction of inclusion criteria.
Article Inclusion
Articles chosen for review were limited to English, original papers published in peer-reviewed journals since 1990. Titles and abstracts were peer-reviewed to confirm relevance. Specifically, studies must have evaluated the existence of a relationship between obesity and CAD as measured by BMI and coronary angiography, respectively. Review articles, papers cited by relevant studies but not found with direct searches, case reports, and studies that included the independent and dependent variables of interest without an analysis of their association or lack thereof (i.e. examining a related set of variables to answer a different research question such as the association of waist circumference to incidence of cardiac events) were excluded. Many of the relevant articles found using this strategy also evaluated the effects of other variables on CAD (e.g. inflammatory markers, body fat percentage, fat distribution, etc.), or otherwise did not exclusively focus on CAD and BMI; these articles were included.
Data Extraction
included fields such as design, population, methods, outcome measures, and results. This juxtaposition of study characteristics facilitated the evaluation and comparison of relevant papers. Papers chosen for full review were evaluated for internal and external validity based on the GRADE system of judging quality of evidence. These qualifications of the evidence
presented in a particular study are based on they type of study (randomized trial, observational study, etc.) and shaped by limitations to study quality, inconsistencies, uncertainties about directness, precision of data, bias, effect magnitude, statistical significance, and the presence and controlling of confounders.29
RESULTS
The search strategy yielded 764 titles across three search engines using the combined yield of each keyword search. These results were then filtered for relevance, publishing date, and language. The remaining 55 studies were furthernarrowedto 11 by excluding those lacking abstracts, with poor CAD quantification, and those studies that quantified adiposity by waist circumference, weight, body fat percentage, and additional modalities other than BMI. Of the 11 original articles that examined the association of BMI and angiographically assessed CAD, five were selected for further analysis based on appropriate outcome measures (validated
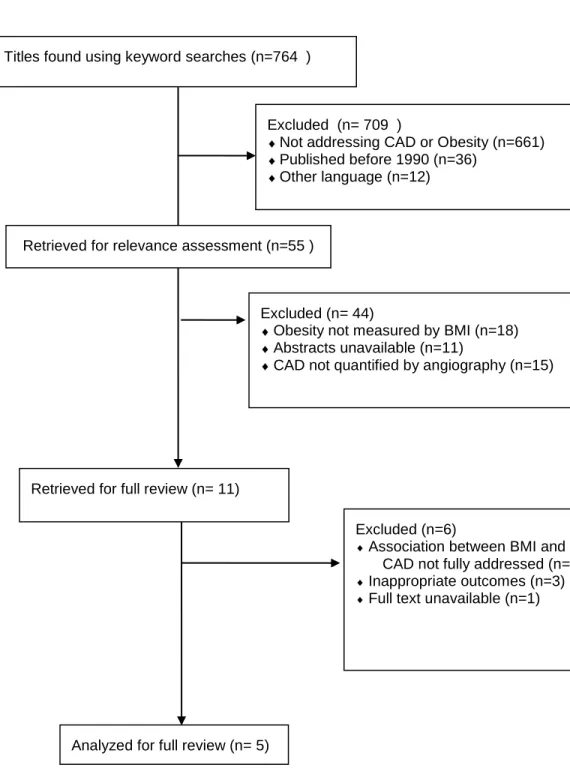
approximations of global disease, criteria for significant stenosis, etc.), availability of full text, and a specific focus on the association between BMI and CAD. Our process of evaluating the literature for relevant studies is summarized in a flow diagram at the end of this review (Figure 1).
pertinent studies as randomized control trials, limitations of the exposure and outcome measures, generalizability of study populations, inadequate controlling of confounders, and other
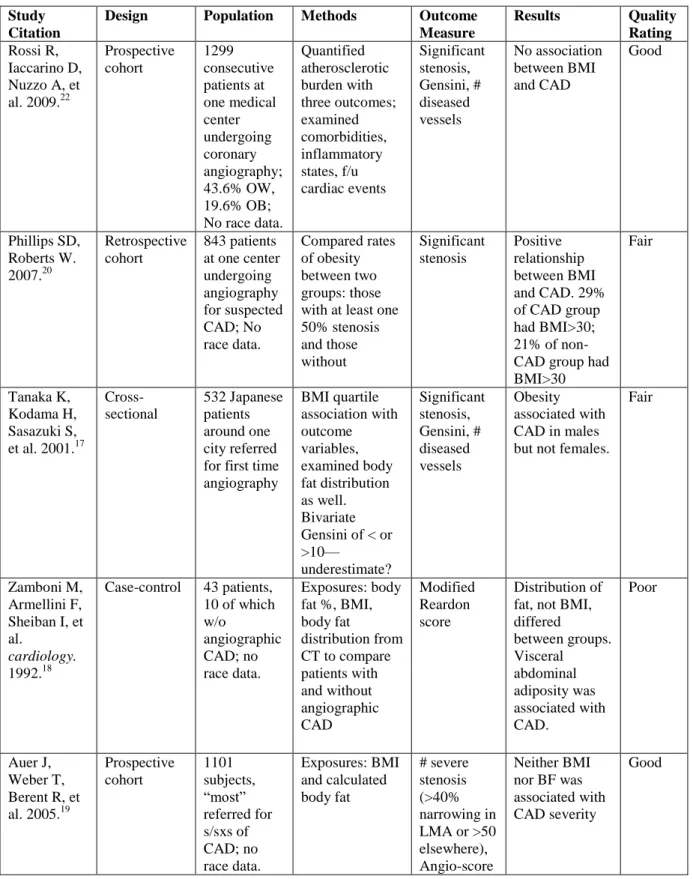
shortcomings of internal and external validity. The authorship and publication information, design, population, methods, outcome measures, and results for these five studies are summarized at the end of this review in a QUOROM flow diagram (Table 1).28
Analysis
The first article by Rossi et al.22 was a prospective cohort study that examined a
population of 1,299 patients suspected of having CAD to determine if a statistically significant association existed between BMI and angiographically determined CAD, coronary events,
inflammatory markers, endothelial function or mortality. This was the largest study of the eleven pertinent, original articles.
Almost half of the cohort was overweight (43.6%), and 19.6% were obese. The anthropomorphic exposure measures were BMI and body surface area, both calculated
conventionally from height and weight measurements taken before angiography. Supporting the aforementioned studies on the cardiovascular risks of obesity, they did find that overweight and obese subjects had a higher incidence of coronary events compared to the subjects of normal weight. However, rates of CAD (detected by angiography) did not differ significantly between BMI groups. Mean Gensini scores (a quantification of CAD severity incorporating both degree of coronary narrowing and importance of stenosed vessel) were 34.8 ± 29.5, 36.6 ± 30.8, and 32.9 ± 28.8 for normal weight, overweight, and obese subjects, respectively.
coronary syndrome, history of CAD, valvular disease, prosthetic valves, congenital heart disease, hypertrophic cardiomyopathy, and those on dialysis.
Weaknesses include wide confidence intervals of mean Gensini scores, and the inherent limitations of a prospective observational study—wherein causality cannot be established, only associations. Statistically significant difference in coronary events was based on adjusted risk ratios within 0.17 of 1.0. Thus, statistical significance here may exist without clinical
significance. The cutoff for a significant stenosis in this study (30% for left main artery (LMA) and 50% elsewhere) was lower than what similar studies typically use, threatening specificity. Overall, this was a well-done study and supports the pattern of negative studies that investigate a significant relationship between BMI and angiographically detected CAD.
The second article by Phillips and Roberts20 was a retrospective cohort, comparing BMI in 842 patients undergoing coronary angiography at a major academic medical center. Subjects were defined as having CAD if they had at least one vessel with an occlusion of greater than 50%. Subjects with less disease than this were considered to not have CAD. The two groups were then stratified by clinical presentation (e.g. stable angina, unstable angina, etc.) and rates of having CAD were compared across BMI groups.
Comparison of the BMI in the 624 patients in whom >1 coronary artery was narrowed >50% in diameter to the BMI in the 218 patients with absent or lesser degrees of coronary narrowing disclosed the following: the BMI was >30 in 209 (33%) versus 92 (42%) patients (p 0.008): BMI was 26 to 30 in 233 (37%) versus 80 patients (37%) (p>0.05), and BMI <25 (ideal) in 182 (29%) versus 46 (21%) patients (p 0.01).20 There were many limitations to this study that undermine the positive correlation found to exist between BMI and CAD.
subjects. The authors implied publication was worthy by the incorporation of both males and females into their study. However, six of the eleven aforementioned relevant articles had been published with subjects of both sexes before the date of Phillips and Roberts study. More
importantly, no confounding variables were controlled for; the statistical analysis was a simple z-test to determine statistical significance. The bulk of the paper ends up being scatter plots and discussion of coronary events stratified by age, information irrelevant to the primary research question. Without accounting for other cardiovascular risk factors, a true correlation between BMI and CAD cannot be determined without the risk of missing the influence of weight-related confounders.
Another limitation was the dichotomizing of subjects into either having CAD or not having CAD by visual inspection. Similar studies employ some degree of quantitative assessment or systematic evaluation of CAD severity, while this study relied upon the
subjectivity of many different angiographers visually gauging whether or not a vessel was half stenosed. Therefore, although the findings of this study support the biological plausibility of a significant relationship existing between BMI and CAD, its weak internal validity render its conclusion unreliable.
The next article by Tanaka et al.17 is a cross-sectional study from Japan. The subjects were 532 patients who underwent coronary angiography for suspicion of CAD, all of whom were at least 30 years of age. Weight and height information were obtained from medical records and calculated BMI was compared to the outcomes of number of diseased vessels, Gensini score, and significant stenosis—defined as at least a 50% narrowing of the LMA or at least a 75%
narrowing elsewhere.
identified from medical records and a questionnaire. Utilizing either number of diseased vessels as the dependent variable, BMI was positively correlated in men but not in women (multivariate OR of 1.0 (reference), 1.1, 1.9, and 2.5, p 0.02. Neither the Gensini nor the significant stenosis outcomes were associated with BMI. The authors of this study did an excellent job outlining exclusion criteria, including history of MI, aorta surgery, angioplasty, cardiomyopathy, congenital heart defects, and valvular disease. Thorough efforts were made to ascertain
cardiovascular risk profiles, supplementing much of the missing information in medical records with a survey addressing issues such as smoking habit, diabetes diagnosis, hyperlipidemia medication. Sex-specific multiple logistic regression controlled for the identified risk factors to isolate the effect of BMI on CAD, while the three dependent variables provided a more accurate estimate of a subject’s atherosclerotic status.
The results of the study however are ultimately not convincing for a few reasons. The bivariate Gensini score, firstly, is set at a very low cutoff. Equating a Gensini score of greater than 10 with severe/present CAD is a gross overestimate of disease and would mislead the reader to think CAD was present more often than it really was. To illustrate, the positive version of the other dichotomized dependent variable, significant stenosis (greater than 50% LMA or 75% elsewhere) would be 20 at minimum. Also, the surveys are subject to reporter and recall bias— particularly when dealing with social stigmas such as smoking and other behavioral habits that represent risk factors. Finally, even though the adjusted odds ratio was statistically significant at p 0.02, the 95% confidence intervals included 1.0 for all BMI categories. It is also difficult to control for Asian diet, lifestyle factors, etc. in this exclusively Japanese (they do live the
The fourth study by Zamboni et al.18 is a case-control of 43 patients who were referred for angiography based on suspicion for CAD or the occurrence of a coronary event. Of the entire study sample, 33 of the subjects were diagnosed angiographically with CAD based on a modified Reardon score, while the 10 found to be without disease were used as controls. In addition to BMI and other anthropometric data, computed tomography was utilized to precisely define percentage and distribution of body fat. BMI, along with body weight, total and subcutaneous abdominal adipose tissue were found to have no statistical difference between the cases and controls.
Supporting the finding of many studies, visceral abdominal adipose tissue was found to be greater in subjects with CAD. Subjects who reported significant weight loss in the six months prior to the study were excluded. This is important because it limits the confounding effects of chronic illness (e.g. cancer) on atherosclerosis in subjects with normal or low BMI’s. While the
authors of this study should be credited with employing the accurate imaging of computed tomography to assess body fat, it does not contribute to the question of linking BMI to CAD and is an expense that clearly limited the study population.
The exclusion and inclusion criteria were counterintuitive, with 18 of subjects with CAD having had an MI, while those with hypertension were excluded from the study. Only two of the controls did not have valvular disease. This clearly represents a skewed incidence of heart disease in comparison with the general public, and thus invalidates the use of this group as controls. Also, no women were included in the study. Although the findings of this paper support the majority of similar studies, the authors’ conclusion that BMI is not correlated with
patients referred to this center for angiography over a four-month period were included in the study population. BMI and body fat (as measured by bioelectrical impedance analysis) were the main exposure variables, with outcomes including significant stenosis (at least 40% narrowing of LMA at least 50% in another arterial segment), number of involved vessels, and an originally modified CAD severity score.
BMI did not significantly vary according to number of involved vessels or the modified CAD severity score. BMI showed a statistically nonsignificant inverse relation to the presence of significant stenosis. The lack of association between BMI and the various angiographic measures of CAD is interesting given that traditional cardiovascular risk factors including diabetes and hypertension were much more common in those with higher BMI’s. Adjusting for
potential confounders (including diabetes, hypercholesterolemia, smoking, and hypertension) did not change the lack of association. Strengths of the study include the large size; this study population is the second largest of its kind.
The authors of this study did an excellent job in outlining and controlling for potential confounders and stratifying analyses by both sex and age. Of note the study also considers the effect of BMI on CAD without adjustment, which is important because the ultimate objective of establishing the existence or absence of a significant association between BMI and CAD is identifying the value of BMI in risk stratification; increased BMI may be associated with other CAD risk factors and thus an adjusted analysis may inappropriately reduce the association between BMI and CAD as defined by angiography. In other words, a casual component of CAD (e.g. higher blood pressure from higher BMI) should not be corrected for in statistical
comorbidities. Overall, this is a strong study with impressive internal and external validity. Its conclusions support the predominance of negative studies and should be incorporated into the body of credible evidence refuting a BMI/CAD association.
DISCUSSION
The overall strength of the evidence presented by the five relevant studies is fair; inconsistent conclusions, widely ranging study samples, study designs, and outcome measures illustrate the limitations to the current literature regarding this topic. Only two of the five
selected original articles were designed with strong enough validity to draw reliable conclusions. Based on these two relatively strong papers, and the predominance of related articles, it appears that the pattern of negative studies suggests the true lack of association between BMI and CAD.19,22
It is evident in the limitations of these reviewed studies that assessing the relationship between obesity, as measured by BMI, and CAD, as measured by angiographic CAD, presents known and unknown challenges to study design. Several weaknesses inherent to this topic can inform future research initiatives, including the fact that obese individuals have higher rates of false positive noninvasive testing, thus more obese people without CAD are referred for angiography simply to rule it out. Also, coronary angiographic data are lacking in subjects without any suspicion of CAD.
excess adiposity varies across race. Black patients have less body fat than their Caucasiancounterparts of the same BMI.
Investigators have proposed that obesity influences acute cardiac events rather than the development of atherosclerosis, explaining the higher morbidity and mortality of those with higher BMI’s; the contribution of obesity to atherosclerotic plaque’s ―vulnerability‖ could be
incorporated into future studies. Future study designs should pay greater attention to race data, given the surprisingly lower rate of angiographically detected CAD in minority populations despite significantly higher rates of risk factors compared to whites.
The trend of BMI being found to be negatively associated with CAD suggests obesity to be protective against the development of atherosclerotic heart disease, though we know this to not be the case. Explanation for this paradox may exist in confounders that have not yet been addressed. Relevant studies that evaluate the association between BMI and CAD are faced with many challenges. In particular, it is difficult to control for the low threshold at which primary care physicians and cardiologists refer their obese patients for coronary angiography to rule out CAD. Noninvasive testing for ischemic heart disease is both difficult and fraught with false positives within the obese demographic, which populates catheterization labs with obese, disease-free patients. These obese patients without stenotic coronary plaque confound conclusions drawn from databases and obscure the true relationship between adiposity and angiographic CAD.
CONCLUSION
BMI does not appear to correlate with CAD, given the inconsistency of study
accurate screening modalities for obese patients with suspected disease will correct this
Table 1. Study Profiles
Study Citation
Design Population Methods Outcome Measure
Results Quality Rating Rossi R,
Iaccarino D, Nuzzo A, et al. 2009.22
Prospective cohort 1299 consecutive patients at one medical center undergoing coronary angiography; 43.6% OW, 19.6% OB; No race data.
Quantified atherosclerotic burden with three outcomes; examined comorbidities, inflammatory states, f/u cardiac events Significant stenosis, Gensini, # diseased vessels No association between BMI and CAD Good Phillips SD, Roberts W. 2007.20 Retrospective cohort 843 patients at one center undergoing angiography for suspected CAD; No race data. Compared rates of obesity between two groups: those with at least one 50% stenosis and those without Significant stenosis Positive relationship between BMI and CAD. 29% of CAD group had BMI>30; 21% of non-CAD group had BMI>30
Fair
Tanaka K, Kodama H, Sasazuki S, et al. 2001.17
Cross-sectional 532 Japanese patients around one city referred for first time angiography BMI quartile association with outcome variables, examined body fat distribution as well. Bivariate Gensini of < or >10— underestimate? Significant stenosis, Gensini, # diseased vessels Obesity associated with CAD in males but not females.
Fair
Zamboni M, Armellini F, Sheiban I, et al.
cardiology. 1992.18
Case-control 43 patients, 10 of which w/o
angiographic CAD; no race data.
Exposures: body fat %, BMI, body fat
distribution from CT to compare patients with and without angiographic CAD Modified Reardon score Distribution of fat, not BMI, differed between groups. Visceral abdominal adiposity was associated with CAD. Poor Auer J, Weber T, Berent R, et al. 2005.19
Prospective cohort 1101 subjects, ―most‖ referred for s/sxs of CAD; no race data. Exposures: BMI and calculated body fat # severe stenosis (>40% narrowing in LMA or >50 elsewhere), Angio-score
Neither BMI nor BF was associated with CAD severity
Figure 1. QUOROM Study Selection Flow Diagram
Titles found using keyword searches (n=764 )
Excluded (n= 709 )
Not addressing CAD or Obesity (n=661) Published before 1990 (n=36)
Other language (n=12)
Retrieved for full review (n= 11)
Excluded (n= 44)
Obesity not measured by BMI (n=18) Abstracts unavailable (n=11)
CAD not quantified by angiography (n=15)
Analyzed for full review (n= 5) Retrieved for relevance assessment (n=55 )
Excluded (n=6)
References
1. Lavie C, Milani R, Ventura H. Obesity and cardiovascular disease: risk factor, paradox, and impact of weight loss. J Am CollCardiol. 2009;53(21):1925.
2. Marinou K, Tousoulis D, Antonopoulos AS, Stefanadi E, Stefanadis C. Obesity and cardiovascular disease: From pathophysiology to risk stratification. Int J Cardiol.
2010;138(1):3-8.
3. Brandon L, Mullis R, Jonnalagadda S, Hughes M. Relationships and CHD risks of BMI, lipoproteins, lipids, and blood pressure in African-American men and women. Prev Med.
2005;40(3):349-354.
4. National Institutes of Health (NHLBI) . Clinical guidelines on the identification,
evaluation and treatment of overweight and obesity in adults: executive summary. Am J Clin Nutr.1998;68:899–917.
5. Calle EE, Thun MJ, Petrelli JM, Rodriguez C, Heath CW. Body mass index and mortality in a prospective cohort of US adults. N Engl J Med. 1999;341:1097–1105.
6. Jonsson S, Hedblad B, Engström G, Nilsson P, Berglund G, Janzon L. Influence of obesity on cardiovascular risk. Twenty-three-year follow-up of 22,025 men from an urban Swedish population. Int J ObesRelatMetabDisord. 2002;26:1046–1053.
7. Lamon-Fava S, Wilson PW, Schaefer EJ. Impact of body mass index on coronary heart disease risk factors in men and women. The Framingham offspring
study. ArteriosclerThrombVasc Biol. 1996;16:1509–1515.
9. Wolk R, Berger P, Lennon RJ, Brilakis ES, Somers VK. Body mass index. A risk factor for unstable angina and myocardial infarction in patients with angiographically confirmed coronary artery disease. Circulation. 2003;108:2206–2211.
10. Wolk R, Berger P, Lennon RJ, Brilakis ES, Somers VK. Body mass index. A risk factor for unstable angina and myocardial infarction in patients with angiographically confirmed coronary artery disease. Circulation. 2003;108:2206–2211.
11. Adams KF, Schatzkin A, Harris TB, Kipnis V, Mouw T, Ballard-Barbash R,
et al. Overweight, obesity, and mortality in a large prospective cohort of persons 50 to 71 years old. N Engl J Med. 2006;355:763–778.
12. Dey DK, Lissner L. Obesity in 70-year-old subjects as a risk factor for 15-year coronary heart disease incidence. Obesity. 2003;11(7):817-827.
13. Jonsson S, Hedblad B, Engstrˆm G, Nilsson P, Berglund G, Janzon L. Influence of Obesity on Cardiovascular Risk. Twenty-three-year follow-up of 22 025 men from an urban Swedish population. Int J Obes. 2002;26(8):1046-1053.
14. Kim KS, Owen WL, Williams D, Adams-Campbell LL. A Comparison between BMI and Conicity Index on Predicting Coronary Heart Disease:: The Framingham Heart Study.
Ann Epidemiol. 2000;10(7):424-431.
15. Grundy SM, Pasternak R, Greenland P, Smith Jr S, Fuster V. Assessment of
cardiovascular risk by use of multiple-risk-factor assessment equations: a statement for healthcare professionals from the American Heart Association and the American College of Cardiology. Circulation. 1999;100(13):1481.
17. Tanaka K, Kodama H, Sasazuki S, et al. Obesity, body fat distribution and coronary atherosclerosis among Japanese men and women. Int J Obes. 2001;25(2):191-197. 18. Zamboni M, Armellini F, Sheiban I, et al. Relation of body fat distribution in men and
degree of coronary narrowings in coronary artery disease. Am J Cardiol.1992;70(13):1135-1138.
19. Auer J, Weber T, Berent R, et al. Obesity, body fat and coronary atherosclerosis. Int J Cardiol. 2005;98(2):227-235.
20. Phillips SD, Roberts W. Comparison of body mass index among patients with versus without angiographic coronary artery disease. Am J Cardiol.2007;100(1):18-22. 21. Rubinshtein R, Halon D, Jaffe R, Shahla J, Lewis B. Relation between obesity and
severity of coronary artery disease in patients undergoing coronary angiography. Am J Cardiol.2006;97(9):1277-1280.
22. Rossi R, Iaccarino D, Nuzzo A, et al. Influence of body mass index on extent of coronary atherosclerosis and cardiac events in a cohort of patients at risk of coronary artery
disease. NutrMetabCardiovasc Dis. 2011 Feb;21(2):86-93.
23. Afonso L, Niraj A, Veeranna V, Fakhry H, Pradhan J. Ethnic and Sex Differences in Disease Burden in Patients Undergoing Coronary Angiography: the Confounding Influence of Obesity. Ethn Dis. 2008;18(1):53-58.
24. Niraj A, Pradahan J, Fakhry H, Veeranna V, Afonso L. Severity of coronary artery disease in obese patients undergoing coronary angiography: obesity paradox revisited.
ClinCardiol. 2007;30(8):391-396.
26. Clark L, Karve M, Rones K, Chang-DeMoranville B, Atluri S, Feldman J. Obesity, distribution of body fat and coronary artery disease in black women. Am J
Cardiol.1994;73(12):895.
27. Wessel TR, Arant CB, Olson MB, et al. Relationship of physical fitness vs body mass index with coronary artery disease and cardiovascular events in women. Jama.
2004;292(10):1179.
28. Moher D, Cook DJ, S Eastwood, I Olkin, D Rennie, DF Stroup. Improving the quality of reports of meta-analyses of randomised controlled trials: the QUOROM statement. Lancet. 1999 Nov 27;354(9193):1896-900.
Original Manuscript
Introduction
Ischemic heart disease is the leading cause of death in the U.S., and there remain
significant gaps in our understanding of coronary artery disease (CAD), particularly in black and obese patients. Black patients have consistently been shown to have a lower angiographic burden of CAD, despite higher rates of traditional risk factors and poorer outcomes.1-7 Likewise, obese patients have significantly higher rates of adiposity-associated risk factors for heart disease including diabetes, hypertension, endothelial dysfunction, and lipid disorders.8-10 Excess
adiposity has also been positively associated with the incidence of coronary events.11-22
However, past studies have reported inconsistent results on the relationship of BMI and CAD.
23-33
No studies to date have examined this relationship in a separate cohort of white and black patients.
The low rate of angiographic CAD in blacks, coupled with high rates of obesity in this group suggests that there may be a different relationship between BMI and disease in white and black patients. 23,34-36, Understanding the relationship between obesity and CAD, as it varies by race, can aid in our understanding of the development of CAD and its variable presentation in different groups. In this study, we examine patients undergoing initial non-emergent
Methods
Study Design and Data Collection
This study is a secondary analysis of a comprehensive database of all cardiac
catheterizations performed at a single academic medical center in the southeastern United States. The hospital uses Apollo software, a proprietary reporting program (Lumedx, Oakland, CA) for data capture, storage, and reporting to the National Cardiovascular Disease Registry.37 Prior to each catheterization procedure, patient demographics are entered into the database by a
registration clerk and trained catheterization lab technicians and nurses while patient medical history and the clinical circumstances of the catheterization are entered by cardiology fellows. Following the procedure, detailed information on coronary anatomy findings, including the maximum percent stenosis found within each vessel, is entered by the physician who performed the procedure. A research nurse who is responsible for the integrity and consistency of the data subsequently reviews the data. Global data reviews are performed annually to ensure accuracy.
Study Sample
The database included 33,119 catheterization procedures performed from its inception through 24 October 2010. We identified 20,201 first-time, registry-listed cardiac catheterizations, and then selected the 12,256 of these that were performed after 1 August 2001 when data on coronary stenosis and severity were first routinely recorded. Of these individuals, 10,888 were at least 18 years of age at the time of procedure. For these patients undergoing a first angiography at this hospital, 2,544 were excluded for having previously confirmed CAD: 1,155 were
or emergent catheterization. Of the remaining 6,841 individuals, 6,136 were identified as black or white. Another 138 were dropped for missing BMI measurements. These exclusion criteria reduced the sample to 5,998 patients in an attempt to target black and white patients undergoing first angiography under elective circumstances for suspected, but not yet confirmed, CAD.
Study Variables of Interest
Prior to data analysis, we selected two outcome variables determined to be reflect
coronary artery disease severity: a modified Gensini score which summarizes the total burden of disease in all the vessels and ―significant stenosis‖ outcome which reflects a high degree of
stenosis in at least one vessel. The dichotomous significant stenosis variable was created from existing variables in the dataset defining stenosis in each major coronary artery segment assessed at angiography (left main artery, proximal left anterior descending, mid-distal left anterior
descending, left circumflex, right coronary artery), and was defined as either ≥50% stenosis in the left main artery or ≥70% stenosis in any other segment. The modified Gensini score is based
on the original scoring system that has been adapted by other relevant studies; it was created from existing variables in the dataset defining stenosis in five major coronary artery segments.38 Stenosis values from five major arterial segments (left main artery, left anterior descending, right circumflex artery, circumflex, distal left anterior descending) ranging from 0-100% were
Covariates for the multivariable analyses included age, sex, and traditional CAD risk factors (hypertension, diabetes, hyperlipidemia, smoking status, and family history of premature cardiovascular disease). All the independent variables are binary with the exception of age (continuous in years) and BMI (used both continuously and in strata in kg/m2).
Race information for each patient was entered by catheterization lab nurses and fellows, typically by copying race information recorded in the hospital’s electronic patient medical
records. Race information in the electronic patient medical records is available in two locations: on a patient demographics page that presents information recorded by registration clerks for administrative purposes and within physicians’ clinical notes. In most cases, it is likely not
self-reported.
Analysis Strategy
We compared characteristics and CAD risk factors among patients in our sample by race, obesity status, outcome, and outcome stratified by race, and tested for significance using Pearson’s χ2-test within categories and two-tailed t-tests for continuous measures.
Logistic regression modeling was used to examine the independent association of obesity with the likelihood of significant stenotic disease (defined by the dichotomous ―significant stenosis‖ outcome, or a Gensini score equal or greater than 10), controlling for traditional CAD
risk factors and demographics. We then fit separate logistic regression models by race.
ANCOVA was used to compare adjusted and unadjusted mean modified Gensini scores by BMI and race. Patients with missing outcome data were excluded from the multivariable analyses.
RESULTS
Sample patient characteristics and comparison by race
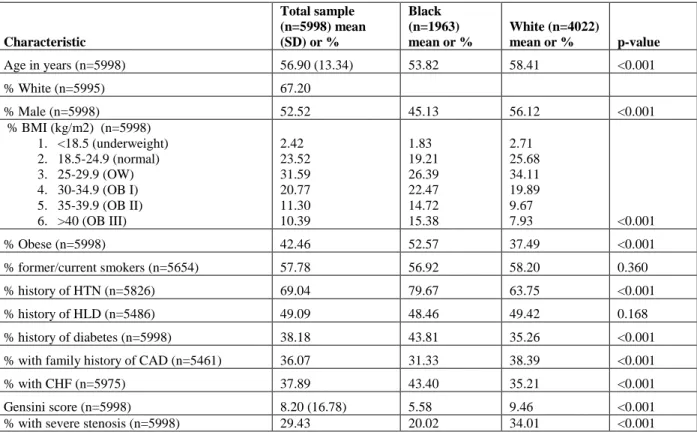
Of the 5,998 patients undergoing initial elective catheterization, approximately one-third (32.8%) were black. Slightly over half were male and almost half were obese. Black patients in the sample were significantlyyounger, more likely to be female, and had a greater prevalence of obesity, diabetes and hypertension (Table 1). Rates of smoking and hyperlipidemia were comparable between black and white patients.
CAD risk factors
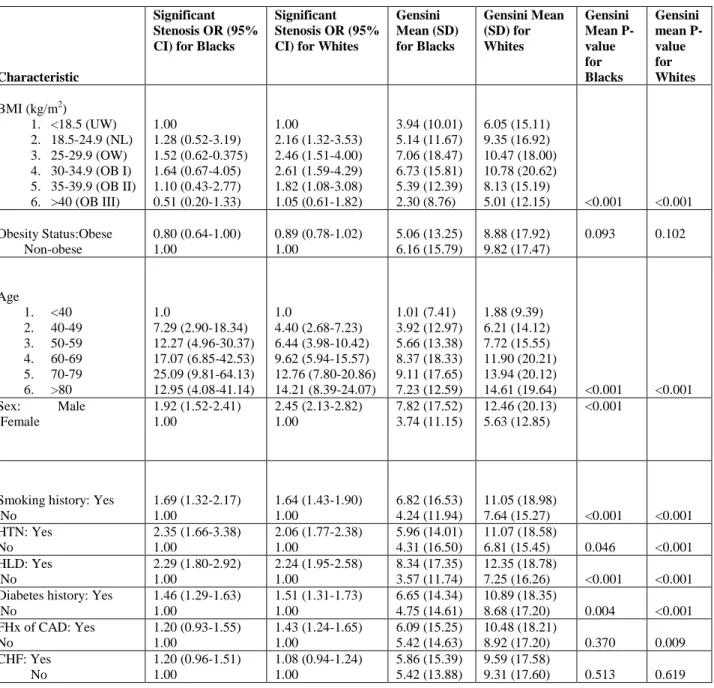
As expected, traditional risk factors for CAD (age, smoking, hypertension, hyperlipidemia, diabetes, and family history) were associated with positive findings on angiography (Table 2). For example, among patients with hypertension, the odds of having a significant stenotic lesion on angiography were over twice that of patients without hypertension (OR 2.22; 95% CI: 1.60-2.50). Similarly, the mean Gensini score for those with traditional CAD risk factors were consistently higher than those without the risk factor (P < 0.001 for all).
The odds of severe CAD initially increased along with BMI until risk peaks at Class I obesity (BMI of 30-34.9 kg/m2) for both races (Table 2). After which point, risk for disease then decreases with increasing BMI. However, the decrease in risk seen with increasing adiposity is exaggerated in blacks; very obese (Class III, BMI of >40 kg/m2) black subjects were half as likely to have a significant coronary stenosis compared to black, underweight subjects (OR 0.51, 95% CI 0.20-1.33). In contrast, very obesewhite subjects were equally likely to have a
for demographics and CAD risk factors mitigated the difference in odds of disease between obese and non-obese subjects.
Trends of Disease by Obesity
Among the entire sample, 42.5% of patients were obese (defined as a BMI greater than 30 kg/m2). The mean BMI of the sample patients was 30.2 kg/m2. Obese patients were younger, more likely to be female, less likely to smoke, and had a greater prevalence of hypertension, hyperlipidemia, diabetes, and family history of CAD (Table 3). Rates of CHF were comparable between obese and non-obese patients. Obese patients were less likely to have a significant stenosis when compared to their non-obese counterparts (OR 0.79, 95% CI 0.71-0.89). Likewise, the mean Gensini score for obese subjects was 1.5 points lower than for non-obese subjects (P < 0.001). When stratified by BMI class, prevalence and severity of CAD (as
quantified by mean Gensini score and odds ratio for significant stenosis) correlated to body mass in an upside down, U-shaped relationship (Figure 1).
This pattern was also seen when comparing percent with significant stenosis and mean Gensini score by race and BMI class (Table 3). However, despite BMI class or obesity status, black patients were consistently found to have less disease as measured by the two outcomes. Nonetheless, obese patients of either race were repeatedly found to have less disease than their underweight, normal weight, and overweight counterparts.
Black patients and angiographic burden of disease
change substantially after adjusting for demographics and CAD risk factors, with black patients still less likely (OR 0.57, 95% CI 0.48– 0.66) to have significant stenosis compared to whites. The outcome was similar using modified Gensini score (Table 4).
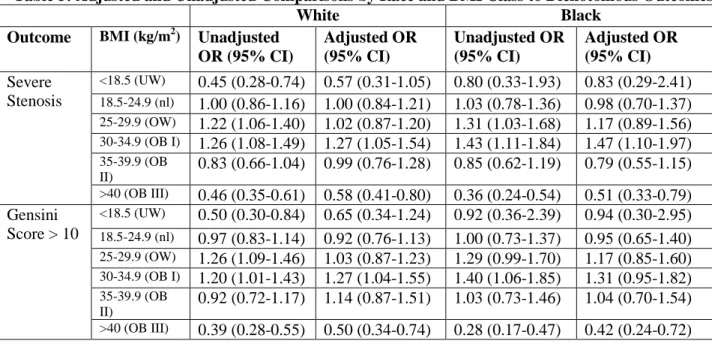
When the odds ratios for both outcomes were stratified by BMI class and compared across race, we again see the inverse parabolic relationship between body mass and severity of disease. In particular, the adjusted odds ratios of severe disease in patients with stage III obesity (>40 BMI) were approximately half those of other BMI classification (Table 5). The protective effect of severe obesity was larger in the black population. Interestingly, black, stage III obese patients were half as likely to have severe CAD compared to their black, underweight
counterparts (Table 2). White, stage III obese patients had equivalent odds of severe CAD compared to their white, underweight counterparts.
Race, obesity, and burden of disease
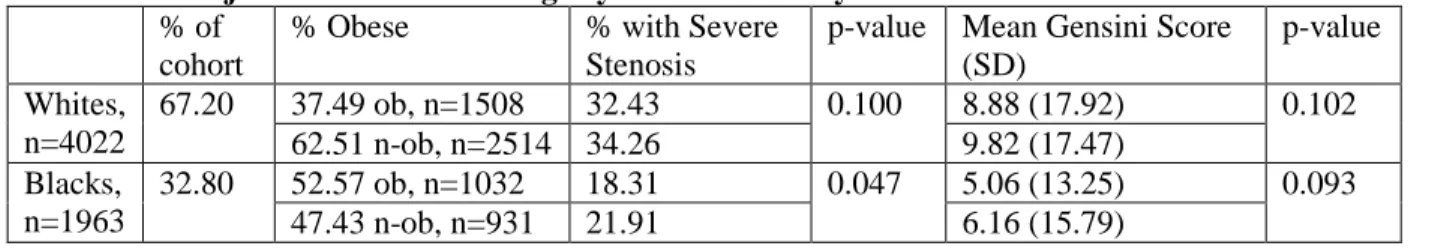
patients of both races using the Gensini score. Non-obese blacks were found to be significantly less likely than non-obese whites to have severe disease, while obese blacks are even less likely to have disease when compared to obese whites (Table 7).
DISCUSSION
Summary of findings
In our cohort of almost 6,000 white and black patients undergoing first-time elective angiography at a major academic medical center for suspected coronary artery disease, we found that black patients had consistently less disease than white patients despite having higher rates of obesity, hypertension, and diabetes. This curious paradox of less disease despite greater risk factors was not only seen in black patients, but also obese patients. Although the obese subgroup of our sample had a higher prevalence of hypertension, diabetes, hyperlipidemia, family history of CAD, and congestive heart failure, the very obese were consistently found to have much less disease than normal or even underweight subjects at otherwise similar risk.
Odds of severe CAD rise for both races with increasing BMI until they peak at stage I obesity and then fall with worsening obesity. While this inverted parabolic relationship is seen with both white and black patients, increasing BMI raises odds of CAD at a much greater rate in whites than in blacks. Also, the drop in risk seen with severe obesity, when compared to the underweight subjects of the appropriate race, falls twice as much for black patients as it does for white patients. Adjusting for CAD risk factors and demographics mitigated the difference in odds of disease between obese and non-obese patients and for those subjects with BMI
While both black race and obesity were found, independently, to be associated with less CAD when compared to white race and non-obesity, the protective effects of black race and obesity combined are summarized in the adjusted outcome findings across race by obesity status (Table 7). In our sample, non-obese black patients are significantly less likely to have severe CAD than non-obese white patients, but that obese black patients are even less likely to have severe CAD compared to obese white patients. Thus, black race and extreme obesity are
paradoxically associated with less disease despite the higher prevalence of traditional risk factors and incidence of CAD-related cardiac events known to exist in both groups. When black race and obesity overlap, the independently demonstrated safeguarding is amplified.
How our study fits in the literature
Our sample resembles those of previous studies evaluating racial disparities in CAD risk factors.41` Black patients tend to have higher rates of traditional risk factors for heart disease, including hypertension, obesity, and diabetes. However, black patients in our sample had a lower percentage of those with family history of CAD and rates of smoking and hyperlipidemia were equivalent between white and black patients. Also similar to past studies, we found in our study sample that traditional CAD risk factors were associated with the outcome measures for severe CAD. Although some studies have examined the lower prevalence of angiographic CAD in black patients, no studies have combined the dual relationships of race with obesity and CAD. In similar studies, BMI has been found to have an inconsistent association with the presence of coronary atherosclerosis, although black-white disparities across obesity-imposed risk has not been examined as it has with our sample. Similar studies typically use one or two angiographic outcomes to quantify atherosclerotic burden, though no studies have used the unique
score—used on both a continuous scale and as a dichotomous outcome for comparison of odds ratios.
Limitations
One limitation of the study is that race classification was based on information from the academic medical center’s records rather than self-identification. While this is not ideal, it is a
reality for most hospitals in the United States.42 The concern is for misclassification of race, which as been shown to happen on a small but significant scale in hospitals. However, the effect of this misclassification is nondifferential and would minimize rather than amplify differences found between races. Race itself is a difficult exposure variable to study, as it is a social
classification without necessarily reflecting genetic distinction.43 The diverging effect of obesity in black and white subjects on prevalence of severe CAD is multifaceted and complex, involving disparities in access to care, and clinical management patterns along with socioeconomic, health behavior, lifestyle, and historical differences between these groups.
Significance
We are unaware of any study to date with a primary focus on examining obesity as a contributing cause to the low rate of angiographic CAD in the black population. However, other causal variables, such has hypertension,45 have been found to possibly influence the racial disparity. Obesity, for whatever reason, has been demonstrated to be associated with lower rates of CAD. Given that blacks have higher rates of obesity in comparison to whites, obesity
provides a plausible, if not partial, explanation for the racial differences in rates of angiographic CAD. Other explanations for black patients having less CAD on angiography include naturally more favorable lipid profiles, younger age, and greater compensatory vascular remodeling in comparison to white patients.35,44
unwarranted referrals is likely higher in the very obese, where imaging, electrocardiography, and stress testing are particularly difficult—thus helping to explain the finding in this study of the morbidly obese to have significantly lower rates of CAD compared to other BMI classes.
This study, and its models that show obesity to decrease a black patient’s already lower
likelihood of angiographic CAD, provides credible evidence that adiposity may contribute to the black-white disparity seen in rates of atherosclerotic disease. Cardiac catheterization for
coronary angiography is an invasive procedure with considerable risks to the patient; a fuller understanding of how both black race and obesity may falsely elevate clinical suspicion for CAD could prevent unnecessary, potentially harmful cardiac catheterization in both groups. The hypothesis-generating results of this study suggest that further studies on the relationship
Table 1. Patient Characteristics by Race
Characteristic
Total sample (n=5998) mean (SD) or %
Black (n=1963) mean or %
White (n=4022)
mean or % p-value
Age in years (n=5998) 56.90 (13.34) 53.82 58.41 <0.001
% White (n=5995) 67.20
% Male (n=5998) 52.52 45.13 56.12 <0.001
% BMI (kg/m2) (n=5998) 1. <18.5 (underweight) 2. 18.5-24.9 (normal) 3. 25-29.9 (OW) 4. 30-34.9 (OB I) 5. 35-39.9 (OB II) 6. >40 (OB III)
2.42 23.52 31.59 20.77 11.30 10.39 1.83 19.21 26.39 22.47 14.72 15.38 2.71 25.68 34.11 19.89 9.67
7.93 <0.001
% Obese (n=5998) 42.46 52.57 37.49 <0.001
% former/current smokers (n=5654) 57.78 56.92 58.20 0.360
% history of HTN (n=5826) 69.04 79.67 63.75 <0.001
% history of HLD (n=5486) 49.09 48.46 49.42 0.168
% history of diabetes (n=5998) 38.18 43.81 35.26 <0.001
% with family history of CAD (n=5461) 36.07 31.33 38.39 <0.001
% with CHF (n=5975) 37.89 43.40 35.21 <0.001
Gensini score (n=5998) 8.20 (16.78) 5.58 9.46 <0.001
Table 2. Bivariate Associations Between Patient Risk Factors and Outcomes by Race
Characteristic
Significant Stenosis OR (95% CI) for Blacks
Significant Stenosis OR (95% CI) for Whites
Gensini Mean (SD) for Blacks Gensini Mean (SD) for Whites Gensini Mean P-value for Blacks Gensini mean P-value for Whites
BMI (kg/m2) 1. <18.5 (UW) 2. 18.5-24.9 (NL) 3. 25-29.9 (OW) 4. 30-34.9 (OB I) 5. 35-39.9 (OB II) 6. >40 (OB III)
1.00 1.28 (0.52-3.19) 1.52 (0.62-0.375) 1.64 (0.67-4.05) 1.10 (0.43-2.77) 0.51 (0.20-1.33) 1.00 2.16 (1.32-3.53) 2.46 (1.51-4.00) 2.61 (1.59-4.29) 1.82 (1.08-3.08) 1.05 (0.61-1.82) 3.94 (10.01) 5.14 (11.67) 7.06 (18.47) 6.73 (15.81) 5.39 (12.39) 2.30 (8.76) 6.05 (15.11) 9.35 (16.92) 10.47 (18.00) 10.78 (20.62) 8.13 (15.19)
5.01 (12.15) <0.001 <0.001
Obesity Status:Obese Non-obese 0.80 (0.64-1.00) 1.00 0.89 (0.78-1.02) 1.00 5.06 (13.25) 6.16 (15.79) 8.88 (17.92) 9.82 (17.47)
0.093 0.102
Age 1. <40 2. 40-49 3. 50-59 4. 60-69 5. 70-79 6. >80 1.0 7.29 (2.90-18.34) 12.27 (4.96-30.37) 17.07 (6.85-42.53) 25.09 (9.81-64.13) 12.95 (4.08-41.14) 1.0 4.40 (2.68-7.23) 6.44 (3.98-10.42) 9.62 (5.94-15.57) 12.76 (7.80-20.86) 14.21 (8.39-24.07) 1.01 (7.41) 3.92 (12.97) 5.66 (13.38) 8.37 (18.33) 9.11 (17.65) 7.23 (12.59) 1.88 (9.39) 6.21 (14.12) 7.72 (15.55) 11.90 (20.21) 13.94 (20.12)
14.61 (19.64) <0.001 <0.001 Sex: Male
Female 1.92 (1.52-2.41) 1.00 2.45 (2.13-2.82) 1.00 7.82 (17.52) 3.74 (11.15) 12.46 (20.13) 5.63 (12.85) <0.001
Smoking history: Yes No 1.69 (1.32-2.17) 1.00 1.64 (1.43-1.90) 1.00 6.82 (16.53) 4.24 (11.94) 11.05 (18.98)
7.64 (15.27) <0.001 <0.001 HTN: Yes No 2.35 (1.66-3.38) 1.00 2.06 (1.77-2.38) 1.00 5.96 (14.01) 4.31 (16.50) 11.07 (18.58)
6.81 (15.45) 0.046 <0.001 HLD: Yes No 2.29 (1.80-2.92) 1.00 2.24 (1.95-2.58) 1.00 8.34 (17.35) 3.57 (11.74) 12.35 (18.78)
7.25 (16.26) <0.001 <0.001 Diabetes history: Yes
No 1.46 (1.29-1.63) 1.00 1.51 (1.31-1.73) 1.00 6.65 (14.34) 4.75 (14.61) 10.89 (18.35)
8.68 (17.20) 0.004 <0.001 FHx of CAD: Yes
No 1.20 (0.93-1.55) 1.00 1.43 (1.24-1.65) 1.00 6.09 (15.25) 5.42 (14.63) 10.48 (18.21)
8.92 (17.20) 0.370 0.009 CHF: Yes No 1.20 (0.96-1.51) 1.00 1.08 (0.94-1.24) 1.00 5.86 (15.39) 5.42 (13.88) 9.59 (17.58)
Table 3: Patient Characteristics by BMI Class and Obesity Status Characteristi c Underweig ht (<18.5) mean (SD) or % Normal (18.5-24.9) mean (SD) or %
Overweig ht (25-29.9) mean (SD) or % Obese I (30-34.9) mean (SD) or % Obese II (35-39.9) mean (SD) or % Obese III (>40) mean (SD) or % p-value Non-Obes e mean (SD) or % Obese mean (SD) or % p-value
Age in years
52.8 (18.3) 58.7 (15.2) 58.6 (13.2) 56.3 (11.8) 54.7 (11.3) 52.3 (11.0) <0.00 1 58.4 (14.3) 54.9 (11.6) <0.00 1 % AA
24.8 26.7 27.4 35.5 42.6 51.4 <0.00
1 27.0
40.6 <0.00 1
% Male
51.7 53.8 61.7 53.9 43.5 29.1 <0.00
1 58.0
45.0 <0.00 1 %
former/curren t smokers
57.7 60.4 60.6 57.5 51.9 50.4 <0.00
1
60.4 54.3 <0.00 1
% history of HTN
49.3 58.4 65.6 74.4 80.0 84.8 <0.00
1
62.0 78.4 <0.00 1 % history of
HLD
27.4 38.9 49.7 54.6 55.4 56.5 <0.00
1
44.5 55.3 <0.00 1 % history of
diabetes
23.5 27.1 33.7 41.5 50.9 59.9 <0.00
1
30.6 48.5 <0.00 1 % with
family history of CAD
22.9 29.9 33.6 41.2 41.7 43.9 <0.00
1
31.6 42.0 <0.00 1
% with CHF 40.1 38.6 36.2 38.2 37.6 40.6 0.405 37.3 38.7 0.285
Gensini score
5.5 (14.0) 8.2 (15.8) 9.5 (18.2) 9.4 (19.2) 7.0 (14.1) 3.4 (10.7) <0.00 1
8.8 7.3 0.001
% with severe stenosis
18.6 30.3 33.3 33.6 25.1 14.8 <0.00
1
Table 4: Adjusted and Unadjusted Comparisons by Race and Obesity to Dichotomous Outcomes Outcome Characteristic Unadjusted OR Adjusted OR
Severe Stenosis Black race 0.49 (0.42-0.55) 0.57 (0.48-0.66) Obese 0.79 (0.71-0.89) 0.94 (0.81-1.09) Gensini Score >
10
Table 5: Adjusted and Unadjusted Comparisons by Race and BMI Class to Dichotomous Outcomes
White Black
Outcome BMI (kg/m2) Unadjusted OR (95% CI)
Adjusted OR (95% CI)
Unadjusted OR (95% CI)
Adjusted OR (95% CI) Severe
Stenosis
<18.5 (UW) 0.45 (0.28-0.74) 0.57 (0.31-1.05) 0.80 (0.33-1.93) 0.83 (0.29-2.41) 18.5-24.9 (nl) 1.00 (0.86-1.16) 1.00 (0.84-1.21) 1.03 (0.78-1.36) 0.98 (0.70-1.37) 25-29.9 (OW) 1.22 (1.06-1.40) 1.02 (0.87-1.20) 1.31 (1.03-1.68) 1.17 (0.89-1.56) 30-34.9 (OB I) 1.26 (1.08-1.49) 1.27 (1.05-1.54) 1.43 (1.11-1.84) 1.47 (1.10-1.97) 35-39.9 (OB
II) 0.83 (0.66-1.04) 0.99 (0.76-1.28) 0.85 (0.62-1.19) 0.79 (0.55-1.15) >40 (OB III) 0.46 (0.35-0.61) 0.58 (0.41-0.80) 0.36 (0.24-0.54) 0.51 (0.33-0.79)
Gensini Score > 10
<18.5 (UW) 0.50 (0.30-0.84) 0.65 (0.34-1.24) 0.92 (0.36-2.39) 0.94 (0.30-2.95)
18.5-24.9 (nl) 0.97 (0.83-1.14) 0.92 (0.76-1.13) 1.00 (0.73-1.37) 0.95 (0.65-1.40) 25-29.9 (OW) 1.26 (1.09-1.46) 1.03 (0.87-1.23) 1.29 (0.99-1.70) 1.17 (0.85-1.60) 30-34.9 (OB I) 1.20 (1.01-1.43) 1.27 (1.04-1.55) 1.40 (1.06-1.85) 1.31 (0.95-1.82) 35-39.9 (OB
Table 6: Unadjusted Outcome findings by race and obesity status % of
cohort
% Obese % with Severe
Stenosis
p-value Mean Gensini Score (SD)
p-value
Whites, n=4022
67.20 37.49 ob, n=1508 32.43 0.100 8.88 (17.92) 0.102 62.51 n-ob, n=2514 34.26 9.82 (17.47)
Blacks, n=1963
32.80 52.57 ob, n=1032 18.31 0.047 5.06 (13.25) 0.093
Table 7: Adjusted Outcome Findings across Race by Obesity Status
OR of severe
stenosis p-value
OR of Gensini >
10 p-value
Obese blacks 0.54 (0.43-0.67) <0.001 0.53 (0.41-0.68) <0.001 Obese whites
Figure 1. Unadjusted OR for Significant Stenosis and Mean Gensini Score by BMI Classification for Black and White Patients
References
1. Jha AK, Varosy PD, Kanaya AM, Hunninghake DB, Hlatky MA, Waters DD, Furberg CD,
Shlipak MG. Differences in medical care and disease outcomes among black and white women
with heart disease. Circulation 2003; 108:1089–1094.
2. Clark LT. Issues in minority health: atherosclerosis and coronary heart disease in African
Americans. Med Clin North Am 2005; 89:977–1001, 994.
3. Shaw LJ, Shaw RE, Merz CN, Brindis RG, Klein LW, Nallamothu B, Douglas PS, Krone RJ,
McKay CR, Block PC, Hewitt K, Weintraub WS, Peterson ED; American College of
Cardiology-National Cardiovascular Data Registry Investigators. Impact of ethnicity and gender differences
on angiographic coronary artery disease prevalence and in-hospital mortality in the American
College of Cardiology-National Cardiovascular Data Registry. Circulation 2008; 117: 1787–
1801.
4. Heron M, Hoyert DL, Murphy SL, Xu J, Kochanek KD, Tejada-Vera B. Deaths: final data for
2006. Natl Vital Stat Rep 2009; 57:1–134.
5. Bransford TL, Ofili E. The paradox of coronary heart disease in African-American women. J Natl
Med Assoc2000; 92:327–333.
6. Onwuanyi AE, Abe O, McMahon DJ, Weil HF, Philbin EF, Francis CK, Marx H, Reed RG.
Disparity in frequency of normal coronary artery in black and white patients undergoing cardiac
catheterization. Ethn Dis 2006; 16:370–374.
7. Whittle J, Kressin NR, Peterson ED, Orner MB, Glickman M, Mazzella M, Petersen LA. Racial
differences in prevalence of coronary obstructions among men with positive nuclear imaging
studies. J Am CollCardiol2006; 47:2034–2041.
8. Lavie C, Milani R, Ventura H. Obesity and cardiovascular disease: risk factor, paradox, and
9. Marinou K, Tousoulis D, Antonopoulos AS, Stefanadi E, Stefanadis C. Obesity and
cardiovascular disease: From pathophysiology to risk stratification. Int J Cardiol.
2010;138(1):3-8.
10. Brandon L, Mullis R, Jonnalagadda S, Hughes M. Relationships and CHD risks of BMI,
lipoproteins, lipids, and blood pressure in African-American men and women. Prev Med.
2005;40(3):349-354.
11. National Institutes of Health (NHLBI). Clinical guidelines on the identification, evaluation and
treatment of overweight and obesity in adults: executive summary. Am J Clin Nutr.1998;68:899–
917.
12. Calle EE, Thun MJ, Petrelli JM, Rodriguez C, Heath CW. Body mass index and mortality in a
prospective cohort of US adults. N Engl J Med. 1999;341:1097–1105.
13. Jonsson S, Hedblad B, Engström G, Nilsson P, Berglund G, Janzon L. Influence of obesity on
cardiovascular risk. Twenty-three-year follow-up of 22,025 men from an urban Swedish
population. Int J ObesRelatMetabDisord. 2002;26:1046–1053.
14. Lamon-Fava S, Wilson PW, Schaefer EJ. Impact of body mass index on coronary heart disease
risk factors in men and women. The Framingham offspring study. ArteriosclerThrombVasc
Biol. 1996;16:1509–1515.
15. Kannel WB, Wilson PW, Nam BH, D'Agostino RB. Risk stratification of obesity as a coronary
risk factor. Am J Cardiol. 2002;90:697–701.
16. Wolk R, Berger P, Lennon RJ, Brilakis ES, Somers VK. Body mass index. A risk factor for
unstable angina and myocardial infarction in patients with angiographically confirmed coronary
artery disease. Circulation. 2003;108:2206–2211.
17. Wolk R, Berger P, Lennon RJ, Brilakis ES, Somers VK. Body mass index. A risk factor for
unstable angina and myocardial infarction in patients with angiographically confirmed coronary
18. Adams KF, Schatzkin A, Harris TB, Kipnis V, Mouw T, Ballard-Barbash R, et al. Overweight,
obesity, and mortality in a large prospective cohort of persons 50 to 71 years old. N Engl J
Med. 2006;355:763–778.
19. Dey DK, Lissner L. Obesity in 70-year-old subjects as a risk factor for 15-year coronary heart
disease incidence. Obesity. 2003;11(7):817-827.
20. Jonsson S, Hedblad B, Engstrˆm G, Nilsson P, Berglund G, Janzon L. Influence of Obesity on
Cardiovascular Risk. Twenty-three-year follow-up of 22 025 men from an urban Swedish
population. Int J Obes. 2002;26(8):1046-1053.
21. Kim KS, Owen WL, Williams D, Adams-Campbell LL. A Comparison between BMI and
Conicity Index on Predicting Coronary Heart Disease:: The Framingham Heart Study. Ann
Epidiol. 2000;10(7):424-431.
22. Grundy SM, Pasternak R, Greenland P, Smith Jr S, Fuster V. Assessment of cardiovascular risk
by use of multiple-risk-factor assessment equations: a statement for healthcare professionals from
the American Heart Association and the American College of Cardiology. Circulation.
1999;100(13):1481.
23. Al Suwaidi J, Higano S, Hamasaki S, Holmes D, Lerman A. Association between obesity and
coronary atherosclerosis and vascular remodeling. Am J Cardiol.2001;88(11):1300.
24. Tanaka K, Kodama H, Sasazuki S, et al. Obesity, body fat distribution and coronary
atherosclerosis among Japanese men and women. Int J Obes. 2001;25(2):191-197.
25. Zamboni M, Armellini F, Sheiban I, et al. Relation of body fat distribution in men and degree of
coronary narrowings in coronary artery disease. Am J Cardiol.1992;70(13):1135-1138.
26. Auer J, Weber T, Berent R, et al. Obesity, body fat and coronary atherosclerosis. Int J Cardiol.
2005;98(2):227-235.
27. Phillips SD, Roberts W. Comparison of body mass index among patients with versus without
28. Rubinshtein R, Halon D, Jaffe R, Shahla J, Lewis B. Relation between obesity and severity of
coronary artery disease in patients undergoing coronary angiography. Am J
Cardiol.2006;97(9):1277-1280.
29. Rossi R, Iaccarino D, Nuzzo A, et al. Influence of body mass index on extent of coronary
atherosclerosis and cardiac events in a cohort of patients at risk of coronary artery disease.
NutrMetabCardiovasc Dis. 2009.
30. Afonso L, Niraj A, Veeranna V, Fakhry H, Pradhan J. Ethnic and Sex Differences in Disease
Burden in Patients Undergoing Coronary Angiography: the Confounding Influence of Obesity.
Ethn Dis. 2008;18(1):53-58.
31. Niraj A, Pradahan J, Fakhry H, Veeranna V, Afonso L. Severity of coronary artery disease in
obese patients undergoing coronary angiography:ìobesityparadoxî revisited. ClinCardiol.
2007;30(8):391-396.
32. Adams-Campbell LL, Peniston RL, Kim KS, Mensah E. Body mass index and coronary artery
disease in African-Americans. Obes Res. 1995 May;3(3):215-9.
33. Clark L, Karve M, Rones K, Chang-DeMoranville B, Atluri S, Feldman J. Obesity, distribution of
body fat and coronary artery disease in black women. Am J Cardiol.1994;73(12):895.
34. Abell J, Egan B, Wilson P, et al. Differences in cardiovascular disease mortality associated with
body mass between black and white persons. Am J Public Health. 2008 January; 98(1): 63-66.
35. Litovsky SH, Farb A, Bruke AP, et al. Effect of age, race, body surface area, heart weight and
atherosclerosis on coronary artery dimensions in young males. Atherosclerosis. 1996 June;
123(1-2):243-50.
36. Carroll JF, Chiapa AL, Rodriquez M, Phelps DR, Cardarelli KM, Vishwanatha JK, Bae S,
Cardarelli R. Visceral fat, waist circumference, and BMI: impact of race/ethnicity. Obesity. 2008
Mar;16(3):600-7.
37. National Cardiovascular Data Registry. NCDR. <http://www.ncdr.com/webncdr/ common/>
38. Gensini GG. A more meaningful scoring system for determining the severity of coronary heart
disease. Am J Cardiol.1983;51(3):606.
39. Unkelbach K, Gardemann A, Kostrzewa M, Philipp M, Tillmanns H, Haberbosh W. A new
promoter polymorphism in the gene of lipopolysaccharide receptor CD14 is associated with
expired myocardial infarction in patients with low atherosclerotic risk profile. Art Throm Vasc
Biol 1999; 19:932-938.
40. Sasazuki S, Kodama H, Yoshimasu K, et al. Relation between green tea consumption and severity
of coronary atherosclerosis among Japanese men and women. Ann Epid 2000; 10:401-408.
41. Kurian AK, Cardarelli KM. Racial and ethnic differences in cardiovascular disease risk factors: a
systematic review. Ethn Dis 2007; 17:143–152.
42. Hasnain-Wynia R, Pittman M, Pierce D. Who, When and How: The Current State of Race,
Ethnicity, and Primary Language Data Collection in Hospitals. The Common Wealth Fund; 2004.
43. Sue S, Dhindsa MK. Ethnic and racial health disparities research: issues and problems. Health
EducBehav 2006; 33:459–469.
44. Daniels SR, Khoury PR, Morrison JA. The utility of body mass index as a measure of body
fatness in children and adolescents: differences by race and gender. Pediatrics 1997; 99:804-807.
45. Morrison JA, Khoury PR, Mellies M, Kelly K, Horvitz R, Glueck C. Lipid and lipoprotein