1
The Effect of Adopting the Common Application on
College Admissions Outcomes
Senior Honors Thesis
Harry Edwards
April 2017
Economics Department
University of North Carolina at Chapel Hill
Thesis Advisor: Dr. Steven Hemelt
Faculty Advisor: Dr. Klara Peter
Approved:
2
Acknowledgments
I would like to sincerely thank my advisor, Dr. Steven Hemelt, for his insight, patience, and
encouragement at every stage of this process, as well as Dr. Klara Peter for making sure that I
stayed on schedule and on mission at all times. I would also like to thank David Kang and Reed
Williams for providing valuable feedback on various drafts, and thank and congratulate all of my
classmates for completing fascinating and inspiring research projects. The Common Application,
the College Board, and the Morehead-Cain Foundation all provided assistance in accessing crucial
3 Abstract
This paper evaluates the effect of Common Application membership on important admissions
outcomes for public and private four-year postsecondary institutions in the United States. I find
that adopting the Common Application increases applications by 5.1% and decreases yield by
4.2%, but I find little evidence of downstream impacts on enrollment or retention. The effect of
Common Application membership upon applications loses statistical significance when the sample
is limited to public universities, but triples in magnitude when the sample is limited to elite
universities, defined as those with top decile SAT scores. Additionally, I estimate that requiring
an application essay reduces applications by 6.3%, and increasing the application fee by $10
reduces applications by 1.85%. These findings reaffirm that small changes to the college
application process can have substantial impacts, help to resolve discrepancies present in the
4
I. Introduction
The decision of whether and where to attend college is one of the most important decisions
a person will make. The importance of finding a good college match on lifetime earnings and
personal wellbeing has been well established (Bowen et al., 2015). In the face of such an enormous
costs and benefits, you would expect the relatively minor costs of applying to colleges to pale in
comparison. However, a growing literature suggests that small changes to the college application
process can have dramatic welfare impacts (Avery et al., 2014). The aim of this paper is to evaluate
the impact of an increasingly fundamental component of the college application process – the
Common Application – on important admissions outcomes for students and universities alike, such
as number of applications received, yield rate, and levels of minority enrollment. The Common
Application, established in 1975, has streamlined the college application process and has been
adopted by more than 700 colleges.
Improving our understanding of the institutional impact of adopting the Common
Application would be valuable for several reasons. First, it would inform institutional decisions as
to whether to adopt the Common Application, or how to design their own independent application
process. For example, institutions may want to know whether their acceptance rates would
decrease and thereby improve their rankings, whether their yield rates would decrease, and whether
it would help attract applicants from traditionally underrepresented backgrounds. Second, to the
extent that aggregate effects are symptomatic of individual effects, it would improve our
understanding of how individuals from different backgrounds make college application decisions.
Third, increasing college enrollment is a high priority of the federal government and many state
5
be a more immediate and cost-effective strategy than, for example, decreasing tuition levels or
creating community outreach programs.
Just two papers have been written on the institutional impacts of adopting the Common
Application. The first, Liu et al. (2007), evaluated the impact of adopting the Common Application
at private universities from 1975-2004. They found large positive impacts on a range of outcomes,
from number of applications received to diversity of enrollment. Smith et al. (2015), meanwhile,
found few if any statistically significant impacts on a sample of public and private universities
which adopted the Common Application between 2003 and 2014. The key contributions of my
thesis are therefore to resolve the disagreements found in the existing literature, and to establish
for the first time the impact of adopting the Common Application upon public universities. Liu et
al. focused exclusively on private universities and although some public universities were included
in Smith et al.’s sample, no disaggregated results were provided. There is good reason to expect
that publics may experience differential effects to privates – they likely attract a different applicant
pool and they may have differing admissions priorities. Since the vast majority of students attend
public universities, this is arguably a question of greater relevance and importance.
The results of my analysis suggest that adopting the Common Application does increase
the number of applications received by the average university, but by less than was estimated by
Liu et al., most likely because their sample did not include public universities. A key finding of
my analysis is that Common Application membership has no statistically significant impact on the
average public university. Even more importantly, I find that the effect of membership upon
applications is highly concentrated within a small group of elite universities, defined as those with
top decile SAT scores. These universities receive approximately 15% percent more applications
6
Consistent with Smith et al., little evidence is found of membership affecting enrollment or
retention outcomes. Additionally, I estimate that requiring an application essay reduces
applications by 6.3%, and increasing the application fee by $10 reduces applications by 1.85%.
Adopting the Common Application reduces yield, while increasing application fees and requiring
an application essay increases yield, suggesting that students are sensitive to both the amount of
time and the amount of money it takes to apply to a certain college. Acceptance rates are not
affected by any of these characteristics, implying that universities extend more offers of admission
when they receive more applications.
This paper proceeds with a description of the history and characteristics of the Common
Application in Section II, followed by a review of the literature relevant to college applications in
Section III. Section IV then proposes a theoretical model of a student’s decision of whether to
apply to a particular college, which is linked to aggregate effects which you might expect to see at
the institutional level. Sections V describe the sources of institution-level data which will inform
my analyses, and then Section VI provides summary statistics. Section VII proposes
complementary empirical models for estimating the impact of adopting the Common Application
upon various admissions outcomes. Section VIII outlines the headline results of this paper, before
exploring possible heterogeneity, various auxiliary outcomes, and an instrumental variable
7
II. The Common Application
The Common Application is a non-profit organization with the explicit goal of encouraging
access and equity in the college application process. The premise since its establishment in 1975
has been that the process could be streamlined if applicants were able to submit a single form to
multiple colleges. This form requires demographic information, an extracurricular list, counselor
and teacher references, and a personal essay of 500 words or more on one of six topics, selected
by the student. Colleges can choose to make the personal essay optional for applicants, but it is
required by 90% of members. They moved the application online in 1998, and in 2001 they started
to accept public universities, having catered only to selective private universities before. More
recently they have also started accepting international institutions, primarily from the United
Kingdom. At the time of writing they have more than 700 member institutions, of which more than
100 are public US universities. The graph below shows the gradual diffusion of the Common
Application since inception in 1975 and since they started accepting public universities in 2001.
0 100 200 300 400 500 600
1975 1980 1985 1990 1995 2000 2005 2010 2015
Adoption of the Common Application 1975-2015
8
Though this is still only a fraction of the more than 4,000 four-year colleges in the United States,
it is more like a majority of colleges which are usually considered selective (approximately
two-thirds of colleges with acceptance rates below 40% have adopted the Common Application).
Member colleges are able to personalize their application forms by requiring supplementary
essays, and they still charge their own application fees, of which $3.75 goes to the Common
Application. They have the option of continuing to accept applications through other means, but
in that case they are charged $4.75 per application. A serious competitor emerged for the first time
in 2007, known as the Universal College Application, which at the time of writing has 124 member
institutions, many of which also use the Common Application. The Common Application has
experienced some technical issues in recent years, resulting in delayed application deadlines,
which may have prompted formerly exclusive members of the Common Application to adopt the
Universal College Application as a backup system.
A more fundamental challenge to the Common Application has recently emerged, in the
shape of the Coalition for Access, Affordability, and Success. The Coalition started accepting
applications in January 2016, and has already attracted more than 80 members, including every
Ivy League institution, and elite public institutions such as UNC Chapel Hill and the University of
Virginia. Membership is restricted to universities that meet full financial need of admitted students
and have six-year graduation rates of above 70% (Jaschik, 2015). Students will be able to create
portfolios when they start the ninth grade, with the idea being that universities will be able to
connect more deeply with applicants throughout high school, especially if they come from
traditionally underrepresented backgrounds. Although this paper will focus solely on the Common
9
dissatisfaction with the Common Application, but also that elite universities are actively searching
for ways to improve their application processes.
III. Literature Review
The motivating issue for close study of the college application process is the extent of
academic undermatching in terms of college enrollment outcomes, especially amongst students
from underrepresented backgrounds. Hoxby & Avery’s (2012) landmark study found that the vast
majority of high-achieving low-income students, a group they term the “missing one-offs”, do not
apply to a single selective college, even though they would likely be accepted and receive generous
financial aid packages. This is in opposition to high-income students who tend to apply to a wide
range of colleges often regardless of their academic ability, thereby minimizing their chances of
undermatching. Smith, Pender, and Howell (2013) use ELS data from 2004 to estimate that 41%
of all college-going students are actually under-matched. They find that under-matching is highly
correlated with being first generation, having low socioeconomic status, and living in a rural area,
which is consistent with Hoxby & Avery’s findings. These findings suggest that the immense focus
placed upon academic qualifications and succeeding when at college may be overlooking a crucial
intermediate step. Indeed, Avery & Kane (2004) found that many students completed several parts
of the college application process – a clear sign of interest and commitment – but failed to complete
enough parts to be considered for admission. Furthermore, Jonathan Smith’s paper on the effect of
college applications on enrollment conclusively showed that simply applying to more colleges
increases a student’s chance of both being accepted by a college and enrolling in a college given
acceptance (Smith 2013). This suggests that increasing the number of applications students submit
10
Much recent research has focused on identifying barriers in the application process and
estimating the potential impact of removing those barriers. For example, when students apply to
college they typically have to take an ACT or SAT test. Before 1997, the ACT charged students
$6 to send their score to a university, although the first three “score sends” were free of charge. In
1997, they increased the free score send allowance from three to four. You would expect this to
have a negligible impact upon college application decisions because the marginal cost of sending
a fourth application had only decreased by $6, which is a tiny amount when compared to the
expected boost in lifetime earnings that would come from being admitted to a selective college.
Amanda Pallais uses confidential data from the ACT to investigate the impact of this change on
college application patterns (Pallais, 2015). She finds that low-income students applied to many
more colleges as a result of the ACT making an additional score send available for free, and they
actually ended up attending more selective colleges as a result. This suggests that college
applicants are not making rational decisions, and that behavioral nudges may be more effective
than economic interventions (such as the existence of fee waivers).
Hoxby & Turner (2013) use the randomized assignment of an information provision
program called “Expanding College Opportunities” to evaluate its impact upon college application
and enrollment patterns of high achieving, low income students. The program informed these
students of how to apply to certain colleges, of the net cost of attending those colleges, and even
facilitated the process by providing no-paperwork application fee waivers. They found that the
program substantially increased the number and quality of colleges to which these students chose
to apply, and that it was highly cost effective. The program cost approximately $6 per student, and
students were not only more likely to apply to more selective colleges, with higher graduation rates
11
Furthermore, their grades were just as good as the grades of those students in the control group
who were at less selective colleges and therefore should have found it easier to get good grades.
Arguments have also been made in favor of constructing application barriers. These
arguments tend to suggest that barriers act as screening mechanisms, by discouraging applications
from students who may not be very interested in attending and ensuring that applicant pools consist
mostly of students who are both qualified and interested. This could be desirable for colleges since
it takes resources to evaluate each application they receive, and they may have an interest in
maximizing yield (i.e. not giving offers to students who will turn them down). There could also be
a welfare justification if students end up enrolling at colleges they knew little about, and as a result
do not succeed academically and perhaps even drop out. Smith et al. (2015) find that although
application fees and essays do limit application volume, and essays modestly increase yield, they
have little if any effect on enrollment and retention, meaning that they function as relatively
ineffective screening mechanisms.
My paper will focus on the institution-level impact of adopting the Common Application,
but two papers have evaluated the impact of adoption on decision making at an individual rather
than aggregated level. Klasik (2012) uses a difference-in-differences technique between the NELS
(1992) and ELS (2004) cohorts to establish whether a student is more likely to apply to a college
in 2004 than in 1992 if that college adopted the Common Application between 1992 and 2004. He
finds that students who live close to adopting schools are more likely to apply and enroll at a
college, and specifically at in-state public universities, although this is an unusual finding since
very few public universities had adopted the Common Application as of 2004. Smith (2013)
attempts a similar evaluation in pursuit of a suitable instrumental variable for applying to college,
12
likelihood of a student applying to college. Both of these papers lack some external validity due to
their reliance on geographical proximity, but they suggest that adopting the Common Application
is an effective means of lowering application barriers.
Though the Common Application is long established, its impact upon institutional
admissions outcomes is still imperfectly understood. The first and most definitive study of its
impact was Liu et al.’s 2007 paper. They evaluated the impact of adopting the Common
Application on private universities from 1975 to 2004. They found that adoption increased the
number of applications received by 5.7-7.0%, and decreased yield by 2.8-3.9%. Membership also
increased the percent students of color enrolled, decreased the mean SAT score, and had no impact
on the percent of students receiving Pell grants. The most similar paper is Smith et al.’s (2015)
discussion of screening mechanisms, of which the Common Application is a significant though
not primary focus. They evaluated 885 four-year colleges between 2003 and 2014, with a view to
establishing the impact of changes to application fees and supplementary essay requirements while
controlling for use of the Common Application, and their most advanced specifications found no
statistically significant impact of the Common Application on most outcomes of interest, including
the number of applications received. Interestingly, the only exception was an increase in the
percent students of color enrolled.
Smith et al. posit two theories for the inconsistency. First, they note that their analysis took
place across a different time period. It is possible that adoption has a less dramatic impact now
than it did in the past, but this seems unlikely since so many more applicants use the Common
Application today than during Liu et al.’s period of analysis. Second, they argue that their
expanded set of covariates, especially SAT score send data which was unavailable to Liu et al.,
13
set of covariates is a better estimation method than Liu et al.’s instrumental variable approach. A
third possibility is that Smith et al.’s analysis covered public and private colleges whereas Liu et
al. limited their sample to private colleges given the relative scarcity of public membership during
their period of analysis. Smith et al.’s paper does not explore the possibility of heterogeneous
impacts between publics and privates, but it is possible that if adoption impacts publics less than
privates then the inclusion of publics may be the source of the discrepancy.
IV. Theoretical Model
We can think about the college application decision as an exercise in maximizing expected
utility, subject to constrained time and money.
E[NPV] = P(E|A) x P(A) x [Y - (Ce + OCe) - (Ca + OCa)] E[NPV] > 0 → APPLY
P(A) = probability of acceptance. P(E|A) = probability of enrollment given acceptance. Y
= discounted lifetime earnings. Ce = discounted cost of enrollment, OCe = opp. cost of
enrollment. Ca = cost of application. OCa = opportunity cost of application.
Rational applicants would apply to as many colleges as have a positive net present value (NPV)
of applying, subject to their budget and time constraints. However, the economic gains of attending
college are probably large enough for the NPV of applying to be positive in the majority of cases,
and yet we don’t see students applying to very large numbers of colleges, even though many have
sufficient resources to do so. There are two possible explanations for this. First, it could be
explained by diminishing marginal utility. For example, if you are already applying to one safety
school, then your expected utility increases little from applying to another. Second, they may be
14
of admittance, then you may decide not to apply even though your NPV could still be large and
positive. We could consider discounting at a very high rate to account for a strong present bias.
This model yields two relevant predictions. First, students are more likely to apply to a
college if it is inexpensive to do so, in terms of either time or money. The Common Application
does reduce the effort required to apply to a particular college, and so you would expect more
students to apply to that college. Second, students will respond heterogeneously to application
requirements because different students have different budget constraints. This means that colleges
adopting the Common Application should expect to receive not only more applications but
applications of a different kind. You would expect students from low SES backgrounds, or from
underrepresented racial or geographic minorities to have tighter budget constraints, and so
adopting the Common Application may increase applications from minority communities relative
to traditionally well-represented communities. However, you could argue that although the
widespread diffusion of the Common Application has dramatically reduced the effort required to
apply to college, the financial burden of applying remains high. After all, if you apply to ten
colleges via the Common Application you only have to submit one form but you have to pay ten
application fees. This could adversely affect students from low SES backgrounds who have a small
financial budget but a large effort budget. Additionally, it is likely, but not inevitable, that we
would see some downstream effects on admittance and enrollment if there is an impact on
applications. Smith’s 2013 paper shows that applying to more colleges unambiguously improves
a student’s chance of both acceptance and enrollment conditional upon acceptance, and so we
would expect this phenomenon to be reflected in the aggregate.
We might worry about the Common Application encouraging frivolous or uninformed
15
then we would expect to see acceptance rates decrease (although this would happen regardless if
enrollment is fixed in the short term), yield rates decrease, and perhaps even first-year retention
rates decrease. Colleges may appreciate a fall in acceptance rates since that can be seen as a
measure of prestige, but falling yield rates or retention rates could be problematic.
V. Data Sources
My analysis will rely upon data from three distinct sources: The Common Application, the
Integrated Postsecondary Education Data System (IPEDS), and the College Board’s Annual
Survey of Colleges (ASC).
The Common Application was kind enough to provide a complete record of all of their
member institutions alongside the year in which that institution first joined the Common
Application. This allows me to encode a binary variable for Common Application usage for all
postsecondary institutions in each year from 1975 to 2015. These institutions may still accept
applications via other methods, but we can assume that an institution has accepted applications via
the Common Application each and every year since joining. It is possible that some institutions
were once members but left at some point, and unfortunately I was unable to gain access to a record
of such occurrences. I should note that if an institution joined the Common Application in 2006
then students were able to apply during the 2006-07 academic year to start attending during the
2007-08 academic year.
IPEDS is a longitudinal dataset which is collected annually by the National Center for
Educational Statistics (NCES) and contains data from more than 7,500 postsecondary institutions
which participate in federal financial aid programs. Their participation in the survey is required by
16
since around 2002. The last year for which reporting has been at least provisionally completed is
the 2014-15 academic year. IPEDS contains extensive data related to institutional characteristics,
cost of attendance, student demographics, and more. Demographics, however, are available only
for enrolled students, and unfortunately not for admitted students or for applicants. This means
that we will not be able to observe direct evidence of a changing applicant pool, although a
changing enrolling class of students would be suggestive of a changing applicant pool.
Finally, the College Board’s Annual Survey of Colleges (ASC) contains institutional data
above and beyond those contained in IPEDS, especially in relation to small details of the
application process. The ASC is a web-based survey of nearly 4,000 accredited colleges and
universities which respond on a voluntary basis. It contains several independent variables of
interest, such as application fee levels, essay, interview, and standardized testing requirements,
and presence of an early action plan, as well as additional dependent variables such as number of
early applications or number of transfer applications received. The ASC even asks colleges to rank
their admissions priorities from highest to lowest priority, which could yield insights into what
sort of changes in institutional priorities may prompt adoption of the Common Application. ASC
data is considered proprietary by the College Board and is therefore not publicly available, but we
arranged a data agreement for the purposes of this research project. The dataset I received extended
back to 1995, but the years prior to 2003 proved prohibitively difficult to clean. Nevertheless, all
three datasets cover the 2003-2015 period, which is sufficient for my purposes.
Many variables of interest were contained in both IPEDS and the ASC, in which case I
used the ASC dataset as the definitive record, but replaced any missing values with IPEDS values
in the event that a data point was missing in ASC was not missing in IPEDS. For almost all
17
responded to each survey with the same set of data. There are many missing values in both datasets,
which will be addressed to some extent in the following section. The only variable which required
substantive manipulation on my part was an approximation for mean SAT score, for which I
calculated the sum of the averages of the 25th and 75th percentiles of math scores and verbal scores.
The only variable sourced from elsewhere is the state-level control for high school graduating
cohort which came from the Digest of Education Statistics published by the NCES.
VI. Summary Statistics
The following summary statistics reflect a panel dataset created using publicly available
IPEDS data, proprietary ASC data from the College Board, and membership data provided by the
Common Application. The first table summarizes key variables for all public and private, 4 year
non-profit colleges for the twelve-year period between academic year 2003/04 and 2014/15. This
is an appropriate sample because the Common Application is only available to 4-year non-profit
colleges. The full sample consists of every institution which has reported any data to IPEDS, but
the analytic sample excludes institutions which fail to report number of applications received,
tuition, application fee, fee waiver available, percent minority students, average SAT score, and
early action plan available. These core variables are essential to most of my results. This limits the
sample from upwards of 20,000 observations to 11,005 observations across 12 years and 1309
institutions. Some gaps exist in the panel, but usually colleges either report every year or not at all.
Size gives the total undergraduate enrollment. Measures of tuition include all mandatory
fees. The variable satmean is an approximation of the average SAT score (out of 1600). The
variables commonapp, essay, testsrqd, interview, and earlyaction are binary variables for whether
18
interview, or offers an early action plan. The variable pctminority reflects the percentage of
first-years who identify as either Black or Hispanic, pctintls the percentage of first-first-years who are
international students, and pctpell the percentage of undergraduates who receive Pell grants.
Retention is the percentage of students who return for their second year at college. Feewaiver
denotes whether the application fee can be waived on the basis of financial need. Admitrate is an
acceptance rate, given by admissions/applicants, and yield is given by enrollees/admissions.
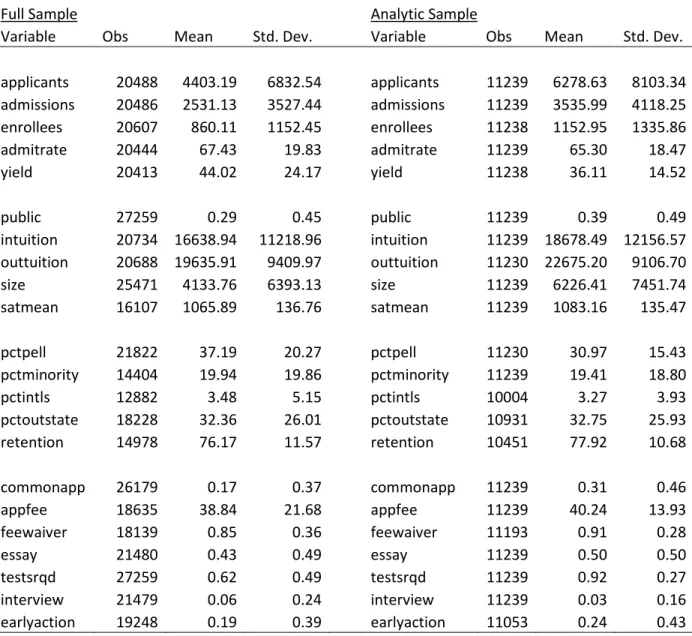
Table 1 – Summary Statistics for Full vs Analytic Sample
Full Sample Analytic Sample
Variable Obs Mean Std. Dev. Variable Obs Mean Std. Dev.
applicants 20488 4403.19 6832.54 applicants 11239 6278.63 8103.34 admissions 20486 2531.13 3527.44 admissions 11239 3535.99 4118.25 enrollees 20607 860.11 1152.45 enrollees 11238 1152.95 1335.86
admitrate 20444 67.43 19.83 admitrate 11239 65.30 18.47
yield 20413 44.02 24.17 yield 11238 36.11 14.52
public 27259 0.29 0.45 public 11239 0.39 0.49
intuition 20734 16638.94 11218.96 intuition 11239 18678.49 12156.57 outtuition 20688 19635.91 9409.97 outtuition 11230 22675.20 9106.70
size 25471 4133.76 6393.13 size 11239 6226.41 7451.74
satmean 16107 1065.89 136.76 satmean 11239 1083.16 135.47
pctpell 21822 37.19 20.27 pctpell 11230 30.97 15.43
pctminority 14404 19.94 19.86 pctminority 11239 19.41 18.80
pctintls 12882 3.48 5.15 pctintls 10004 3.27 3.93
pctoutstate 18228 32.36 26.01 pctoutstate 10931 32.75 25.93
retention 14978 76.17 11.57 retention 10451 77.92 10.68
commonapp 26179 0.17 0.37 commonapp 11239 0.31 0.46
appfee 18635 38.84 21.68 appfee 11239 40.24 13.93
feewaiver 18139 0.85 0.36 feewaiver 11193 0.91 0.28
essay 21480 0.43 0.49 essay 11239 0.50 0.50
testsrqd 27259 0.62 0.49 testsrqd 11239 0.92 0.27
interview 21479 0.06 0.24 interview 11239 0.03 0.16
19
The table above presents some selection related issues. Although test scores, application
fees, and acceptance rates are similar across the panels, the analytic sample appears to be biased
towards larger universities, as the mean undergraduate enrollment is almost 50% larger than in the
full sample. Larger universities unsurprisingly receive more applications and are more likely to be
public. It seems plausible that larger universities would devote more resources to data collection
and reporting. There is no particular reason to believe that universities not present in the analytic
sample would experience different impacts from adopting the Common Application to those in the
full sample, but we will be able to determine the direction of any potential selection bias once we
evaluate the impact of adopting the Common Application on smaller universities. Approximately
one quarter of the Common Application members are lost between the full and analytic sample.
The table below provides summary statistics for colleges within the analytic sample for the
academic year 2014-15:
Table 2 – Summary Statistics by Common Application Membership
CA Members in 2014 Non-CA Members in 2014
Variable Mean Std. Dev. Min Max Mean Std. Dev. Min Max t-test
applicants 9276.34 10029.81 363 54190 7557.60 10929.43 46 86548 0.016
admissions 4503.70 4554.19 118 36088 4503.14 5328.71 35 27883 0.999
enrollees 1063.14 1118.22 79 7079 1431.95 1652.15 21 10835 0.000
admitrate 58.35 21.16 5.1 97.4 68.82 17.57 6.2 100 0.000
yield 26.05 11.78 5.8 85.3 35.84 14.56 5.0 100 0.000
public 0.20 0.40 0 1 0.60 0.49 0 1 0.000
intuition 32188.46 14103.22 1030 50550 14881.25 10364.06 910 49102 0.000
outtuition 34967.84 10168.66 8567 50550 21913.55 7274.82 5150 49102 0.000
size 5210.01 5938.02 350 44741 8237.30 9302.59 148 52671 0.000
satmean 1157.04 150.77 845 1550 1020.79 107.55 722.5 1495 0.000
pctpell 27.19 12.85 6 73 41.36 14.43 0 89 0.000
pctminority 18.65 12.68 4.2 92.2 26.29 21.89 1.4 98.1 0.000
pctintls 5.84 6.13 0 39 3.39 3.90 0 28.4 0.000
pctoutstate 45.70 27.76 1 99 23.79 20.67 1 99 0.000
20
commonapp 1.00 0.00 1 1 0.00 0.00 0 0 N/A
appfee 49.70 14.70 15 90 39.69 14.00 15 95 0.000
feewaiver 0.98 0.13 0 1 0.87 0.33 0 1 0.000
essay 0.86 0.35 0 1 0.27 0.45 0 1 0.000
testsrqd 0.81 0.40 0 1 0.94 0.24 0 1 0.000
interview 0.02 0.13 0 1 0.02 0.15 0 1 0.426
earlyaction 0.46 0.50 0 1 0.15 0.36 0 1 0.000
The left columns represent the approximately 370 colleges which are members of the Common
Application, and the right columns represent the approximately 540 which are not. These tables
show that colleges which have adopted the Common Application are more likely to be private,
have higher in- and out-of-state tuition and fees, have higher average SAT scores, receive more
applications, have better retention rates, have less minority students and less students receiving
Pell grants, and have lower admission rates and yields. They have higher application fees, but they
are more likely to offer fee waivers. They are much more likely to require an essay and offer an
early action plan, equally likely to require an interview, and less likely to require test scores. It will
be important to control for many of these variables when attempting to isolate the impact of
adopting the Common Application on various admissions outcomes.
VII. Empirical Model
Each of my analyses will make use of an OLS estimation technique with college and year
fixed effects, as shown below:
𝑌𝑌𝑠𝑠(𝑡𝑡+1) = 𝛼𝛼 + 𝛽𝛽1𝐶𝐶𝐶𝐶𝐶𝐶𝐶𝐶𝐶𝐶𝐶𝐶𝑠𝑠𝑡𝑡+ 𝛽𝛽2𝐸𝐸𝐸𝐸𝐸𝐸𝐸𝐸𝐸𝐸𝑠𝑠𝑡𝑡+ 𝛽𝛽3ln (𝐶𝐶𝐶𝐶𝐶𝐶𝐴𝐴𝐴𝐴𝐴𝐴)𝑠𝑠𝑡𝑡+ 𝛾𝛾𝑋𝑋𝑠𝑠𝑡𝑡+ 𝑆𝑆𝑠𝑠 + 𝑇𝑇𝑡𝑡+ 𝜀𝜀𝑠𝑠𝑡𝑡
Here 𝑌𝑌𝑠𝑠(𝑡𝑡+1) represents one of our admissions outcomes for college s at time t + 1,
𝐶𝐶𝐶𝐶𝐶𝐶𝐶𝐶𝐶𝐶𝐶𝐶𝑠𝑠𝑡𝑡 is a binary variable for whether college s has adopted the Common Application at time
21
𝑋𝑋𝑠𝑠𝑡𝑡 is a vector of time-varying control variables, and 𝛾𝛾 is a vector of their coefficients. S is a vector
of college fixed effects and T is a vector of year fixed effects. Specifically, 𝑋𝑋𝑠𝑠𝑡𝑡 will contain three
types of covariates: a) other characteristics of the application process b) institutional characteristics
and c) state level characteristics. Type (a) will include the availability of fee waivers, standardized
testing requirements, interview requirements, and the availability of an early action plan. Type (b)
will include in- and out-of-state tuition levels, an approximation of average SAT mean, the total
level of undergraduate enrollment, and a series of binary variables for institutional admissions
priorities from the ASC. Type (c) will include the total number of high school graduates in that
state, as a sort of proxy for an aggregate level of demand.
Although we have a rich set of covariates, they may not fully address the potential
endogeneity of a college’s decision to adopt the Common Application. For example, a university
may adopt the Common Application precisely because they think it will aid minority recruitment
efforts. If a university is this committed to increasing minority enrollment then they are probably
engaged in several other minority recruitment strategies, such as outreach programs in local
communities (which will not be observed). Therefore, if an increase in minority enrollment is
observed in the next period, it will be difficult to discern whether it was caused by adopting the
Common Application or by some other factor.
Liu et al. use an instrumental variables approach to augment their analysis, and I will follow
suit. The instrument they use is the share of colleges in a given state which offered the Common
Application in the prior year. I hypothesize that although Common Application membership may
be endogenous (perhaps colleges join when they start receiving lots of applications), there is no
reason why other colleges in a state offering the Common Application would result in changes to
22
university systems, it seems plausible that if other colleges in your state start adopting the Common
Application then you might be tempted to join them, especially if the local applicant pool becomes
accustomed to searching for colleges via the Common Application. An even better instrumental
variable would perhaps be the percentage of “peer” or “competitor” institutions which had adopted
the Common Application as of the prior year. The peer group would be difficult to define but
several papers have attempted it (such as Smith et al. 2015).
A two stage least squares model will be constructed as follows:
𝐶𝐶𝐶𝐶𝐸𝐸ℎ𝐸𝐸𝑎𝑎𝐴𝐴𝑠𝑠(𝑡𝑡−1)= # 𝐶𝐶𝑜𝑜 𝑡𝑡ℎ𝐶𝐶𝐸𝐸𝐴𝐴 𝑐𝑐𝐶𝐶𝑐𝑐𝑐𝑐𝐴𝐴𝑐𝑐𝐴𝐴𝐸𝐸 𝑤𝑤ℎ𝑖𝑖𝑐𝑐ℎ 𝑢𝑢𝐸𝐸𝐴𝐴 𝑡𝑡ℎ𝐴𝐴 𝐶𝐶𝐶𝐶𝐶𝐶𝐶𝐶𝐶𝐶𝐶𝐶 𝐶𝐶𝐶𝐶𝐶𝐶𝑐𝑐𝑖𝑖𝑐𝑐𝐸𝐸𝑡𝑡𝑖𝑖𝐶𝐶𝐶𝐶 𝐸𝐸𝑡𝑡 𝑡𝑡 − 1# 𝐶𝐶𝑜𝑜 𝑐𝑐𝐶𝐶𝑐𝑐𝑐𝑐𝐴𝐴𝑐𝑐𝐴𝐴𝐸𝐸 𝑖𝑖𝐶𝐶 𝑡𝑡ℎ𝐴𝐴 𝐸𝐸𝐸𝐸𝐶𝐶𝐴𝐴 𝐸𝐸𝑡𝑡𝐸𝐸𝑡𝑡𝐴𝐴 𝐸𝐸𝐸𝐸 𝑐𝑐𝐶𝐶𝑐𝑐𝑐𝑐𝐴𝐴𝑐𝑐𝐴𝐴 𝐸𝐸 𝐸𝐸𝑡𝑡 𝑡𝑡𝑖𝑖𝐶𝐶𝐴𝐴 𝑡𝑡 − 1
𝐶𝐶𝐶𝐶𝐶𝐶𝐶𝐶𝐶𝐶𝐶𝐶� 𝑠𝑠𝑡𝑡= 𝛼𝛼0+ 𝛼𝛼1𝐶𝐶𝐶𝐶𝐸𝐸ℎ𝐸𝐸𝑎𝑎𝐴𝐴𝑠𝑠(𝑡𝑡−1)+ 𝛼𝛼𝑋𝑋𝑠𝑠𝑡𝑡+ 𝜀𝜀𝑠𝑠𝑡𝑡
𝑌𝑌𝑠𝑠(𝑡𝑡+1)= 𝛽𝛽0+ 𝛽𝛽1𝐶𝐶𝐶𝐶𝐶𝐶𝐶𝐶𝐶𝐶𝐶𝐶� 𝑠𝑠𝑡𝑡+ 𝛽𝛽𝑋𝑋𝑠𝑠𝑡𝑡+ 𝜀𝜀𝑠𝑠𝑡𝑡
𝐶𝐶𝐶𝐶𝐶𝐶𝐶𝐶𝐶𝐶𝐶𝐶� 𝑠𝑠𝑡𝑡 is the endogenous variable and 𝐶𝐶𝐶𝐶𝐸𝐸ℎ𝐸𝐸𝑎𝑎𝐴𝐴𝑠𝑠(𝑡𝑡−1) is the instrumental variable. I
hypothesize that the instrumental variable will be correlated with the endogenous variable but not
with the error term. Using both of these estimation techniques and comparing results should yield
a more robust set of conclusions than if I were to rely upon only one method. This approach is
based in large part upon Liu et al.’s work (2007).
Another concern is the potential collinearity of certain variables, especially characteristics
of a college’s application process. It is possible that when a college adopts the Common
Application they simultaneously increase their application fee (perhaps to cover the Common
Applications $3.75 fee), or start requiring an essay. This could make it difficult to differentiate
between the impact of the Common Application itself and the impact of other changes which may
be likely to occur simultaneously. This could be addressed by a set of auxiliary regressions using
fixed effects to study the impact of adopting the Common Application on application fees, essay
23 VIII. Results
Headline Results
Table 3 presents five related estimations of the headline result of this paper: the effect of
adopting the Common Application on the number of applications a college receives. All five
specifications include college and year fixed effects. The second adds the following time varying
controls: size, satmean, intuition, outtuition, feewaiver, interview, testsrqd, and earlyaction. The
third adds 16 variables related to self-reported admissions priorities of institutions, such as legacy
or minority status and essays, recommendations or high school GPA. These are coded as
categorical variables with 1 representing highest priority and 4 lowest priority. These variables
contained a substantial amount of missing data, and missing values were imputed by replacing
them with the nearest non-missing value in the future. This is reasonable because priority levels
tended to change little over time within institutions. The fourth adds a state-level control variable
for the size of the state’s high school graduating cohort. The fifth then removes the institutional
priority variables. The key results are robust to all specifications; the negative impact of requiring
an essay softens when admissions priorities are included but the other impacts are unchanged. The
fifth specification is my preferred specification, since it does not rely upon any imputed data, and
it will be used throughout the rest of this paper.
Table 3 – Fixed Effects Progression for log(Number of Applications Received)
Specification (1) (2) (3) (4) (5)
Common App Member 0.045** 0.050*** 0.051*** 0.051*** 0.051*** (0.019) (0.017) (0.017) (0.017) (0.017)
24
Essay Required -0.056*** -0.063*** -0.051** -0.051** -0.063*** (0.021) (0.020) (0.020) (0.020) (0.020)
College & year fixed effects Yes Yes Yes Yes Yes
Time varying controls No Yes Yes Yes Yes
Admissions priorities No No Yes Yes No
State level controls No No No Yes Yes
Institution-years 11005 11005 11005 11005 11005
Institutions 1309 1309 1309 1309 1309
R-squared 0.413 0.475 0.478 0.483 0.481
Note: Values in parentheses are robust standard errors. *Significant at 10%. **Significant at 5%. ***Significant at 1%.
My preferred specification estimates that an institution receives 5.1% more applications
when they adopt the Common Application, 6.3% less applications when they require an application
essay, and 1.85% less applications if they were to increase their application fee by $10. For the
average institution in the 14/15 academic year, a $10 application fee increase would therefore
result in approximately 135 less applications being received next year, ceteris paribus. These
results are broadly consistent with the findings of Liu et al. (2009), who found that the Common
Application increased the number of applications received by 5.7-7.0%. They are less consistent
with Smith et al. 2014 who did not find an effect of CA adoptions on applications using a similar
specification. They did, however, find effects of similar magnitude and direction for the essay
requirement and application fee level. Test score and interview requirements have no effect on the
number of applications received, but fee waivers and early action plans appear to have moderately
positive effects. This suggests that offering a fee waiver may offset any loss in applications that
could accompany an increase in application fees. There is some evidence of endogeneity in this
specification – several factors which you would expect to discourage applications (high SAT
scores and out-of-state tuition) instead have a more positive than negative impact. This suggests
25
In particular, being a member of the Common Application may have become a sign of quality and
prestige in and of itself, in which case an instrumental variables approach may be necessary.
Heterogeneity of Headline Results
Table 4 divides the analytic sample in two, between public and private universities on the
left and between elite and non-elite universities on the right. Elite universities are defined as having
a mean SAT score within the top decile of the analytic sample. The positive impact adopting the
Common Application on applications persists only for the sample of private universities.
Interestingly, higher application fees do not discourage applications to private universities, and yet
requiring an essay reduces applications by 7.5%. This may suggest that private university
applicants are more willing to expend money than time and effort when applying to college. The
lack of impact upon public universities explains, to some extent, the discrepancy between Liu et
al. and Smith et al. because Liu et al.’s sample did not include public universities. Application fees
and essay requirements do not have statistically significant impacts the number of applications
received by public universities, which suggests that a student’s decision to apply to a public
university may be less sensitive to ease of application. We should bear in mind, however, that
students only applying to public universities may apply to less universities in total.
Table 4 – Headline Result by Public/Private and by Elite/Non-Elite
Public Private Non-Elite Elite
Common App Member 0.016 0.056** Common App Member 0.037* 0.150***
(0.022) (0.024) (0.019) (0.039)
ln(Application Fee) -0.061 0.014 ln(Application Fee) -0.076** 0.026
26
Essay Required -0.026 -0.075*** Essay Required -0.061*** -0.042**
(0.026) (0.028) (0.021) (0.018)
College & year fixed effects Yes Yes College & year fixed effects Yes Yes
Time varying controls Yes Yes Time varying controls Yes Yes
Admissions priorities No No Admissions priorities No No
State level controls Yes Yes State level controls Yes Yes
Institution-years 3502 5453 Institution-years 7950 972
Institutions 454 763 Institutions 1130 126
R-squared 0.492 0.473 R-squared 0.451 0.664
Note: Values in parentheses are robust standard errors. *Significant at 10%. **Significant at 5%. ***Significant at 1%.
The difference between effects of application characteristics at elite vs non-elite
universities is remarkable. Universities with SAT scores in the top decile receive 15% more
applications when they adopt the Common Application. In contrast, non-elite universities receive
a weakly significant 3.7% boost on average. Application fees have no effect on the number of
applications received by elite universities, whereas a 10% increase at a non-elite university would
result in a fall in applications of approximately 0.76%. Requiring an essay discourages applications
to both groups, but the effect is stronger at non-elite universities. Adopting the Common
Application does not appear to have heterogeneous impacts across the rest of the SAT score
distribution, and there is no evidence of heterogeneity across the size distribution. This means that
much of the positive average impact of Common Application membership is driven solely by its
effect on a group of approximately 100 elite universities. This suggests that the 30-40 elite
universities that are yet to adopt the Common Application should strongly consider doing so,
27
Auxiliary Results
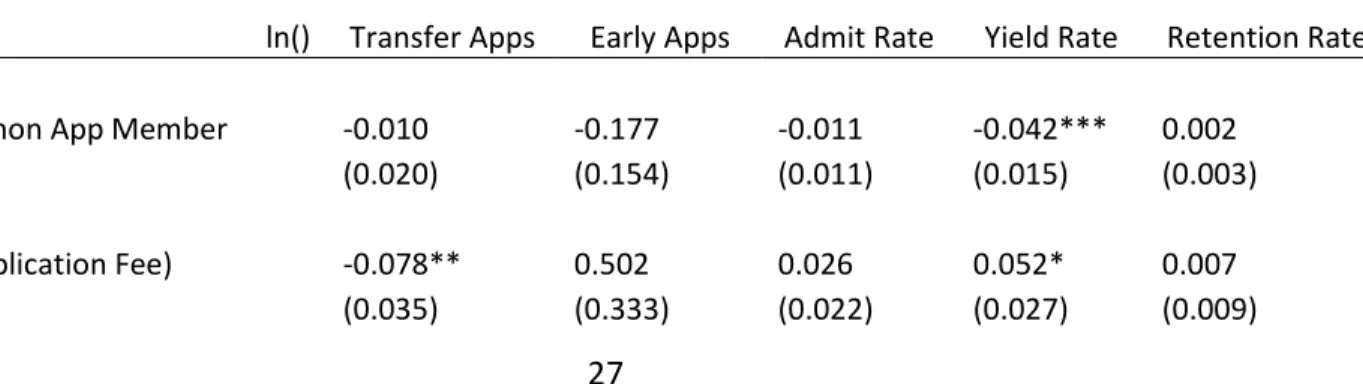
The same specification can be applied to a range of other dependent variables, although
statistically significant impacts on these downstream outcomes are few and far between.
Application fees and essay requirements discourage transfer applications, but have no effect on
early applications, and there is no evidence of Common Application membership affecting either,
although the sample size for early applications is very small (it has only been collected since 2012).
There is no evidence of acceptance rates being impacted, which is interesting in and of itself since
one might have thought that colleges would adopt the Common Application in the hope of driving
down their acceptance rate (which can be a sign of prestige). This does not seem to be the case.
Instead, colleges receive more applications, accept more applicants, and accept the fact that their
yield rate will fall. Indeed, the effects of application characteristics on yield of are almost precise
opposites of their effects on applications, which makes sense given that acceptance rates are
unchanged. This implies that students are more likely to attend a college if they have paid a high
application fee or written an application essay for that college, but perhaps less likely to attend if
the effort required to apply was reduced as a result of that college being a member of the Common
Application. There is little evidence of frivolous applications being made, however, and the fact
that retention rates are unaffected suggests that the quality of match between student and college
has not worsened.
Table 5 – Additional Admissions and Enrollment-Related Outcomes
ln() Transfer Apps Early Apps Admit Rate Yield Rate Retention Rate
Common App Member -0.010 -0.177 -0.011 -0.042*** 0.002
(0.020) (0.154) (0.011) (0.015) (0.003)
ln(Application Fee) -0.078** 0.502 0.026 0.052* 0.007
28
Essay Required -0.057* 0.127 0.010 0.038** 0.004
(0.022) (0.063) (0.012) (0.017) (0.004)
College & year fixed effects Yes Yes Yes Yes Yes
Time varying controls Yes Yes Yes Yes Yes
Admissions priorities No No No No No
State level controls Yes Yes Yes Yes Yes
Institution-years 8434 613 8955 8954 7019
Institutions 1186 265 1217 1217 1100
R-squared 0.190 0.035 0.075 0.294 0.044
ln() Pct Pell Pct Minority Pct Intl
Common App Member -0.023 0.019 0.005
(0.014) (0.023) (0.051)
ln(Application Fee) 0.000 -0.092** 0.072
(0.028) (0.041) (0.114)
Essay Required -0.005 -0.021 0.094
(0.016) (0.026) (0.058)
College & year fixed effects Yes Yes Yes
Time varying controls Yes Yes Yes
Admissions priorities No No No
State level controls Yes Yes Yes
Institution-years 8943 8955 8095
Institutions 1216 1217 1171
R-squared 0.460 0.295 0.144
Note: Values in parentheses are robust standard errors. *Significant at 10%. **Significant at 5%. ***Significant at 1%.
The only sign of statistical significance in relation to demographic enrollment
characteristics is the negative impact of application fees on minority first-year enrollment. This is
not entirely inconsistent with the literature, but prior papers had generated results which were at
least suggestive of positive impacts on diversity measures. If anything, adopting the Common
29
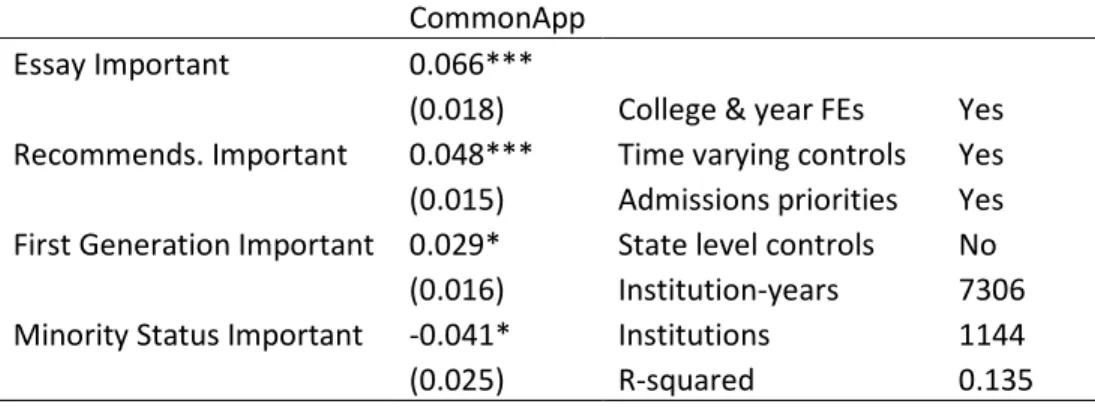
colleges’ motivations for adopting the Common Application, and indeed the single negative effect
loses significance when institutional priorities are take into account. Table 6a uses a fixed effects
model to show that colleges are more likely to adopt the Common Application when they care
about essays, they care about recommendations, and they care about first generation status.
However, minority status is the only priority which appears to make adopting the Common
Application less likely. If colleges are not adopting the Common Application specifically to
increase diversity enrollment then even if the Common Application generates more diverse
applicant pools, colleges will not necessarily extend offers to a more diverse group of students,
and even if they did the students may not choose to enroll. There are several missing links in the
process between application and enrollment, and ideally applicant level data would be available.
Table 6a – Why Do Colleges Adopt the Common Application?
CommonApp
Essay Important 0.066***
(0.018) College & year FEs Yes Recommends. Important 0.048*** Time varying controls Yes (0.015) Admissions priorities Yes First Generation Important 0.029* State level controls No
(0.016) Institution-years 7306 Minority Status Important -0.041* Institutions 1144
(0.025) R-squared 0.135
Note: Values in parentheses are robust standard errors. *Significant at 10%. **Significant at 5%. ***Significant at 1%.
Table 6b – What Else Changes When Colleges Adopt the Common Application?
ln(appfee) Essay Interview Tests Common App Member 0.025** 0.173*** 0.011* 0.008
(0.010) (0.028) (0.007) (0.015)
College & year FEs Yes Yes Yes Yes
30
Admissions priorities No No No No
State level controls No No No No
Institution-years 11239 11239 11239 11239
Institutions 1319 1319 1319 1319
R-squared 0.223 0.051 0.004 0.040
Note: Values in parentheses are robust standard errors. *Significant at 10%. **Significant at 5%. ***Significant at 1%.
An interesting result from Table 6b is the 2.5% increase in application fees when a college
adopts the Common Application. The average application fee in my sample is about $40 so a 2.5%
increase is approximately $1. Since the Common Application charges universities $3.75 per
application (if they are exclusive partners) this means that universities pass along only about 25%
of the cost of adoption to students. Of course, if admissions departments receive more applications
as a result of adopting the CA then their total application fee revenue may still increase. Common
Application members are much more likely to require an essay, and they are slightly more likely
to require an interview. Common Application members are able to require the standard Common
Application essay, or supplementary essays, or both. My binary variable for essay equals one if a
single essay is required. However, 90% of Common Application members require the standard
essay, presumably because they expect applicants to apply to more than one college and so
requiring the standard essay is unlikely to serve as an additional barrier. The close relationship
between these two variables means that colleges can expect an increase in applications from
adopting the Common Application if and only if their essay requirement policy does not change
when they adopt the Common Application. If they did not require an essay pre-adoption but then
they require the standard Common Application essay post-adoption, then you would not expect to
see a statistically significant change in applications because the positive effect of Common
31
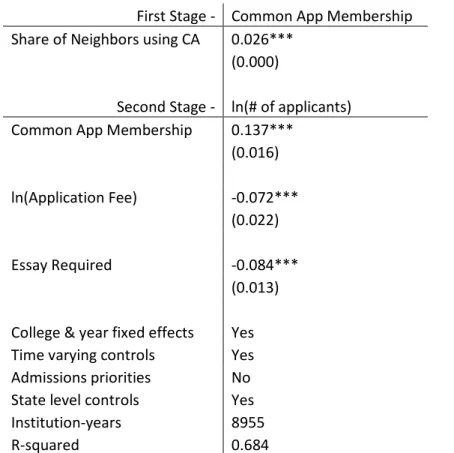
Instrumental Variable Approach
Table 7 describes the results of an instrumental variable approach to estimating the headline
result of this paper – effect of Common Application on applications. The instrumental variable is
the share of colleges in a given state which had adopted the Common Application as of last period.
This approach is discussed in more detail in the empirical model section of this paper (section VII).
Table 7 – Instrumental Variable Approach
First Stage - Common App Membership Share of Neighbors using CA 0.026***
(0.000)
Second Stage - ln(# of applicants) Common App Membership 0.137***
(0.016)
ln(Application Fee) -0.072*** (0.022)
Essay Required -0.084***
(0.013)
College & year fixed effects Yes Time varying controls Yes Admissions priorities No State level controls Yes
Institution-years 8955
R-squared 0.684
Note: Values in parentheses are robust standard errors. *Significant at 10%. **Significant at 5%. ***Significant at 1%.
These results have the same direction as those generated by my preferred fixed effects
specification, but they are of substantially larger magnitude. Membership of the Common
Application now generates a 13.7% increase in the number of application received, compared to
32
remain in place. This suggests than any endogeneity present in Common Application membership
biases estimates towards zero, which gives us more confidence in the headline results. A plausible
explanation is that colleges tend to adopt the Common Application precisely when they are
struggling to attract applications for some unobserved reason.
IX. Conclusion
In general, adopting the Common Application has a positive impact on the number of
applications a university receives. However, this impact is heterogeneous and is strongly
concentrated within universities in the top decile of the SAT score range. Application fees and
essay requirements generally discourage applications, although application fee waivers mitigate
the former to some extent. Admissions outcomes tend to be much less sensitive to application
characteristics at public universities compared to private universities. This explains to an extent
the disagreement in the literature as to the effect of the Common Application. It seems that the
effect had previously been overestimated as a result of leaving out public universities, which
admittedly only started joining the Common Application in 2001. While elite private and public
universities alike may benefit from adoption, others may want to consider other options.
The evidence as to why universities are adopting the Common Application is unclear. It
does not appear to be a cynical attempt to drive down acceptance rates, yet at the same time there
does not seem to be a strong focus on diversity recruitment. Universities have been able to accept
more students, thereby keeping their acceptance rates unchanged, but due to a fall in yield rates
their enrollment levels have not been impacted. Diversity enrollment levels have also not been
33
attract more diverse applicant pools or because universities do not choose to diversify their
enrollment even when presented with a more diverse applicant pool.
Though my analysis is limited to the institutional level, my aggregate impacts are
consistent with the individual impacts predicted by my theoretical model. My model predicted that
students would, perhaps irrationally, respond to small changes in the amount of time and money
required to apply to a certain college. My analysis shows that universities receive more
applications if they adopt the Common Application (reduces time), but less applications if they
increase their application fee (increases money) or require an essay (increases time). The number
of applications received was more sensitive to essay requirements and Common Application
membership at private universities than at publics, but less sensitive to application fee levels. This
suggests that applicants to private universities are more constrained by time than money when
applying to colleges, and vice versa for applicants to public universities.
Further research could make use of individual level data to better understand how Common
Application membership affects the college application decisions of high school students and how
universities may be able to adapt their application and selection processes to encourage more
diverse enrollment. In addition, I hope that early evaluations of the impact of participating in the
34
X. Bibliography
Avery, C., & Kane, T. (2004). Student perceptions of college opportunities: The Boston COACH
program. In C. Hoxby (Ed.), College choices: The economics of where to go, when to go,
and how to pay for it (pp. 355–391). Chicago: University of Chicago Press.
Avery, Christopher, Jessica S. Howell, and Lindsay Page. "A Review of the Role of College
Applications on Students' Postsecondary Outcomes. Research Brief." College
Board (2014).
Bowen, W. G., Chingos, M. M., and McPherson, M. S. (2009). Crossing the Finish Line:
Completing College at America’s Public Universities. Princeton, N.J.: Princeton
University Press.
Ehrenberg, Ronald G., and Albert Yung-Hsu Liu. "The common application: When competitors
collaborate." Change: The Magazine of Higher Learning41, no. 1 (2009): 48-54.
Hoxby, Caroline M., and Christopher Avery. The Missing" One-Offs": The Hidden Supply of
High-Achieving, Low Income Students. No. w18586. National Bureau of Economic
Research, (2012).
Hoxby, Caroline, and Sarah Turner. "Expanding college opportunities for high-achieving, low
income students." Stanford Institute for Economic Policy Research Discussion Paper
12-014 (2013).
Hoxby, Caroline M., and Sarah Turner. "What high-achieving low-income students know about
college." The American Economic Review 105, no. 5 (2015): 514-517.
Hurwitz, Michael, et al. "Surprising Ripple Effects How Changing the SAT Score-Sending Policy
for Low-Income Students Impacts College Access and Success." Educational Evaluation
35
Jaschik, Scott. “Admissions Revolution.” Inside Higher Ed. 29 Sept. 2015. Accessed 20 March,
2017.
<https://www.insidehighered.com/news/2015/09/29/80-colleges-and-universities-announce-plan-new-application-and-new-approach>.
Klasik, Daniel. "The college application gauntlet: A systematic analysis of the steps to four-year
college enrollment." Research in Higher Education 53, no. 5 (2012): 506-549.
Klasik, Daniel. "Common Choices: The Effect of the Common Application on Students' College
Enrollment and Success." In Annual Meeting of the Association for Education Finance and
Policy, Boston, MA. (2012).
Liu, Albert Yung-Hsu, Ronald G. Ehrenberg, and Jesenka Mrdjenovic. "Diffusion of Common
Application membership and admissions outcomes at American colleges and universities."
NBER Working Paper #13175. (2007).
Pallais, Amanda. "Small Differences That Matter: Mistakes in Applying to College." Journal of
Labor Economics 33, no. 2 (2015): 493-520.
Smith, Jonathan. "The effect of college applications on enrollment." The BE Journal of Economic
Analysis & Policy 14, no. 1 (2013): 151-188.
Smith, Jonathan, Matea Pender, and Jessica Howell. "The full extent of student-college academic
undermatch." Economics of Education Review 32 (2013): 247-261.
Smith, Jonathan, Michael Hurwitz, and Jessica Howell. "Screening mechanisms and student
responses in the college market." Economics of Education Review 44 (2015): 17-28.
Witte, John F., Barbara L. Wolfe, and Sara E. Dahill-Brown. Income and Access to Higher
Education: Are High Quality Universities Becoming More or Less Elite? A Longitudinal