CUSTOMER
SAP Cloud for Analytics
SAP Cloud for Analytics User Guide
Content
1 Welcome to SAP Cloud for Analytics!. . . . 7
1.1 User Assistance. . . 8
1.2 Additional Help Resources. . . .9
2 Home. . . .10
2.1 Creating a Note. . . .10
2.2 Working with Tiles and Notes. . . .11
Changing Tile Settings. . . .11
3 Modeler. . . .12
3.1 Explore Models. . . 13
Analyzing Account Data. . . .13
Planning Models and Analytics Models. . . .14
Business Organization. . . .15
Currency Tables. . . .17
Explore Hierarchies. . . .18
Design Options: Model Preferences. . . 18
Explore Dimensions. . . 20
Explore Formulas. . . .25
3.2 Creating Models. . . 34
Creating Models Using the Planning Wizard. . . 35
Data Access. . . .36
3.3 Creating Dimensions. . . .37
Editing Dimensions. . . .38
Editing Dimension Attributes. . . .38
3.4 Clearing Model Data. . . 39
3.5 Deleting a Model. . . .39
3.6 Data Import. . . 40
Connecting to Google Drive. . . .41
About Importing a Model from a File. . . .42
About Importing Data from Files. . . 47
About Importing Data from Other Systems. . . .50
Creating a Model from HANA. . . .56
Creating a Model from a Remote System. . . 58
3.7 Data Export. . . .58
3.8 Creating Points of Interest. . . .60
Creating Point of Interest Data from a Model. . . .61
4 Reports. . . .62
4.1 Reports Management. . . 62
Editing or Deleting Reports. . . .63
Searching for Reports. . . .63
4.2 The Designer Panel. . . 63
Formatting in the Designer Panel. . . .64
Choosing a Layout. . . 64
4.3 Getting Started with Reports. . . 65
Creating a Simple Report View. . . .66
4.4 Point of View. . . .67
4.5 Report Sheets. . . .68
Adding Attributes to a Report Sheet. . . .68
4.6 About Filters in Report Sheets. . . 69
Filtering Dimension Members in a Report Sheet. . . 69
Setting a Top N Filter. . . 70
4.7 Report Preferences Menu. . . .71
Summaries. . . .71
Views . . . .72
About View Preferences. . . 73
4.8 About Ask for Input. . . 75
Converting a View to a Summary. . . .76
The Create Input Task Feature. . . .77
Creating an Input Task. . . 78
Accepting an Input Task. . . .79
Completing an Input Task (Assignee). . . .80
Completing an Input Task (Approver). . . .80
4.9 Explore Version Management. . . .81
Creating Versions. . . .82
Publishing Versions. . . 82
Sharing Versions. . . 83
4.10 The Grid Formula Bar. . . .83
Advanced Formulas. . . 84
Report Formulas. . . 84
4.11 Explore Linking Models. . . 90
Linking Models. . . .90
4.12 Collaboration for Reports. . . .91
4.13 Visualize. . . .91
Explore Visualizations. . . .92
Visualizations and Stories. . . .95
4.14 Details Panel. . . .97
4.15 Explore KPIs . . . .97
Defining the KPI Threshold Workflow. . . .98
The KPI Visualizer. . . .98
Changing the KPI Scope. . . 99
Editing Options for KPIs. . . .100
KPI Preview. . . 100
5 Allocations. . . .101
5.1 Allocation Models. . . .102
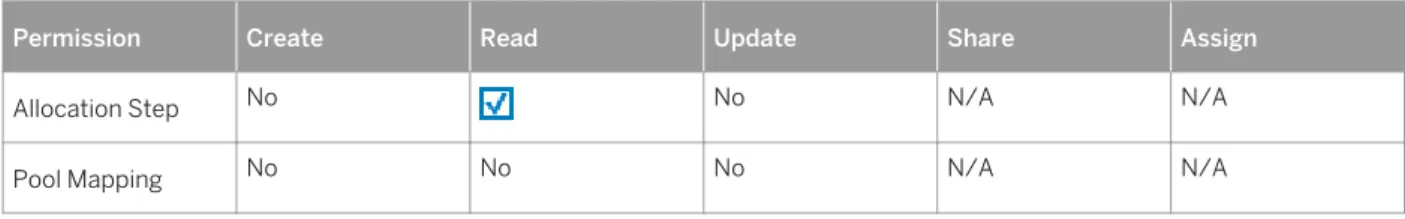
5.2 Allocations Role and Permissions. . . 102
5.3 Spreading and Distribution. . . .103
Spreading a Value. . . .106
Example: Spreading a Value. . . .107
Distributing a Value. . . .109
Example: Distributing a Value to Unbooked Cells. . . 110
5.4 Structured Allocations. . . .111
Creating Pools for Structured Allocation. . . 112
Allocation Processes, Steps, and Rules. . . 114
Executing an Allocation Process. . . .118
6 Stories. . . .119
6.1 Story Management. . . .119
Listing Stories. . . .119
Select a Story to Manage. . . .120
Create a New Story. . . .120
Edit a Story. . . .121
Copy a Story. . . .121
Share a Story. . . 122
6.2 Working with a Story. . . 122
Story Preferences. . . .123
Explore Your Data. . . .123
Add Tiles to a Canvas. . . 125
Linked Dimensions. . . 126
Story and Page Filters. . . .128
Designer Panel. . . 131
Create a Chart. . . 135
Dynamic Table (Beta). . . .146
Analyzing Geographical Data. . . .146
Collaboration for Stories. . . .149
Exporting to PDF. . . .149
7.1 Uploading and Publishing Files. . . 150
Sharing a File. . . .151
Assigning Permissions. . . .151
7.2 Managing Files. . . .152
8 Collaboration. . . .154
8.1 Explore the Collaboration Process. . . .156
8.2 What's in a Discussion. . . 157
9 Events. . . .159
9.1 Creating Events. . . .160
9.2 Creating Tasks. . . 160
9.3 Monitoring Plans. . . 161
9.4 Explore Reminders. . . .162
9.5 Collaboration for Events and Tasks. . . 162
9.6 Exporting and Importing Calendar Events. . . .163
Exporting Events. . . .163
Importing Events. . . .164
10 Users. . . .165
10.1 About Authorizations. . . .165
Dependencies between Roles, Users, and Authorizations. . . .166
User Administration Tools. . . .166
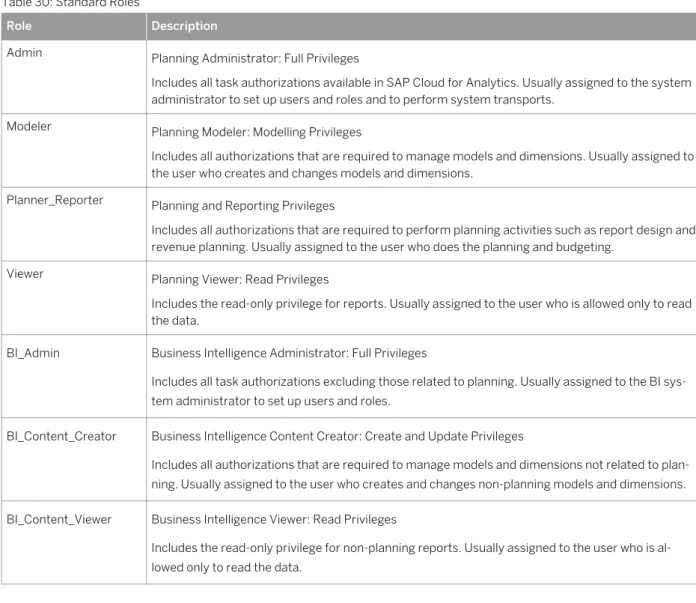
Standard Application Roles. . . 167
Authorization Levels. . . .168
Authorizations on Activity Level. . . .168
Authorizations on Data. . . 169
Authorizations on Resources . . . .171
10.2 Creating Business Users. . . .171
Importing Users. . . 173
Exporting Users. . . 173
10.3 Creating Roles. . . .174
10.4 Requesting Roles. . . .175
10.5 About the User Profile. . . .177
10.6 Creating a New Password. . . .178
10.7 Explore Auditing. . . .178
Data Audit. . . 179
Activity Auditing. . . .180
11 Deployment. . . .182
11.1 Explore Export. . . .182
Creating an Export. . . 183
Units Management. . . .184
11.2 Explore Import. . . .184
Creating an Import. . . 184
Import Unit Details. . . 185
12 Connections. . . . 186
12.1 Creating a BPC Connection. . . .186
12.2 Creating an SFDC Connection. . . .187
12.3 Scheduling an Import. . . .188
12.4 Remote System Connectivity. . . 188
Remote Connectivity via External Reverse Proxy. . . .189
13 System Usage Dashboard. . . . 192
14 What Is This Icon?. . . .193
15 FAQ. . . .194
1
Welcome to SAP Cloud for Analytics!
SAP Cloud for Analytics is a completely new analytics experience that provides all capabilities for all users in one product.
Benefits
With SAP Cloud for Analytics you can:
● Simplify your job with the ability to discover, visualize, plan, and predict all your business data all in one product.
● Experience seamless workflows to find insights and take actions at the point of decision in your application.
● Collaborate directly on your data and visualizations with colleagues to respond to new business challenges and opportunities without delay.
● Trust it will work how and when you expect because it’s built natively on the SAP HANA Cloud Platform.
User Interface and Assistance
SAP Cloud for Analytics is designed for ease-of-use with an interface that is intuitive and easy to work with. Familiar recognizable icons are used and on-screen text and messages provide helpful information to guide you through the application.
Detailed user assistance is available directly in the application. Page Tips provide explanatory descriptions to help you familiarize yourself with the application and discover features. Help provides more detailed information topics and step-by-step instructions on how to accomplish your tasks. For more information, see User Assistance [page 8].
Preview
To give a quick preview of this integrated and dynamic working environment, the following figure shows a typical scenario working on a profit and loss report. The visualizations, the collaboration features, and the data sheet are all embedded in a single screen.
1.1
User Assistance
User assistance is an integral part of the SAP Cloud for Analytics application. Two forms of context-sensitive assistance are available by choosing (Help) from the main toolbar: Page Tips and Help.
Page Tips
When you use the application for the first time, you may find it helpful to turn on Page Tips. When Page Tips are active, popup balloons with short explanations are displayed when you point at certain features in the application.
Example
Turn on Page Tips by choosing Page Tips from the main toolbar. Now hover over items on the Main
menu. As you move down the list of menu items, a short explanation is displayed. Turn off this feature by selecting Page Tips again.
Help
More detailed help information is available by opening the Help window. In the Help window, you can find specific help topics by:
● Searching for terms using the search field.
● Using the Help breadcrumb trail at the top of the Help window to browse all topics.
● Activating the context-sensitive help mode choosing (Smart Help). When this mode is active, the Help
window updates automatically and displays the topic for the feature you point at with your mouse.
Example
Open the Help window by choosing Help from the main toolbar and then choose (Smart Help) –
this icon changes color to blue to show that it is active. Now hover over items on the Main menu. As you move down the list of menu items, the content of the Help window changes. Turn off context-sensitive mode by selecting (Smart Help) again.
1.2
Additional Help Resources
In addition to this User Guide, further support information is available.
Table 1:
Resource Description
Release Notes Information on new features and other changes introduced in past updates.
Instructional Videos Training videos to help you get started with SAP Cloud for An alytics.
2
Home
Your Home screen is the place where you can pin reports, stories, and visualizations, as tiles. You can also add personal notes and upcoming events there.
When you first start SAP Cloud for Analytics, the Home screen displays quick-launch shortcuts that can help you get started working on your analytics tasks right away. For example, you can:
● Drag an Excel file onto the Home screen to import the data.
● Launch the Financial Planning Wizard to create plans on the fly.
● Start the Explorer, where you can begin analyzing data and creating visualizations.
When you drag an Excel file onto the Home screen, you can choose between I'm Feeling Lucky, and Prepare Dataset. Choosing I'm Feeling Lucky creates a new story and displays your data in the Explorer. Here, you see your data and create visualizations through faceted interaction. Choosing Prepare Dataset creates a new story and displays your data in a grid. Here, you can perform data integration and preparation.
Your Home screen is private and you cannot share it with other users or add it to discussions. This also applies to the notes and tiles you pin there.
For more information on tasks you can perform on the Home screen, see the table below.
Table 2:
Task More Information
Explore your data Explore Your Data [page 123]
Create a note Creating a Note [page 10]
Edit or delete notes and tiles Working with Tiles and Notes [page 11]
Apply a Point of View Use Point of View [page 67] to view and alter the filters ap plied to tiles.
2.1
Creating a Note
You can create a text-based visual object, known as a note, to add to your Home screen.. 1. Select the wrench icon, and then choose the New Note option.
2. Enter a title for the note and the text for the note. 3. Save your settings.
2.2 Working with Tiles and Notes
You use the Tile Settings options to manage tiles and notes. You can use the tile settings to do the following:
Table 3:
Task More Information
Edit a tile Changing Tile Settings [page 11]
Delete a tile Choose the Delete option to remove a tile from the Home screen.
View the tile in Full Screen mode Choose the Full Screen icon to enter presentation mode. In this mode, choose the Gallery Mode icon in the bottom right corner to move between full screen versions of all the tiles and notes on your Home screen. Choose the Exit Full Screen icon to return.
If a tile contains a chart, it will also include a filter option, which allows you to apply filters to the underlying data. Choose the icon to access the Set Filters dialog, in which you can adapt the applied filters. The chart in the tile will adapt depending on the filter changes, for example paging through different versions or accounts may become available.
You can also view and set filters using the Point of View option on the Home settings menu.
Related Information
Adding Reference Lines [page 93] Point of View [page 67]2.2.1 Changing Tile Settings
Use the Tile Settings options (accessed from the wrench icon) to make changes to the contents of a tile and change visualizations.
You can alter the title and the subtitle of a tile. If the tile is a note, you can also edit the note text. If the tile is based on a report or visualization, you can open the report by selecting the Go to option.
If the tile contains a visualization of the appropriate type, you can add a reference line to the visualization using the Add Reference Line option. For more information, see Adding Reference Lines [page 93].
3
Modeler
A model is a representation of the business data of an organization or business segment. Models are required in SAP Cloud for Analytics as the basis for reports. Use Modeler to create, maintain, and to load data to models. A model is based on a single account but also includes one or more dimensions that are then used in reports to analyze the account data – these might include, for example, a breakdown of the data by time, products, regions, or other categories. You should plan the requirements for a model and the reports that are generated from it carefully in advance. When the model design is complete and you save the model for the first time an initial report is automatically generated. Some of the basic features of the model are permanently fixed at this time and cannot be modified later.
Data is maintained in a hierarchical structure so that in reports, high-level views of the data can be examined in more detail using drill-down features. Data is not visible in the model but the data is imported and refreshed using the Data Integration features of modeling. Several options are available to support this, ranging from manual data entry to scheduled updates from external systems such as SAP Business Planning and Consolidation (BPC). The data integration features can also be used to import a complete model from other systems, and an additional option for creating a model on-the-fly is to use the Planning Wizard which is available on the Home screen when the product is first launched and also as part of the Dynamic Tables feature within Stories.
This Modeler section starts by describing the key features of models and then goes on to give details of the tasks involved in model design and data integration.
The following illustration of the Modeler list screen gives an overview of some of the main functional areas numbered 1–7.
1. Models – Existing models are listed here. You can open a model by clicking the link text or by selecting one or more models using the checkboxes.
2. Dimensions – The individual dimensions that are used in models are saved independently and listed on a separate tab page.
3. Currency Conversion – For reports where multiple currencies are used, exchange rates are maintained in tables. These are saved independently of any model and are listed on a separate tab page.
4. Points of Interest – Data for locations which are displayed and used in your data analysis is maintained here in Modeler.
5. Toolbar – Common operations for managing reports are available from the toolbar, this includes options to Delete a model and to Clear (remove all data) from a model.
6. Import / export data – The list of data import options that are supported is available from a menu beneath the Data import icon on the toolbar.
7. Data Resources – You can set up permanent scheduled links to the model from external data sources so that data can be refreshed on a scheduled basis.
These features and other modeler functionality are described in detail in the subsections that follow. In Modeler, you can perform the following tasks:
Table 4:
Task More Information
Create new models See Creating Models [page 34].
Add dimensions When designing your model, add dimensions either by selecting an existing dimension or creat ing a new one. See Creating Dimensions [page 37].
Maintain currency conver sion tables
To handle multiple currencies, you must set up currency conversion tables to define the ex change rates for any currencies used in the reports. See Business Organization [page 15]. Set the model preferences Configure the security, data auditing, and currency conversion settings for a model. See Design
Options: Model Preferences [page 18]. Populate models with ac
tual data
You can load data to models by copying and pasting from spreadsheets or importing data from files or other systems. See Data Import [page 40].
Delete and clear data from models
See Clearing Model Data [page 39] and Deleting a Model [page 39].
3.1
Explore Models
Key features of Models include the account and the dimensions which are used in reporting to analyze the account data, hierarchies, currencies, and formulas.
In the following set of topics we give an introduction to the main features of models and show the effect of these features on the reports, charts, documents, and stories which are generated from the model.
3.1.1 Analyzing Account Data
A model is based on a single account that may contain financial or any other business data. With the reports that are created from the model, you can analyze the account data on the basis of the dimensions defined in the model.
Example Profit and Loss Report
The following example shows a model that is used to generate a Profit and Loss report; it has dimensions for time periods, geographical region, and product.
In the initial report that is generated from the model, the account members are listed in the first column of the report. The dimensions defined in the model are available in the Designer panel on the left, and you can drag these in and out of the report grid to show different views of the data – all within the same report.
Data in the model is organized by hierarchical parent-child relationships so that, in reports, users can see high-level accumulations and optionally drill down to more detailed high-levels of data. In the example Profit and Loss report, the members of the account are shown rolled up, but they can be expanded by clicking the arrow on each line. You can display the complete hierarchy for any dimension in Modeler by using the Preview feature, which shows the position of all members or lines in the dimension.
3.1.2 Planning Models and Analytics Models
SAP Cloud for Analytics offers two types of model: fully featured planning models or simpler more flexible analytics models.
In order to support and streamline the planning process, models in SAP Cloud for Analytics are prepared with many off-the-shelf features to give you a quick start in the planning process. A planning model, for example, is preconfigured with:
● Categories for budgets, plans, and forecasts
● Default time periods that you can quickly adjust to suit your data
● Auditing features for traceability
● Security features that make it possible for you to restrict access to specific values in the report to named individuals
A simpler type of general-purpose model is also available that offers fewer preconfigured features but more flexibility; this is the Analytics model.
The model type is determined in the first step of creating a model, using the Enable Planning checkbox.
Some essential differences between the planning model (1) and the analytics model (2) are shown in the following illustration. Analytics models are not preconfigured with categories (for budget and forecast data) and, although by default a Time dimension is available, it is not required and you can remove this from the model during the design stage.
Related Information
Explore Version Management [page 81] About Ask for Input [page 75]
About Importing Data from BPC [page 53] About Importing a Model from a File [page 42] Creating Models [page 34]
Explore Dimensions [page 20]
3.1.3 Business Organization
The organizational structure that applies to the account can be defined as a special (organizational) dimension in the model. For more complex and international business models currency conversion features are also available in this dimension as well as a geolocation ID.
Organization Dimension
Each planning model may include a single organizational dimension that describes the structure of the business and offers extra features for currencies and determining geographic locations. You can use this, for example, to
give a regional breakdown of sales activity for each product. Only one organizational dimension is allowed in each model but additional hierarchies can be added to any model dimension, if needed, as shown in the following example:
Currencies
If members of the organization dimension use different currencies, enter the currency code for each member in the currency column. In this case, you must also specify the conversion table to use in the preference settings for the model.
Currency conversion tables are defined independently of models; they are listed on a separate Modeler tab page when you first select Modeler from the main menu.
In reports, you can select a reporting currency. Monetary values are then converted and displayed according to the currently effective rate for the currency you selected.
Geolocation (Area ID)
In the organizational hierarchy any place names in the data are automatically matched to known place names in the database and the value is entered in the AreaID column. If a location name is not recognized automatically you can do manual searching and matching of the imported data using the Search feature which is available on all cells in this column (magnifying glass icon). Using this feature you can identify, for example, countries, states or sales regions, locations are maintained in Modeler in the Points of Interest modeler tab page.
Input Form (Ask for Input)
The organization dimension can also be used as the basis for Input Forms in Reporting. The responsible persons for each region or department can be assigned to the Ask for Input task which is integrated into the Collaboration functionality with notifications and other social media features.
3.1.4 Currency Tables
Currency conversion tables are defined independently of models, you can then apply a selected table to any model you create. When you launch Modeler, currency tables are listed on a separate Currency Conversion tab page; standard maintenance features are available to add, copy, and delete tables as required.
Exchange Rates
A currency conversion table defines exchange rates for all currencies which are in use. The currency conversion is calculated as a source currency multiplied by an exchange rate to determine the equivalent value in a target currency. In Modeler the currency code is entered with the regions and countries defined on the model's organization perspective.
Each rate has a Valid From value which is the start date from which the rate becomes effective, but additionally exchange rates can be defined for a single Category (actuals, budgets, planning etc.) and for a selected currency
Rate Type (either 'Closing' or 'Average'). This makes it possible to maintain several variations of a currency exchange calculation which can be used, for example, to track differences between budgets, plans, and actuals and to compare different types of exchange rate calculations.
Rate Types and Categories
The category and rate type are optional attributes of a currency and are blank by default. If the attributes are not set then the exchange rate value is generic, but you can add additional lines and rates to the table with categories and rate types applied for each exchange rate you wish to use.
To use the rate types for an account you must turn this feature on in dimension preferences for the account member. An additional Rate Type column is then added to the account dimension.
If you are using an older model which was created before Rate Types were introduced in Modeler, you must first migrate the model before you add the Rate Type column to the account dimension. In this case an additional
Migrate option is available on the Model Preferences menu. Select this option to start the automatic migration procedure.
Enabling Currency Conversion
In Modeler, you must decide during the design phase if currency conversion is required; you cannot apply this feature later once you have saved the model and created the initial report. If the reports based on the model require currency conversion, you must specify the conversion table to use in the preference settings for the model.
In Reports, you can select a reporting currency. Monetary values are then converted and displayed according to the currently effective rate for the currency you selected.
Related Information
Design Options: Model Preferences [page 18] Attributes of an Account Dimension [page 21]
3.1.5 Explore Hierarchies
The Hierarchy column is a standard feature of all dimension types so that you can structure your data. In Reports the nodes of the hierarchy can be expanded or collapsed.
The hierarchy is defined as an interconnected set of parent-child relationships for each line in the dimension. The Hierarchy column is used to store the parent ID value.
The Account dimension has only a single hierarchy but you can add additional hierarchies to all other dimension types by selecting Add Hierarchy from the Add menu (+ symbol) on the toolbar. When you choose this option, a new column is inserted in the grid, and you must enter the name of the new hierarchy in the column header row. If more than one hierarchy is defined users in Reports can use the Manage Hierarchies feature or apply filter settings to select which hierarchy to apply and to switch between hierarchies.
The Hierarchy is visualized in the Preview panel. You don't need to enter or edit the data in the data grid to make a hierarchy, you can use drag and drop in the Preview panel to arrange the members and build the relationships visually. If more than one hierarchy has been defined you can select which one to show in the Preview from the drop-down list.
3.1.6 Design Options: Model Preferences
For every model, you can configure individual preferences. The settings you apply when the model is created determine many permanent characteristics of the model and the reports generated from it.
When designing a new planning-type model, you must set the preferences that affect security, auditing, and currency conversion; not all of these preferences are relevant for analytics-type models. Settings for the model as a whole are available from the drop-down Preferences menu (wrench icon) on the blue toolbar. An additional set of preferences at the level of each dimension is also available from the functional toolbar when the dimension is displayed.
Currency
The basic settings for the model include the default currency that applies to the reports generated from the model. If you need to show monetary values in different currencies in your reports, activate the Currency Conversion switch and then select a currency conversion table. The drop-down list shows all tables that have already been created on the modeler Currency Conversion tab.
Data Auditing
Auditing within SAP Cloud for Analytics is available at either of two levels: high-level auditing or transactional-level Data Changes auditing. If Data Audit is switched on in Preferences, all changes for this model will be logged.
The audit logs are available from the Users menu ( Users Data Changes ).
Privacy
The Privacy setting determines if the model is visible to users other than the owner. Note that this setting can also be changed later after the model has been saved.
If you activate the Privacy switch, only the owner of the model can see the related report. Disable this switch if you want other users to see reports based on the model.
Data Access Restrictions
You can apply data access restrictions to each individual row of every dimension in the model. When applied, additional Read and Write columns are automatically added to the dimension and a selection dialog is available to select users and grant editing rights to this data. This option is not available for analytics-type models.
If you are going to use data access restrictions in your reports, you need to activate this feature for the individual dimensions where the restrictions will apply, using the Dimension Preferences dialog on the functional toolbar. This graphic illustrates this feature, showing Model Preferences (#1), Dimension Preferences (#2), and also the additional Read and Write columns. The Data Access option of the model preferences menu shows an overview of which dimensions have been secured in this way but the setting cannot be changed there.
Dimension Preferences
The configuration options available for dimensions depend on the dimension type which is currently selected and these are described in detail in relevant topics of the documentation. The setting for Enable Data Access Control is available on all dimensions.
Related Information
Business Organization [page 15] Creating Models [page 34] Reports [page 62]3.1.7 Explore Dimensions
The dimensions you use in your models are saved independently of any model; when you create a new model, you can either choose an existing dimension or create a new dimension. Modeling uses several dedicated dimension types.
This section gives an overview of the types of dimension available and explains the specific purposes they are used for.
Apart from the built-in dimensions for Time and Category, all dimensions have three basic columns (attributes): ID, Description, and Hierarchy. These cannot be deleted, but additional columns can be added as required. The Hierarchy column is a free-format text attribute where you can enter the ID value of the parent member. By maintaining parent-child relationships in this way, you can build up a data hierarchy that is used in reporting to accumulate high-level values that can be analyzed at lower levels of detail.
The following types of dimension are available:
● Time is a built-in dimension that defines the start and end date of the plan's timeline and the smallest time units that will be used in the plan.
● Categories is a built-in dimension that defines the data versions available in the report: Actual, Budget, Planning, Forecast, Rolling Forecast.
● The Account dimension is for the account the model and reports are generated for. Models can have only one
account dimension.
● The Organization dimension type is optional in a model but offers an organizational analysis of the account data, based, for example, on operating units, geographic entities, or cost centers. A model can have only one organization dimension.
● The Generic type is a free-format dimension to which data can be added or imported as required. This could
be based, for example on products, channels, or sales representatives. A model may have any number of generic dimensions.
● The Pool dimension type is specifically for use with Allocation. See Models for Allocation.
A more detailed description of each dimension type is given in the sections that follow, beginning with the built-in dimensions for Time and Category.
Time Dimension
The time dimension is created automatically when you create a model. It specifies the overall timeframe for the model and also the granularity – the smallest time period down to which the data in reports will be analyzed (yearly, quarterly, monthly, or daily values).
Categories
The data categories for financial planning (Actual, Budget, Planning) are predefined and, when you are designing a model, you need only to modify the frequency settings. Forecasting is based on a range period (quarterly or yearly). The range for the rolling forecast is defined in relation to the current date as a number of periods in the past (Look Back) and a number of periods in the future (Look Ahead).
Related Information
Models for Allocation: Pool Dimension [page 25]
3.1.7.1
Attributes of an Account Dimension
The Account Dimension defines the set of account members and the format of the account data.
This is the main dimension of the model. In addition to the three basic columns of ID, Description, and Hierarchy, a set of technical properties is automatically created when the dimension is first set up. You can hide these
columns, using the Technical Properties button on the toolbar, but they cannot be deleted. List boxes are available for most of the attributes of the account dimension to help you enter data. Your selections and entries are validated as you work so that any invalid or incompatible values are immediately visible.
Account Types
The Account dimension uses an Account Type attribute to automatically handle positive and negative values. From an accounting perspective account members belonging to the Profit and Loss report and the Balance Sheet have to be correctly stored in the database with either a positive or negative value so that the accounts balance correctly. In the application you can enter all values as positive numbers and the switching of signs from positive to negative is handled automatically on the basis of the Account Type setting.
There are four financial account types: Income (INC) and Expense (EXP) items are included in the Profit and Loss account and Assets (AST) and Liabilities (LEQ) are all Balance sheet items. Automatic switching is applied to the account types INC and LEQ. Note that all formulas work on the displayed value not the value saved in the database.
When importing data from an external system, a mapping feature is available to ensure that imported data also fits into this schema. This is Convert signed data symbol by account type. When this checkbox is activated imported data will also be identified by account type and stored and handled correctly.
Currency Rate Types
If you are using currencies with this account and you have added specific exchange rates based on rate types to the currency table you can add the Rate Type column to the account grid by turning this feature on in Dimension Preferences.
Table 5:
Attribute Details
Account Type Select the account type for this type of data:
● INC (Income - uses automatic sign-switching)
● EXP (Expense)
● AST (Asset)
● LEQ (Liabilities and Equity - uses automatic sign-switching)
● NFIN (Non-Financial)
The asset and liability types are aggregated over time and must be linked to an aggregation dimension in the model (such as the built-in Time dimension).
Rate Type This attribute is not visible by default but you can turn it on in Dimension Preferences. The attribute is blank by default so that a generic exchange rate from the currency table will be applied for the account member. If you select a rate type ('Average' or 'Closing') then the exchange rate in the currency table which has also been flagged by this same type will be used.
Unit You can use the Unit attribute to set the value type. Two predefined unit values are available:
● %: All values for this member are percentages. In this case, the Scale attribute is also automatically set to percent.
● Amount: All values for this member are numerical values. In this case, the Decimal Places attribute is au tomatically set to a default of 2, but this can be changed.
Other values can be entered here such as a 3-digit currency code. The attribute can also be left blank for use with the Scale attribute (see below).
Aggregation
Type The aggregation type determines how values are accumulated in reports. For types Average and Last you must also enter the aggregation dimension the value relates to (Time is automatically entered as a default), an aggregation dimension is not relevant for Sum and None.
● AVERAGE: This type can be selected to calculate the average of all aggregated values.
● LAST: This type shows the last (most recent) value in the selected time period; it could be used, for exam ple, to show the number of employees on the last day of a month.
● SUM: This is the default aggregation type for income and expense values; this simply adds all values to gether.
● NONE: Set the aggregation type to None for any dummy nodes on the hierarchy where you want a text label to appear on the report without any calculation of values. In this case, the Description Text for the member is displayed as a label on the report, and a simple dash character is used where otherwise an aggregated value would normally be displayed. If None is selected for a leaf node member of the hierar chy, the leaf member is not available for posting and cannot be edited.
You can see an example text label in the Profit and Loss report shown at the start of this Modeling section: the text label Key Performance Indicators (with four child KPI values) has been defined as type None.
Attribute Details Aggregation
Dimension
If an Aggregation Dimension is required for the member (depending on the account type or aggregation type), enter it here. The list box available for this attribute shows all dimensions in the model and the built-in Time dimension.
Scale To improve the presentation of numbers in the reports and hide numbers which are not significant, you can set this attribute to show just integers plus the specified number of decimal places. The unit value is then shown by the appropriate word or by an abbreviation. You can select one of the following options:
● Thousand (3 numerical places – abbreviation k)
● Million (6 numerical places – abbreviation M)
● Billion (9 numerical places – abbreviation G. Note that G is the international standard abbreviation for bil lion)
● Percent (% 2)
This feature is related to the setting of the Unit attribute that determines if the Scale word or just the abbrevi ated Scale letter is used (see also the example following this table):
● If Unit is set to Amount, the word selected as the Scale value is used in the report.
● If Unit is undefined (blank), the abbreviated Scale letter is used. Decimal Pla
ces This setting defines the number of digits displayed after the decimal point; select a value from 0–7. Formula Calculations and predefined formula can be used for any value of the Account dimension.
Refer to the Formulas section for full details.
Calculate on If you have defined a formula you may need to set this attribute to determine the sequence in which the steps of the calculation are carried out. If the formula is applied to cells with aggregated values the default calcula tion method is to aggregate values before calculating the formula. You can reverse this to calculate the base details before aggregation by setting Calculate on to 'Details'. Refer to the examples in the Formulas section to see an example and illustration of how this impacts the result of a calculation.
Example
This example illustrates the effect of the Scale and Unit settings.
For a member where the Scale has been defined as Million, Unit is blank, and Decimal Places is set to 2, the number 92624530 will be displayed in reports with an abbreviation as 92.62M.
If, on the other hand, Unit is set to Amount, the value will be the full word: 92.62Million.
If no Scale value is selected, the full number is shown formatted by appropriate separators; for example: 92,624,530.00
Related Information
Explore Formulas [page 25] Currency Tables [page 17]3.1.7.2
Attributes of an Organizational Dimension
The organizational structure that applies to the account can be defined as a special organizational dimension in the model. For international business models, currency conversion features are also available.
To create a new organizational dimension, you must select the Type called organization. If the hierarchy refers to geographical locations such as offices or sales areas, you can also switch on the geolocation feature of SAP Cloud for Analytics while creating a new organization dimension. To use this feature, enable the Use Area ID checkbox on the Create New Dimension dialog.
Attributes
In addition to the three basic columns of ID, Description, and Hierarchy, the attributes listed in the following table are available.
Table 6:
Field More information
Currency Enter the 3-character code for the currency that each member will use. Responsible Select the responsible person for the organization member.
A lookup feature is available for this attribute to select the ID.
Area ID This attribute is only visible on the grid if you selected the Use Area ID indicator while creating the dimension; it is used to identify the geolocation information for the members of the organization, and the information is used in charts to display the data in a geomap.
This attribute includes a lookup feature that autocompletes the value if the Description text is recognized as a valid Area ID. Alternatively, you can use the Area ID search feature (active when a cell in this column is high lighted) to look for the correct Area ID value for each row of the hierarchy.
3.1.7.3
Attributes of a Generic Dimension
One or more generic dimensions can be added to a model as required. This is a simple free-format dimension that supports hierarchies and Data Access control.
For a generic dimension, the three basic columns of ID, Description, and Hierarchy are created by default. Use the add icon (+ symbol) on the functional toolbar to add whatever additional columns you require or to add additional hierarchies.
3.1.7.4
Models for Allocation: Pool Dimension
The Pool dimension type is for use with Allocation.
Allocation Scenario
A Business Planning model has been created for Allocation. In addition to the Account dimension, it includes a CostPool dimension (type Pool) that contains the members Logistics, General, and Sales.
For Allocation, other dimensions in the model can be mapped to the Pool dimension so that in reports the costs of each dimension can be allocated to the cost centers defined in the Pool – in this case to Logistics, General, and Sales.
3.1.8 Explore Formulas
Formulas for Modeler and Reports
Formulas perform calculations on either constant values or members of the account dimension. References to members must be enclosed in square brackets (see following illustrations). Some formulas are designed for use in Models and others are designed for use in Reports.
In Modeler, when you create a new account dimension, the Formula column is automatically added. You can enter a formula in the formula bar or use the Edit Formula dialog. In Modeler, formulas apply to individual account members (rows). This example shows formulas using basic arithmetic syntax to perform calculations referring to other members of the account dimension:
In Reports, when you use formulas, additional columns are generated on the report, and calculated values are inserted for all rows. This example shows the predefined delta() formula being added to column H to calculate the difference between actual and forecast values for quarters 1 and 2:
Entering Formulas in Modeler
When you select a cell in the Formula column where the formula will be entered, the text entry bar changes automatically from text mode (T) to formula mode (fx).
Two features are available to help you to enter formula in both Modeler and Reports: Hint Lists and the Formula Editing dialog.
A hint list is immediately displayed as soon as you begin to type in the formula bar. The list shows all available options (including formula and account members) that match with the text you have typed. Account member
descriptions are also displayed in the list to help you identify the member you are searching for. The filtering process also searches this description text to find any values that match the text you have typed.
You can use the Edit Formula dialog to help you to enter, format, and also validate your formula. This dialog lists all the available functions (functions, conditions, operators) that can be used to build up a formula. You can select the functions you require from the lists and also type additional values in the editor.
3.1.8.1
Aggregation in Formula
You can use either the Details() syntax with a formula or the Calculate on details attribute on the account
dimension to determine that a formula calculates all the base details first before calculating an aggregated result. Brackets are used to determine which part of a calculation should be done first. It is also important with formulas to say if any aggregation of values should be done before or after the formula is calculated.
The scenario shown here illustrates this problem and shows how to use the Advanced Formula Editor and the Details() syntax to resolve it. Refer to the account dimension for details of using the Calculate on details attribute as an alternative method of doing this.
In the following example, the value for Total Income is calculated from [PRICE] * [UNITS]. Both Price and Total Income are defined to show aggregated (summed) values:
This illustration shows the difference in the result depending on the sequence of the calculation. In this situation, it is important to determine – in the report that is generated from the model – if the values are aggregated before the formula is calculated (see the green result in the next illustration) or if the formula in each column is calculated first and then the values are aggregated (see the blue result in the next illustration).
Calculate After Aggregation
By default, the formula as entered in the illustration above ( [PRICE] * [UNITS] ) aggregates first and then does the calculation. In this example, this is calculated as:
([TOTAL INCOME], [2014.Q1]) = ([PRICE], [2014.Q1]) * ([UNITS], [2014.Q1]) = 1020 Million $
Calculate Before Aggregation
To determine that a formula calculates all the base details first before calculating the result, you must use the Details() syntax. For this, use the Advanced Formula Editor. Enter your calculation and then select the Details button. This adds the Details formula to the existing calculation. In this case, this is calculated as:
([TOTAL INCOME], [2014.Q1]) = ([TOTAL INCOME], [2014.Jan]) + ([TOTAL INCOME], [2014.Feb]) + ([TOTAL INCOME], [2014.Mar]) = 310 Million $
Note
Details cannot be used with any of the built-in formulas such as lookup(), cagr(), yoy(), and so on.
Details calculations can be applied only to leaf nodes in the hierarchy. If your calculation makes references to members that are not valid, a warning message is displayed identifying the invalid members.
Related Information
Attributes of an Account Dimension [page 21]
3.1.8.2
Variables for Formulas
You can define variables and their default values and then enter the variable name as part of the formula definition. In reporting, the value of the variable is calculated and displayed.
To make formulas and reports more flexible, you can include variables in formula. These are entered in Modeler as placeholders that are defined with a default value. In the report that is generated from the model, you can then select the variable values so that the formula can be used to operate with different numbers or different sets of data.
The following illustration shows firstly the variable definition process in a demo model containing four dimensions, and then how these variables can be used in the formula column of the account.
3.1.8.3
Defining Variables
To define one or more variables for the model, follow the steps given here.
Procedure
1. Choose the Variables option of the Modeler preferences icon.
2. Choose the Add (+) icon on the toolbar and enter a Name for the new variable.
3. Select a Value Domain from the drop-down list box. There are three types of option available for the Value domain:
○ The Number type represents a constant digit that you enter manually; initially, as the default value.
○ To define variables related to the Time dimension, one or more time options (for Year, Quarter, Month, etc.) are available depending on the granularity settings defined. This type can be used for example with the predefined CAGR formula.
○ The list box also includes a reference to each added dimension in the model (based on the ID attribute). This type can be used, for example, with the predefined Lookup formula.
4. Set a default value. If the variable relates to an existing dimension, you can choose Edit (pen icon) to open a list box so that you can browse through the members of the dimension the variable relates to.
5. To use the variable in a formula, simply enter the formula in the normal way. The variables you have defined will be included in the drop-down list boxes.
3.1.8.4
Formula Functions, Conditions, and Operators
The Edit Formula dialog helps you to enter, format, and also validate your formula; it lists all the available functions (functions, conditions, operators) that can be used to build up a formula.
Operators
The four arithmetic operators are available for addition, subtraction, multiplication, and division. These can be used either with constants or when referring to members, for example [A1000]/3 is the value of account member A1000 divided by 3.
Brackets can be used to change the order of evaluation: bracketed parts of the formula are calculated first, for
Conditions
The list of supported conditions that can be used in formula is given in the following table:
Table 7:
Condition Operators Meaning Example
AND Logical expression and: result is true or false [A1 000]>[B1000] AND [A2000]>[B2000] OR Logical expression or: result is true or false [A1000]>[B1000]
= Equal to [A1 000] = [B1000]
> Greater than [A1 000]>[B1000]
< Less than [A1 000]<[B1000]
>= Greater than or equal to [A1 000]> = [B1000] <= Less than or equal to [A1 000]< = [B1000]
!= Not equal to [A1 000]! = 0
Functions
The list of functions available is given in the following table; these can be used with either constants or account members:
Table 8:
Function Meaning
ABS(number) Returns the absolute value of a number (the number without its sign)
IF(expression,val1,val2) The IF function returns the first value if the specified condition is TRUE, and the second value if the condition is FALSE
IF([SALES)>100, [SALES], [SALES]+10) Returns [SALES] if [SALES] is greater than 100
Returns [SALES]+10 if [SALES] is less than or equal to 100 LOG(number) Returns the natural logarithm
LOG10(number) Returns the base 10 common logarithm INT(number) Rounds a number down to the nearest integer FLOAT(arg) Converts arg to a floating point number
DOUBLE(arg) Converts arg to a high precision floating point number POWER(number, power) Returns the result of a number raised to a power
3.1.8.5
Formulas Available in Modeler
Predefined formulas can be used in Modeler to perform complex, frequently required calculations. This section gives syntax details and examples of the formulas that you can use in Modeler.
The Details() formula, which you can use to determine the sequence of calculations (calculate before/after aggregation), cannot be used in combination with the formula listed here.
Lookup()
The Lookup formula provides a cross-dimension feature that can be used to link to another account member in the current model. Optionally, a Point of View can be specified to further restrict data in the current account member. The Lookup formula cannot be used with other formulas.
The name of this formula was originally Restrict(), both names are valid. Syntax:
Lookup(<model account member>; [<dimension name>=<account member1>, <account member2>])
Table 9:
Parameter Usage
<account member> Specifies an account member in the model.
[<Point of View>] Optional. This is a list containing selected dimensions and their members and is used to further restrict data in the account member (see example 1).
For this parameter, the all keyword is available to select all members in the dimension: [<dimension name>(all)] (see example 2).
Additionally, you can use time navigation syntax to identify specific periods (see example 3 and following examples).
Example
1. Lookup([400000];[sap.epm:Employee=e1, e2]) 2. Lookup([400000];[sap.epm:Region(all)])
3. Lookup([400000];[sap.epm:Time.Year(previous, 1).Day(next, 5)])
An extensive set of keywords is available for time navigation. The following examples show how these are used:
● Lookup([400000];[sap.epm:ProfitAndLoss_Time.Year(Next,1).Month(Current)]
● Lookup([400000];[sap.epm:ProfitAndLoss_Time.Year(Next,1).Quarter(Last,1).Month(Last,1)])
Link()
Model linking (blending) can be used to display data from more than one model in a single report. The Link formula cannot be used with other formulas.
Syntax:
LINK(<model name>; <target model account member>; [<dimension name>=<account member1>, <account member2>])
Table 10:
Parameter Usage
<model name> Specifies the target model name.
<account member> Specifies the target model account member.
[<Point of View>] Optionally, a point of view can be specified. This is a list containing selected dimensions and their members and is used to further restrict data in the target account member.
For this parameter, the all keyword is available to select all members in the dimension: [<dimension name>(all)].
Example
LINK(sap.epm:ProfitAndLoss;INCOME_STMT;[sap.epm:Region(all)], [sap.epm:Product=HPRD0001,HPRD0002])
Compound Average Growth Rate()
Compound Average Growth Rate (CAGR) is the mean annual growth rate over a specified period of time longer than one year.
To calculate compound annual growth rate, divide the value of a member at the end of the period in question by its value at the beginning of that period, raise the result to the power of one divided by the period length, and subtract one from the subsequent result.
Syntax:
CAGR(<account member>; <start date>; <end date>])
Example
Simple Moving Average()
The simple moving average (SMA) is calculated by adding the value of a member for a number of time periods and then dividing this total by the number of time periods.
Syntax:
SMA(<account member>; <time period>; <number>])
Example
newSMA = SMA([400000];[Month];[3])
Year Over Year()
Year over Year returns a percentage showing the difference between the value of a member in the current year compared with the previous year.
Syntax:
YoY(<account member>)
Example
Revenue_YoY = YoY([Revenue])
This is calculated as:
[REVENUE_CURRENT]/[REVENUE_PREVIOUS_YEAR]-1,0
A check is made to ensure that the neither the current year not the previous year are blank.
3.2 Creating Models
The Models page lists all existing models that have been created and is the starting point for designing new models. Alternatively, models can also be created on-the-fly in Data Integration.
Context
An overview of the steps to manually create a planning model is given here. Some changes can be made only during this design phase – that is, up to the point where you save the model for the first time and an initial report is generated. Once the design is complete you can populate the model with data.
Procedure
1. Create the basic model by choosing New Models (the + icon) from the toolbar on the Models page. 2. In the Create Model dialog, enter a name and description for the model. For a planning model, select the
checkbox Planning Enabled, and then choose Create.
3. The Time and Categories dimensions are built into planning models. You can modify the default settings as required:
a. Set the Lowest Granularity time period for the model – that is, the time period on which your data will be based: year, quarter, month, or day.
b. Choose a start and end date for the timeline for the data.
c. Basic categories are predefined: actual, budget, planning, forecast, or rolling forecast. Choose the frequency (year, quarter, month) that will be used as the basis for these categories.
d. For the Forecast category, choose the forecast range period (quarterly or yearly). The range for the rolling forecast is defined in relation to the current date as a number of periods in the past (Look Back) and a number of periods in the future (Look Ahead).
4. Set up the account dimension for the model by either selecting an account from the list of existing dimensions or creating a new one from scratch. Optionally, you can add an organizational dimension to your model and also other generic dimensions. See Explore Dimensions for details of all dimension types.
5. Set the model preferences: from the menu of the wrench icon, choose Preferences, and enable all of the specific features you need, such as data auditing. Note that only the Privacy setting can be changed later once you have saved the model.
6. Set the Data Access restrictions for each dimension as described in the following subsection.
Related Information
Modeler [page 12]Planning Models and Analytics Models [page 14] Design Options: Model Preferences [page 18] Data Access [page 36]
Explore Dimensions [page 20]
3.2.1 Creating Models Using the Planning Wizard
An additional method for creating models is the Planning Wizard, this is available on the Home screen for first time users and is permanently available in Stories as an option when adding a Dynamic Table to a grid.
The Model Planning Wizard provides a template to create one of three types of plan, when you create the plan the model behind the wizard is also created on the fly at the same time. You can enter data for the new model directly in the grid of the dynamic table. The three types of plan are:
● Basic Financial Plan
● Custom Plan
A plan in a dynamic table has a simple grid structure of columns and rows and the template prompts you to enter text values which are added to each column. The Basic Financial Plan, for example, offers predefined columns for Accounts, Regions and Products.
When you have entered all the plan details and selected OK to continue, the plan and the model are created. The model that is created is added to the Modeler list page and contains the dimensions (columns of the plan) and the line details (dimension members) which you entered in the template. A dimension type is automatically assigned to each dimension that is created and the new dimensions are named automatically as
<ModelName>_<DimensionType>. Additional information from the wizard is saved in the dimension Description value.
The wizard also requires you to enter information about the frequency of data updates. This information is used to automatically create a time dimension for the model.
3.2.2 Data Access
You can restrict access to the data of reports by setting read and write permissions for individual values. This feature is optional and can be activated for any dimension in the model.
Context
You can enable Data Access restrictions by selecting the Enable Data Access Control checkbox in the Edit Dimension Preferences dialog. Once this has been activated, two additional columns (Read and Write) are added to the grid of the dimension so that individual settings can be applied to each row. You can select one or more users (or simply all users) who will have access to the data from a list box.
Procedure
1. Select the dimension that you want to modify and choose Preferences from the toolbar.
2. In the Edit Dimension Preferences dialog, select the Enable Data Access Control checkbox and choose OK. 3. You can now use the two new columns Read and Write to control access to all rows of the grid by selecting
one or more users in either or both of the columns.
You can see a summary of all dimensions in the model and the data access settings from the model Preferences menu (Wrench icon). Select the Data Access option that displays a list of dimensions. This information is read only; the data access setting can be changed only in the Dimension Preferences dialog.
3.3 Creating Dimensions
Every model must have one account-type dimension. You can add more dimensions of other types as required: Organizational (only one), Generic, or Pool.
Context
You are creating a new model or adding dimensions to an existing model. Initially, if no account dimension has been set up, the account dimension has the name 'Account'. The model cannot be saved until the account dimension has been added.
Procedure
1. For the account dimension, choose Account and then Create New Dimension from the drop-down list. For
other dimension types, choose Add (plus icon) and then Create New Dimension from the drop-down list.
2. In the Create New Dimension dialog, select the dimension Type. Enter a Name and, optionally, a Description. Depending on your security requirements, select Enable Data Access Control.
○ For an organization dimension, the additional option Use Area ID is available to automatically identify geolocation information for each member of the organization.
○ For a pool dimension, a list of Mapped Dimensions is also maintained. The account dimension is selected as a mapped dimension by default. You can select any other dimensions that are available, as needed. 3. Choose Create to add the new dimension to the model.
An initial # member is added to each dimension (but not the account dimension). You cannot delete this member manually, but you can paste data into the dimension grid and overwrite this initial row.
The Options menu gives access to the Dimension Preferences dialog where you can update some of the basic
details of the dimension.
During the design stage of the model, you can delete dimensions or use the Replace Dimension feature on the Options menu to select a new dimension from the list of existing ones. Once you have saved the model, dimensions can no longer be removed or replaced.
It is also possible to completely delete dimensions that are no longer in use. To do this, go to the Modeler
Dimensions tab page and select the dimension from the list. Choose Delete to remove the dimension.
Results
After creating a dimension, a new tab with the name of your dimension is added to the model. You can now add or load data to the dimension. The new dimension is also added to the dimension list tab page in Modeler.
3.3.1 Editing Dimensions
Once a model has been created, you can continue to maintain the content.
You can add more dimensions to a model and also add more columns and rows to a dimension.
● Choose Options Preferences to access the Dimension Preferences dialog. Here you can modify the
Description of the dimension and in some cases it is also possible to change the dimension Type (you can change a Generic type to an Organization type).
● To enable security for the dimension, check Enable Data Access Control.
● Choose Add to add rows, columns, or additional hierarchies to your dimension.
Related Information
Explore Hierarchies [page 18]Design Options: Model Preferences [page 18]
3.3.2 Editing Dimension Attributes
Several options are available for maintaining the content in the dimension grid. You can change dimension attributes in the grid as follows:
● For all properties, you can copy and paste values from an external data source.
● The Account dimension includes a set of technical properties. List boxes are available to help you enter data in each cell of these properties.
● To insert a new attribute (column), choose Add (plus icon on the toolbar) and select Add Column. This inserts a column to the left of the currently selected cell.
● To insert a new hierarchy, choose Add and select Add Hierarchy. This appends a new column to the existing ones.
● To insert a new row, choose Add and select Add Row. This inserts a row above the currently selected cell.
● To copy a row, choose Copy Row on the toolbar. This duplicates the current row and marks it red to indicate that the content must be further edited.
3.4 Clearing Model Data
Using the eraser icon on the toolbar, you can clear a selected model of all data. You can do this for the model as a whole, for individual dimensions, or for selected dimension members.
Context
This feature is restricted to user roles with privileges to delete models.
Procedure
1. Select a model in the Modeler list screen by marking its checkbox.
2. Select Clear Selected Model (the eraser icon) on the toolbar. This opens the Clean Modeler dialog. 3. The complete hierarchy of members for each dimension in the model is displayed in a dialog. You can
navigate through the collapsible list of available members to select individual account members, or you can select all members of a branch at the top level of the hierarchy.
4. After making your selection, select OK to continue. This displays a verification prompt that you must confirm to complete the operation.
3.5 Deleting a Model
You can delete a model and all related data by selecting the Delete icon (trashcan) on the Modeler toolbar.
Context
This feature is restricted to user roles with privileges to delete models. When you delete a model, the built-in dimensions of Time and Category are automatically deleted but other dimensions are kept. These are still available in the Dimensions list and can be reused in other models.
Procedure
1. On the Models list screen, select the model you want to delete by selecting its checkbox. 2. Choose Delete from the toolbar.
3. To delete the model and all related data, confirm the warning message.
4. If you want to also delete the dimensions from this model that are no longer in use, go to the Modeler
Dimensions tab page and select the dimension from the list. Choose Delete to remove the dimension.
3.6 Data Import
You can populate models with data by importing data from files or other systems. It is also possible to directly create a model by importing from an appropriate data source.
The table below lists the available options for importing data. To import data from a flat text file, the data must be delimited (such as comma-separated values). Data in Microsoft Excel can be imported. If the data is saved on separate sheets in the Excel workbook, you can choose which sheet to import. Data files can be stored locally on your file system or network; direct import from Google Drive is also supported.
Integration of SAP Cloud for Analytics with a number of other systems is also possible. In the current release, direct connections to SAP HANA database views are supported, as is import of data from SAP Business Planning and Consolidation (BPC).
Import Option More Information
Import Model from File ● About Importing a Model from a File [page 42]
● Importing a Model from a File [page 45]
Import Data from File ● About Importing Data from Files [page 47]
● Importing Data from Files [page 49]
Import Model from BPC ● About Importing Data from Other Systems [page 50]
● About Importing a Model from BPC [page 51]
● Importing a Model from BPC [page 52]
Import Data from BPC ● Importing Data from BPC [page 55]
● About Importing Data from BPC [page 53]
Import from Google Drive Connecting to Google Drive [page 41]
Create Model from HANA Creating a Model from HANA [page 56]
Create Model from Remote System