EXECUTIVE SUMMARY
Design, Modeling, and Control of Hybrid Energy Storage System
for Defense Installation Microgrids
ESTCP Project EW19-5277
JANUARY 2020
Distribution Statement A
This report was prepared under contract to the Department of Defense Environmental
Security Technology Certification Program (ESTCP). The publication of this report does not indicate endorsement by the Department of Defense, nor should the contents be construed as reflecting the official policy or position of the Department of Defense. Reference herein to any specific commercial product, process, or service by trade name, trademark, manufacturer, or otherwise, does not necessarily constitute or imply its endorsement, recommendation, or favoring by the Department of Defense.
i
EXECUTIVE SUMMARY
Project: EW19-5277
TABLE OF CONTENTS
Page
1.0 INTRODUCTION ... 1
2.0 OBJECTIVES ... 3
3.0 ENERGY STORAGE TECHNOLOGIES ... 5
4.0 DOD INSTALLATIONS MODELED ... 7
5.0 MODELING METHODOLOGY ... 9
6.0 PERFORMANCE ASSESSMENT ... 11
7.0 COST ASSESSMENT ... 15
ii
LIST OF FIGURES
Page Figure 1. Process Flow Diagram Detailing the Steps Used to Calculate the Cost-optimal Microgrid Portfolio for Energy Security Operations of Each Base Considered ... 9 Figure 2a. Optimal Microgrid Portfolio and Levelized Cost of Electricity of Each Base Modeled
for Each Battery Technology Paired with a Ultracapacitor/UPS System That Can Extend the Expected Life with No ITC or MACRS Incentives... 16 Figure 2b. Optimal Microgrid Portfolio and Levelized Cost of Electricity of Each Base Modeled
for Each Battery Technology Paired with a Ultracapacitor/UPS System that Can Extend the Expected Life Including ITC and MACRS Incentives ... 17 Figure 3. Potential Revenues from Ancillary Services at Westover ARB with Storage-Enabled
Microgrid. ... 18 Figure 4. Optimal Sizing of All Assets (PV, Generators, Storage) for Ventura. ... 18
iii
LIST OF TABLES
Page
Table 1. Summary of Modeled Energy Storage TechnologyS ... 5
Table 2. Installation Characteristics and Potential Microgrid Benefits ... 7
Table 3. Summary of Performance for Optimized Storage-enabled Microgrid ... 12
iv
v
ACRONYMS AND ABBREVIATIONS
AFB Air Force Base ARB Air Reserve Base AS Ancillary services ASU Arizona State University
DoD United States Department of Defense ESM Energy security model
ES Energy storage
ESS Energy storage system
ESTCP U.S. Department of Defense Environmental Security Technology Certification Program
HESS Hybrid energy storage system ITC Investment tax credit
kW Kilowatt
kWh kilowatt-hour
LCOE Levelized Cost of Energy or Electricity MACRS Modified accelerated cost-recovery system MWh Megawatt-hour
NAS Naval air station PV Photovoltaic
vi
vii
ACKNOWLEDGMENTS
Southern Research, in collaboration with Arizona State University, XENDEE Corporation, and 350Solutions would like to acknowledge the funding support the U.S. Department of Defense Environmental Security Technology Certification Program (ESTCP). Southern Research would also like to acknowledge Jeffrey Marqusee of NREL for program guidance, and several storage technology development organizations for providing valuable technical support to the project: AllCell Technologies, Avalon Battery, Blue Planet Energy, EOS Energy Storage, Maxwell Technologies, and NGK. We would also like to thank key contributing team members: Tim Hansen, Bill Chatterton, and Patrick Woolcock at Southern Research and 350Solutions; Nathan Johnson and James Nelson at Arizona State University (ASU); and Zack Pecenak, Kelsey Fahey, and Adib Nasle at XENDEE.
viii
1
1.0
INTRODUCTION
This document describes design, modeling, and control of a hybrid energy storage system (HESS) for Department of Defense (DoD) microgrids.
Southern Research, with 350Solutions, has managed a program to optimize energy storage (ES) implementation in DoD microgrids, with collaborators Arizona State University (ASU) and XENDEE Corporation developing a microgrid and energy storage design, modeling, and controls platform. The integrated methods from ASU and XENDEE optimize a microgrid that can contain multiple different energy storage types—a HESS approach—in conjunction with diesel, renewable, and other generation platforms. Microgrid designs with optimized asset selection, sizing, and configuration are coupled with model predictive controls and dispatch algorithms to optimize real-time performance and economics.
2
3
2.0
OBJECTIVES
The primary objectives of this project were to:
• Demonstrate the value of integrating optimized energy storage solutions, including the potential for multiple technology types and multi-asset HESSs within DoD microgrids.
• Improve energy security performance as a function of cost compared to a similar microgrid without storage at DoD installations.
• Develop an integrated, microgrid design tool that rapidly produces performance- and cost-optimized, storage-technology-agnostic, customized microgrid designs and specifications.
• Demonstrate controls techniques to improve revenue from energy market participation.
• Perform co-simulation of design and controls methodologies to maximize performance and financial objectives for the project lifetime.
4
5
3.0
ENERGY STORAGE TECHNOLOGIES
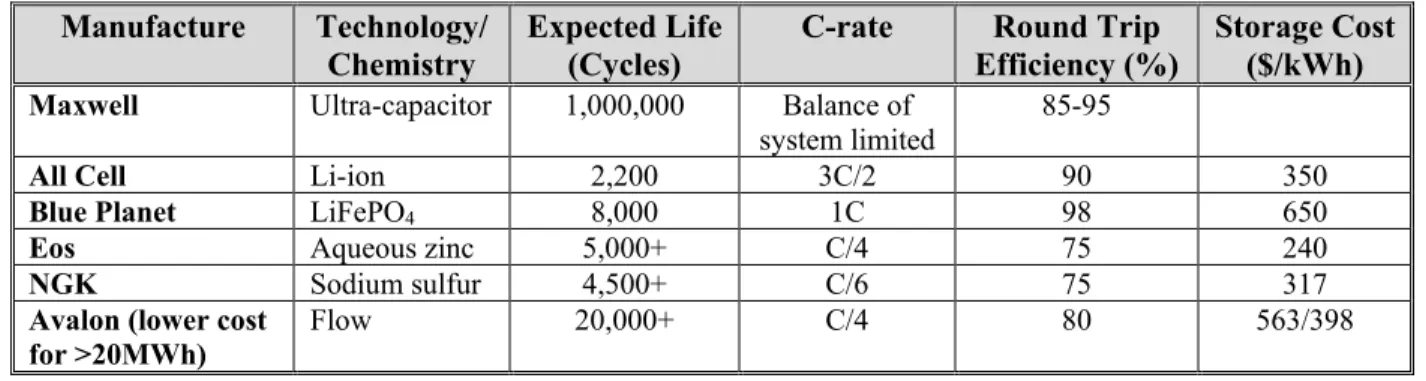
The project team selected six energy storage technologies as summarized in Table 1. Storage technologies evaluated broadly covered current commercially available storage approaches and chemistries. This allowed modeling of storage integration considering a range of key technology attributes, such as C-rate, efficiency, and life. Each of these core technology types was selected based on ability to excel in one or more of the six key performance attributes: coverage, availability, reliability, duration, ride-through capability, and stacked-value.
Table 1. Summary of Modeled Energy Storage TechnologyS
Manufacture Technology/
Chemistry Expected Life (Cycles) C-rate Efficiency (%) Round Trip Storage Cost ($/kWh)
Maxwell Ultra-capacitor 1,000,000 Balance of
system limited 85-95
All Cell Li-ion 2,200 3C/2 90 350
Blue Planet LiFePO4 8,000 1C 98 650
Eos Aqueous zinc 5,000+ C/4 75 240
NGK Sodium sulfur 4,500+ C/6 75 317
Avalon (lower cost
6
7
4.0
DOD INSTALLATIONS MODELED
Five DoD installations with varying microgrid capacities were evaluated for design and incorporation of an optimized HESS approach, as summarized in Table 2.
Table 2. Installation Characteristics and Potential Microgrid Benefits
Installation Selection Rationale & Characteristics of Interest
Westover Air Reserve Base (ARB)
Smallest facility with lowest annual electricity cost. High cost structure. High projected comparative solar capacity. Potential for microgrid to cover significant peak and critical load. Naval Base
(NB) Ventura County
Mid-sized facility. California market (high electricity cost). Low PV capacity (but significant potential). Low critical load as percentage of peak demand. Small ESS investment with potential resiliency impacts.
Holloman Air Force Base (AFB)
Significant PV resource as percentage of peak (33%) and critical (83%) loads. Large utility with demand and time of use charges. High potential for utilizing solar PV plus energy storage. Naval Air
Station (NAS) Patuxent River
Large energy consumer. Regionally unique (mid-Atlantic). Electric Cooperative supplier. Unique use case. PJM Interconnection regional transmission organization market access.
Fort Bliss Largest energy consumer of group. Small critical load as percentage of peak demand, but
largest critical load of all sites. Large, vertically integrated utility with multiple price structures. Potential for significant quantity of energy storage to mitigate time of use and demand charges.
8
9
5.0
MODELING METHODOLOGY
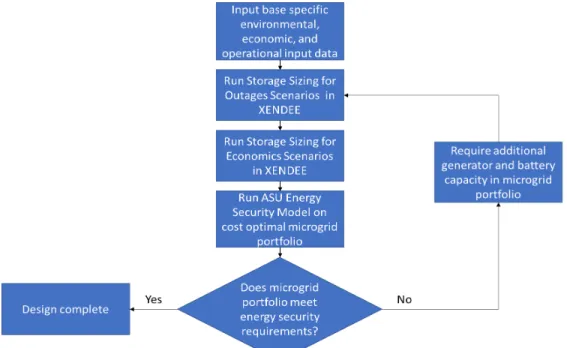
An optimized microgrid and energy storage platform with integrated analytics and controls was utilized to evaluate potential HESS solutions at each of the five select DoD installations. This approach rapidly provides tailored energy storage enabled microgrid designs for any installation by considering climate zone, local energy market, and location specific use cases. The approach combines economic optimization through the XENDEE platform and ASU’s energy security model (ESM) to evaluate energy asset portfolios. This method ensures energy security metrics are achieved while providing the lowest cost energy. Figure 1 shows the general process used to select the optimal energy asset portfolio for each of the considered bases.
Figure 1. Process Flow Diagram Detailing the Steps Used to Calculate the Cost-optimal Microgrid Portfolio for Energy Security Operations of Each Base Considered
The models utilized the following tools:
• XENDEE: XENDEE secure cloud computing microgrid platform (XENDEE, 2017) provides economic system optimization via distributed energy resource-customer adoption model technology—a state-of-the-art decision support tool for decentralized energy systems, including buildings and microgrids—and also implements critical electrical design analysis (power flow, short circuit, reliability, arc-flash).
• ASU ESM: ASU’s ESM is a Python-based standalone model that, for our purposes, calculates a critical load coverage probability curve and provides an optimized dispatch methodology to maximize coverage probability. The model can be used for real-time microgrid controls.
10
11
6.0
PERFORMANCE ASSESSMENT
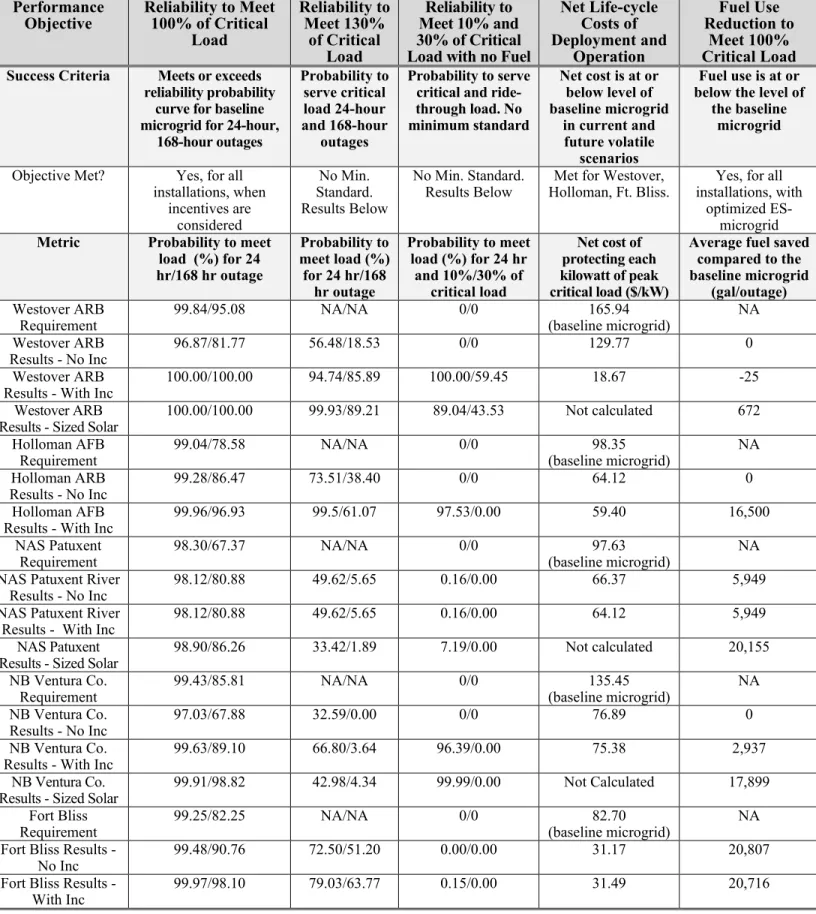
A summary of the primary performance metrics and the performance of the optimized ESS-enabled microgrid design is provided in Table 3. Key findings are:
Energy Storage Technology Selection:
• For the core case with only potential energy storage addition and no market participation or incentives, energy storage is not specified in the optimal microgrid for three locations – Westover ARB, Holloman AFB, and NB Ventura County. For Ft. Bliss and NAS Patuxent, small quantities of energy storage are specified. When incentives and wholesale market participation are included, energy storage is selected for all sites, with significant impacts on net protection cost and levelized cost of electricity.
• The overall difference in performance and economic impacts between different storage options in the optimized microgrid is quite small, and depends highly on the system costs. For these cases, any of four identified technologies could be selected with <1% impact on economics, including net protection cost and levelized cost of electricity.
• A LiFePO4 battery was identified as the optimal storage technology to use in four military bases’ optimal portfolio due to its high lifetime and low self-discharge rate. A flow battery was identified as the optimal storage technology for Westover for the same reasons. However, other technologies also show promise with nearly equivalent economic performance.
• The combination of an ultracapacitor with battery storage typically provides the best performance, with potential for significant reductions in uninterruptible power supply (UPS) and generator costs.
Energy Security Performance:
• Performance objectives related to critical load coverage (24- and 168-hour) were met by the economically optimized microgrid design and dispatch scenario at Holloman (no ES), Ventura (no ES), and Fort Bliss (with ES), but not at Westover and Patuxent (24 hr).
• When access to incentives results in energy storage specification at all sites, the critical load coverage performance objectives are readily met. The optimized ESS enabled microgrid designs provide significant improvements in reliability to meet critical loads, especially for long outage duration (168-hour), and greater than 50% probability to meet 130% of critical load for 24-hour outages.
• Significant capability is provided to support portions of critical loads when no fuel was available are demonstrated for the optimized ESS microgrid when incentives are enabled.
• Fuel use was reduced for all sites with the optimized ESS microgrid (with incentives) compared to the baseline microgrid, when covering 100% critical load.
12
Table 3. Summary of Performance for Optimized Storage-enabled Microgrid
Performance
Objective Reliability to Meet 100% of Critical Load Reliability to Meet 130% of Critical Load Reliability to Meet 10% and 30% of Critical Load with no Fuel
Net Life-cycle Costs of Deployment and Operation Fuel Use Reduction to Meet 100% Critical Load
Success Criteria Meets or exceeds reliability probability
curve for baseline microgrid for 24-hour,
168-hour outages Probability to serve critical load 24-hour and 168-hour outages
Probability to serve critical and ride-through load. No minimum standard
Net cost is at or below level of baseline microgrid
in current and future volatile
scenarios
Fuel use is at or below the level of
the baseline microgrid
Objective Met? Yes, for all
installations, when incentives are considered No Min. Standard. Results Below
No Min. Standard.
Results Below Holloman, Ft. Bliss. Met for Westover, installations, with Yes, for all optimized
ES-microgrid
Metric Probability to meet load (%) for 24 hr/168 hr outage
Probability to meet load (%) for 24 hr/168
hr outage
Probability to meet load (%) for 24 hr
and 10%/30% of critical load
Net cost of protecting each kilowatt of peak critical load ($/kW)
Average fuel saved compared to the baseline microgrid
(gal/outage)
Westover ARB
Requirement 99.84/95.08 NA/NA 0/0 (baseline microgrid) 165.94 NA
Westover ARB
Results - No Inc 96.87/81.77 56.48/18.53 0/0 129.77 0
Westover ARB
Results - With Inc 100.00/100.00 94.74/85.89 100.00/59.45 18.67 -25
Westover ARB
Results - Sized Solar 100.00/100.00 99.93/89.21 89.04/43.53 Not calculated 672
Holloman AFB
Requirement 99.04/78.58 NA/NA 0/0 (baseline microgrid) 98.35 NA
Holloman ARB
Results - No Inc 99.28/86.47 73.51/38.40 0/0 64.12 0
Holloman AFB
Results - With Inc 99.96/96.93 99.5/61.07 97.53/0.00 59.40 16,500
NAS Patuxent
Requirement 98.30/67.37 NA/NA 0/0 (baseline microgrid) 97.63 NA
NAS Patuxent River
Results - No Inc 98.12/80.88 49.62/5.65 0.16/0.00 66.37 5,949
NAS Patuxent River
Results - With Inc 98.12/80.88 49.62/5.65 0.16/0.00 64.12 5,949
NAS Patuxent
Results - Sized Solar 98.90/86.26 33.42/1.89 7.19/0.00 Not calculated 20,155
NB Ventura Co.
Requirement 99.43/85.81 NA/NA 0/0 (baseline microgrid) 135.45 NA
NB Ventura Co.
Results - No Inc 97.03/67.88 32.59/0.00 0/0 76.89 0
NB Ventura Co.
Results - With Inc 99.63/89.10 66.80/3.64 96.39/0.00 75.38 2,937
NB Ventura Co.
Results - Sized Solar 99.91/98.82 42.98/4.34 99.99/0.00 Not Calculated 17,899
Fort Bliss
Requirement 99.25/82.25 NA/NA 0/0 (baseline microgrid) 82.70 NA
Fort Bliss Results -
No Inc 99.48/90.76 72.50/51.20 0.00/0.00 31.17 20,807
Fort Bliss Results -
13
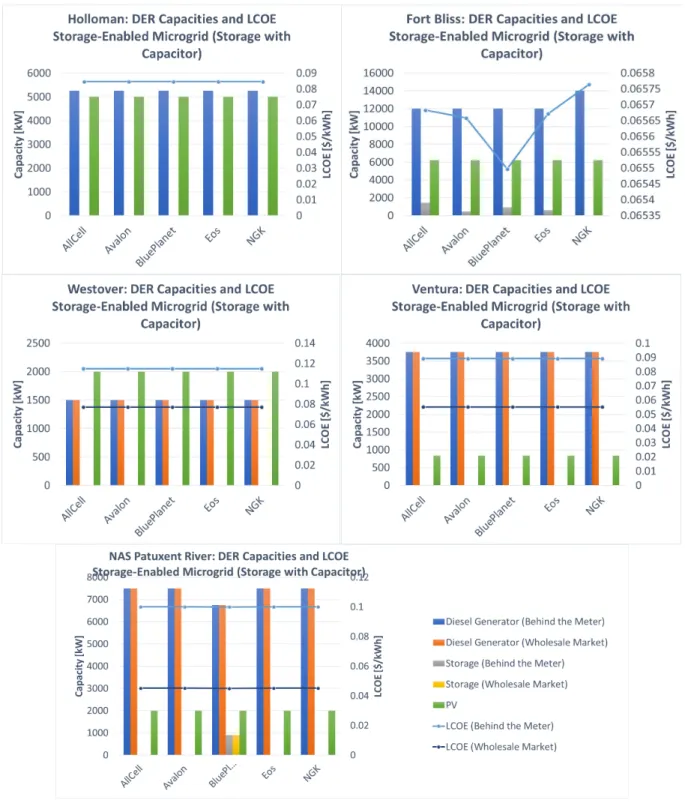
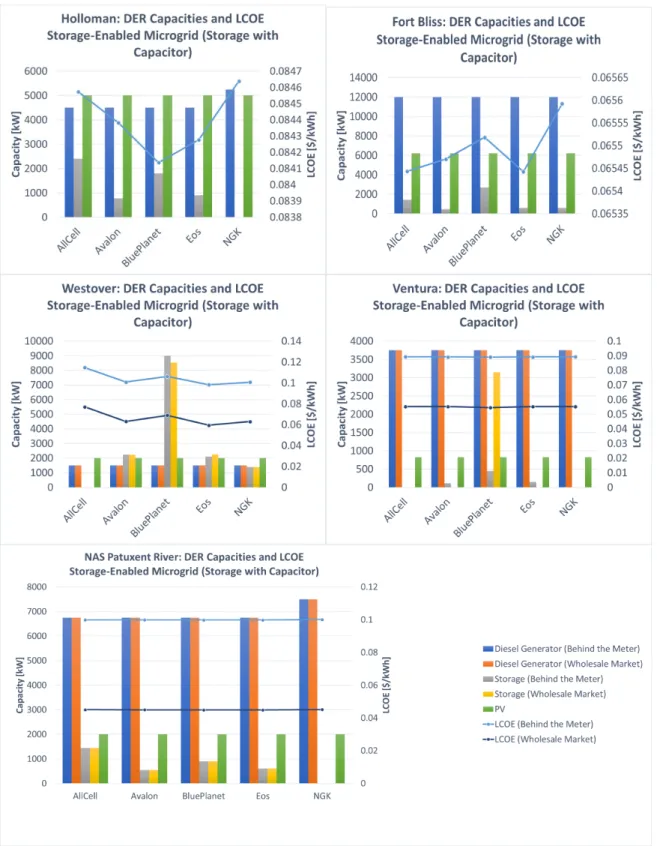
Optimal storage capacity for each technology type and installation, as well as projected levelized cost of energy (LCOE)1 for each system design are provided in Figures 2a and 2b (design with incentives).
1Levelized Cost of Energy (LCOE)—measures lifetime costs divided by energy production for a specific site or project via calculation of net present value of the total cost of building and operating a power plant (microgrid) over an assumed lifetime.
14
15
7.0
COST ASSESSMENT
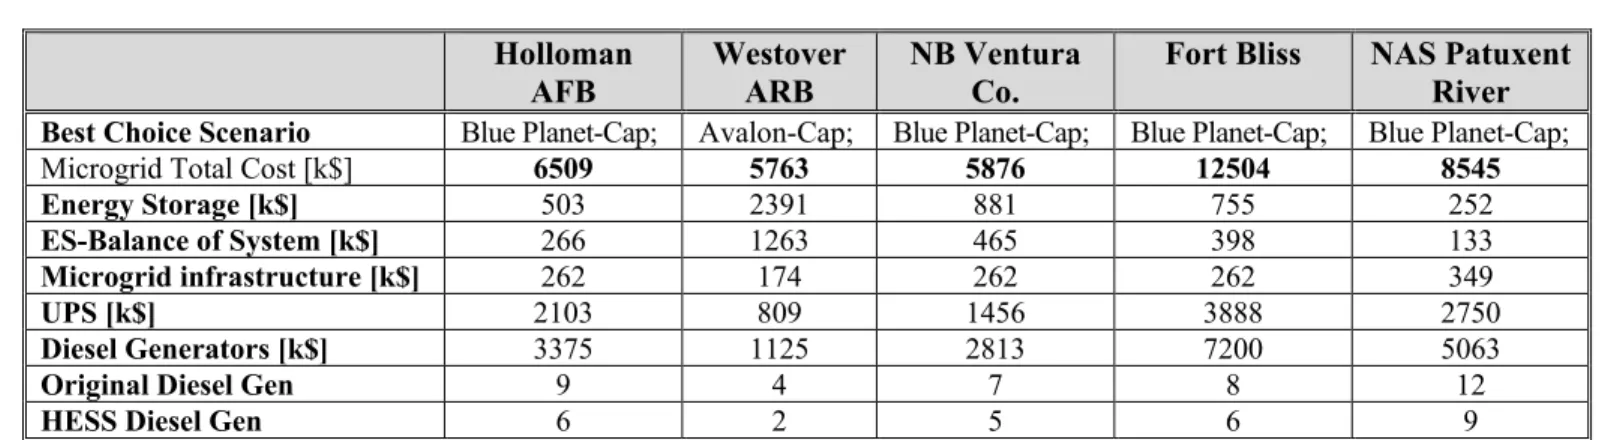
Estimated energy storage system costs are summarized in Table 4.
Table 4. Optimized Storage-enabled Microgrid Systems for All Locations
Holloman
AFB Westover ARB NB Ventura Co. Fort Bliss NAS Patuxent River
Best Choice Scenario Blue Planet-Cap; Avalon-Cap; Blue Planet-Cap; Blue Planet-Cap; Blue Planet-Cap;
Microgrid Total Cost [k$] 6509 5763 5876 12504 8545
Energy Storage [k$] 503 2391 881 755 252
ES-Balance of System [k$] 266 1263 465 398 133
Microgrid infrastructure [k$] 262 174 262 262 349
UPS [k$] 2103 809 1456 3888 2750
Diesel Generators [k$] 3375 1125 2813 7200 5063
Original Diesel Gen 9 4 7 8 12
HESS Diesel Gen 6 2 5 6 9
Note: All best choice scenarios were found modeling ITC/MACRS incentives applied to storage, and include market participation, where available. Cost-optimal solutions for bases when designed without applying incentives selected no storage for four of the bases.
Overall, for the optimized ES-enabled microgrid (with investment tax credits (ITC) and modified accelerated cost-recovery system (MACRS) incentives), net lifecycle costs were below those of the baseline microgrid for all sites. Important findings are:
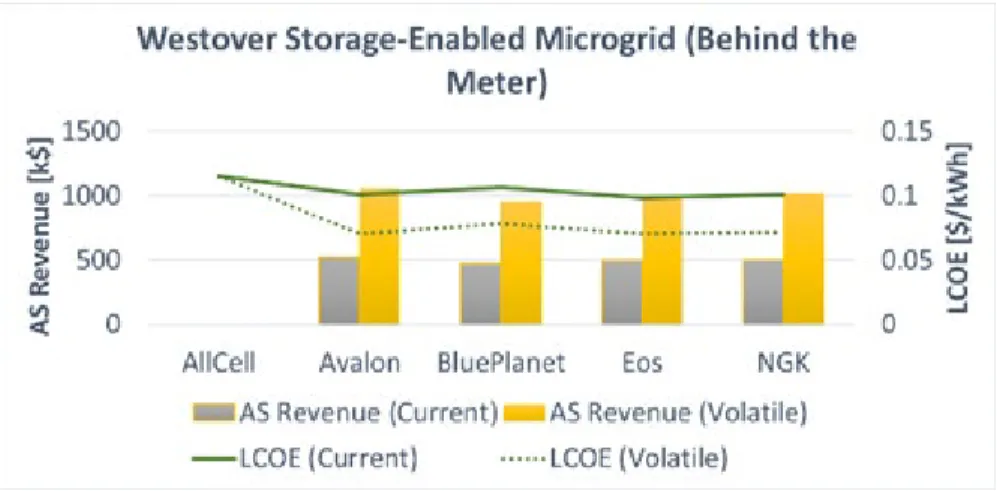
• On each base, the greatest ancillary service (AS) potential is provided by installing the largest optimal ESS possible, providing the most capacity for participation.
• Westover ARB provided the greatest potential for AS revenue and significant differences in LCOE for different technologies due to large solar photovoltaic (PV) generation combined with ES.
• LCOE is directly correlated with AS revenue, where larger shares of AS revenue produce the solutions with the lowest overall LCOE.
• For the Wholesale Market cases, low real-time pricing rates drive down storage sizing and AS revenue.
Example revenues for the optimized ES-enabled microgrid for Westover ARB are summarized in Figure 3.
PV system size relative to total load is a primary driver in storage sizing and operation. For NB Ventura County, if all three technologies—energy storage, PV generation, and generators—are optimally sized, rather than restricting the PV array capacity to the pre-planned 830 kW, the optimal technology portfolio includes a much greater amount of PV and storage (Figure 4). The increase in PV and storage capacity improves microgrid ability to meet critical loads through renewable generation and storage, and fewer diesel generators are needed for backup power. A significant reduction in both LCOE (~17%) and total annual energy cost (~15%) can be achieved with additional PV and storage, with more potential opportunities for demand charge reduction and price arbitrage during normal operation. Both utility energy purchases and demand charges are significantly reduced when the microgrid is sized without the 830 kW array capacity restriction.
16
Figure 2a. Optimal Microgrid Portfolio and Levelized Cost of Electricity of Each Base Modeled for Each Battery Technology Paired with a Ultracapacitor/UPS System That Can
17
Figure 2b. Optimal Microgrid Portfolio and Levelized Cost of Electricity of Each Base Modeled for Each Battery Technology Paired with a Ultracapacitor/UPS System that Can
18
Figure 3. Potential Revenues from Ancillary Services at Westover ARB with Storage-Enabled Microgrid.
Each battery Technology is paired with a ultracapacitor/UPS system that can extend the expected life including ITC and MACRS incentives
Figure 4. Optimal Sizing of All Assets (PV, Generators, Storage) for Ventura.
Each battery technology is paired with a ultracapacitor/UPS system that can extend the expected life including ITC and MACRS incentives.
19
8.0
STUDY CONCLUSIONS
Primary conclusions of the study are that an optimized storage-enabled microgrid can:
• Improve energy security over 24-hour and 168-hour time horizons as measured by the critical load coverage probability (CLCP).
• Provide increased ability to meet greater than 130% critical load without resizing the system.
• Reduce fuel use by up to 22% during 7-day outages, thereby increasing mission autonomy in case of fuel supply shortage.
• Integrate on-grid economic optimization with off-grid reliability to provide resilience with potential return on investment at sites with significant market participation potential.
• Lower net protection cost via optimization of assets, including diesel generators, by adding storage and reducing generator units as compared to the baseline generator-only case, while meeting required critical load coverages.
In addition, important factors to consider include:
• Implementation of a hybrid system with ultracapacitors can improve the lifetime of long-duration storage, with additional potential benefits to be evaluated in Phase II.
• Hybrid battery-battery energy storage systems have potential to provide benefits in certain applications, but the economics of such systems are not typically better than single technology systems for the cases evaluated.
• Optimizing the entire microgrid, with a focus on the sizing and integration of PV generation with ESS can provide significantly improved economics, e.g. reducing LCOE by an added 15% and increasing no-fuel critical load coverage by 70+% for NB Ventura County.
• Microgrids that participate in wholesale markets could increase revenue at three of the five modeled installations, with potential for nearly $0.5M/year in additional revenue for a facility such as Westover ARB.