Conflict of interest: JWM is a consultant to Gilead Sciences and Merck Co., Inc., and owns share options in Co-Crystal Pharmaceuticals, Inc. JJE is a consultant to Merck Co, Inc., Janssen Pharmaceuticals, Gilead Sciences, and ViiV Healthcare.
Submitted: March 1, 2019 Accepted:
May 16, 2019
Published: June 20, 2019.
Reference information:JCI Insight. 2019;4(12):e128432. https://doi. org/10.1172/jci.insight.128432.
Clones of infected cells arise early in
HIV-infected individuals
John M. Coffin,1 David W. Wells,2 Jennifer M. Zerbato,4 Joann D. Kuruc,5 Shuang Guo,2 Brian T. Luke,3 Joseph J. Eron,5 Michael Bale,6 Jonathan Spindler,6 Francesco R. Simonetti,6 Shawn Hill,6
Mary F. Kearney,6 Frank Maldarelli,6 Xiaolin Wu,2 John W. Mellors,4 and Stephen H. Hughes6 1Department of Molecular Biology and Microbiology, Tufts University, Boston, Massachusetts, USA. 2Cancer Research Technology Program, and 3Advanced Biomedical Computational Science, Frederick National Laboratory for Cancer Research, Frederick Maryland, USA. 4Department of Medicine, Division of Infectious Diseases, University of Pittsburgh, Pittsburgh, Pennsylvania, USA. 5Department of Medicine, University of North Carolina, Chapel Hill, North Carolina, USA. 6HIV Dynamics and Replication Program, NCI-Frederick, Frederick, Maryland, USA.
Introduction
Although successful antiretroviral therapy (ART) does not cure HIV infection, it effectively inhibits viral replication, the progressive loss of CD4+ cells, and the development of AIDS in most infected individuals. There is still some debate about whether HIV persists in treated individuals because of low levels of ongoing replication. For example, it has been suggested (1) that there is ongoing replication in treated individuals; however, this paper has been challenged (2, 3). Overall, the weight of the evidence strongly suggests that successful ART completely blocks HIV replication (4–7). The viral reservoir is maintained because viral genomes persist as integrated proviruses in long-lived infected cells. In indi-viduals on long-term ART, most of the integrated proviruses (95%–98%) are defective (8, 9). The intact, infectious proviruses that can rekindle infection in an ART-treated individual are collectively referred to as the HIV reservoir. Despite representing only a small fraction of the total viral DNA load (8, 10), intact proviruses are sufficiently numerous to prevent eradication of the infection in nearly every patient tested to date. The first successful cure involved whole-body irradiation, 2 bone marrow transplants, and transplantation of bone marrow from a homozygous delta32 CCR5 donor naturally resistant to HIV infection (11). More recently, a second individual appears to have been cured through an alloge-neic stem cell transplant from a delta32 CCR5 homozygote donor (12). However, other HIV-infected patients who have undergone allogeneic stem cell transplantation have died or suffered a relapse of their HIV infection, suggesting that the reservoir is large enough that eliminating it completely will be very difficult (13–16). It also appears, based in part on studies done with SIV-infected macaques and the earliest treated HIV-infected humans, that the reservoir is established rapidly (within the first few days following the initial infection) (17–19), and that, after a fairly rapid initial decline following the initia-tion of long-term ART, the size of the reservoir diminishes only very slowly, if at all, over the lifetime of infected individuals (20, 21).
This last result would appear to be at odds with the fact that, in people who are not on ART, most HIV- infected cells live only about a day, due to effects of the viral infection, recognition of infected cells by the host’s immune system, or both (22, 23). However, a fraction of infected cells (including some that carry infectious proviruses) survive long term. We suggest that most of the cells that survive enter a poorly defined state of latency and make little or no viral RNA or protein, allowing them to survive long term (19); however, it has also been suggested that some of cells that carry infectious proviruses are intrinsically resistant to killing by CD8+ cells (24). It is generally thought that a significant fraction of the cells that con-stitute the reservoir are CD4+ T cells, particularly central memory T cells. Because it is the long-lived cells that carry infectious proviruses that constitute the reservoir, it is important to understand how these cells are generated and maintained.
We and others have shown that, in infected individuals on long-term ART, a significant fraction of the HIV-infected cells have expanded into clones that were detected because the integration sites of their pro-viruses are identical (25, 26). Although it has been suggested that only cells that carry defective propro-viruses can clonally expand (27), Simonetti et al. (28) showed that a large clone of cells carrying an infectious pro-virus (called AMBI-1 and estimated to comprise ca. 1 × 10⁷ cells) was present in one patient, and that virus produced by this clone was present at readily detectable levels in his blood (at ca. 150 HIV RNA copies per mL) at multiple time points. Production of low levels of virus from large clones of cells infected with intact infectious proviruses could account for at least some of the reports that there are patients who have low levels of virus in the blood that are not affected by treatment intensification (4, 29, 30). Additional data showing that there are intact proviruses in clonally expanded cells was recently reported by Einkauf et al. (31). These data show that clonally expanded cells can be an important part of the reservoir; however, that raises the question of how such clones are able to survive and expand. Further analysis showed that only a small fraction (2%–3%) of the cells in the AMBI-1 clone were making viral RNA at any one time, implying that only a small fraction of the cells in the clone could have been producing viral protein at any one time (28). In samples taken from other HIV-infected individuals, a similarly small fraction of the cells in clones that carry either obviously defective or apparently intact (and potentially infectious) proviruses express viral RNA (19). These observations suggest that infected clones are able to survive and expand because the majority of cells do not express viral RNA or protein. Because the half-life of productively infected cells is only about 1 day (23), the presence of detectable levels of AMBI-1 virus in the blood of this patient for at least 3 years implies a mechanism by which small numbers of virus-producing cells were constantly being generated from their much more numerous clonal siblings whose proviruses were transcriptionally silent.
Because AMBI-1 is a single clone, found in a single patient, it is not yet clear how many other patients also have similar large clones that carry infectious proviruses. However, several groups (3, 19, 32, 33) used viral outgrowth assays to show that patients on long-term ART commonly contain multiple cells that can produce identical infectious viruses. Although it has not been conclusively demonstrated that the cells that produced the identical viruses clonally expanded from a single infected cell, that is the likely explanation. Thus, we favor the idea that, not only are there infected cells that have clonally expanded in patients, but also that clonally expanded cells make up a significant part (perhaps all) of the reservoir that makes it impossible to cure HIV infection with current ART alone. Clonal expansion of infected cells would explain how the reservoir remains relatively stable for long periods of time. If some of the cells in a clone that carry an infectious provirus die, the dead cells could be replaced by the proliferation of other cells in the clone. In addition, if some clones were to diminish in size during long-term treatment, it is also possible that other clones could increase in size, preserving an approximately constant steady-state level of infectious proviral DNA. It is also likely that the same processes responsible for T cell maintenance and expansion account for most of the clonal expansion and persistence of the infected cells.
RNA and proteins in the blood of an infected individual before there is a detectable immune response, and that, in most cases, the humoral immune response to several of the viral proteins occurs in a particular temporal order (34). There is a brief eclipse period before viral RNA can first be detected in the blood (perhaps a week), and then the first 4 Fiebig stages arise over a period of about a month. Thus, the Fiebig III–IV stages are estimated to be approximately 3 to 4 weeks after the initial infection. Fiebig V lasts from about 4 weeks to about 3 months.
In the present study, we show that clones are formed within the first few weeks after the initial infec-tion, that clonal expansion of infected cells can be detected as early as the end of Fiebig IV/beginning of Fiebig V, and that clones created early in infection can persist for at least 3.7 years of suppressive ART.
Results
Participants and sampling. We analyzed samples from 3 groups of HIV-infected participants who were
diagnosed at various stages of infection (Table 1). The first group (group 1) comprised 7 individuals from the UNC-Duke AHI Cohort/CHAVI project and one from the University of Pittsburgh Acute Infection protocol. Two of the participants were determined to be in Fiebig III, one in Fiebig IV, one on the cusp between Fiebig IV and V, and 3 in Fiebig V at the time of first sampling. The second group (group 2) included 5 participants enrolled in AVBIO1, AVBIO2, and IDFU studies of antiretroviral therapy at NIH who initiated ART somewhat later after the initial infection. Four of these donors were diagnosed in Fiebig V, and one was diagnosed in Fiebig VI. The third group of donors (group 3) was also from the NIH and included 5 individuals who had been infected for long periods of time (up to 14.8 years) before initiating ART. In terms of determining when clones of infected cells can grow large enough for us to detect them, the first 2 groups are the most important; the third group served as a control that allowed us to estimate how much more difficult it was to identify clones when there is a large back-ground of recently infected cells that are present in untreated donors. The donors in the first 2 groups were separated based on the time from infection to when ART was initiated, when the initial samples were obtained, and approximately how long the donors were on ART before the last on-ART sample was obtained. In all 3 groups, plasma and PBMC samples were collected and analyzed to determine
Table 1. Study participant characteristics
Group Patient
identifier Plasma HIV RNA copies/mL at first sampling time point Fiebig stage or years infected at first sample (pre-ART) Duration of suppression on ART at final on ART sample (years) Plasma HIV RNA at final on ART sample (copies/mL)
1
CH 83-1 750,000 III 1.5 <40
CH 84-4 155,000 III 3.2 <40
PIT 001 2,137,000 IV 0.9 <40
CH 62-1 387,000 IV/V 3.7 <40
CH 68-5 134,000 V 3.6 <50
CH 91-4 589,000 V 2.9 <50
CH 98-6 254,000 V 2.8 <40
2
IDFU-192 31,000 V 11.4 <40
IDFU-194 151,000 V 3.6 <50
AVBIO2-14 351,000 V/VI 17.8 <40
AVBIO2-23 143,000 V/VI 16.6 <50
AVBIO2-04 201,000 VI 17.7 <40
3
AVBIO2-21A 382,000 14.8 7.2 828
AVBIO2-08B 33,600 Unknown 16.3 <40
AVBIO2-18C 35,400 6.5 12.2 <50
AVBIO1-102 14,000 4.9 1.76 <50
AVBIO2-03B 83,500 Unknown 19.7 <40
AThis is the same donor identified as patient 3 in Maldarelli et al. (25). BThese 2 donors were diagnosed by a positive HIV ELISA/Western blot 1–3 months
the levels of cell-free HIV RNA and cell-associated HIV DNA both before ART was initiated and after they had been on ART for 2.7–17.8 years. We obtained additional longitudinal samples on ART from some of the donors in group 1.
With one exception, the pre-ART PBMC samples used for integration site analysis, single-genome sequencing (SGS), and viral DNA loads were taken from the group 1 and 2 donors at the same time as Fiebig staging. In the one case, identified as Fiebig IV/V, the sample used for SGS and integration site analysis was taken 2 weeks after an initial sampling identified the individual as being Fiebig IV; thus, this individual could have progressed to early Fiebig V by the time the second sample was taken. In all group 1 participants viremia was fully suppressed on ART, and, with one exception, all were fully suppressed (<50 copies HIV RNA/mL) at the intermediate times as well. On-ART samples were obtained from the group 1 donors at various times from 0.9 to 3.7 years.
Plasma and PBMC samples were obtained from the donors in group 2 at the time of Fiebig staging (with 2 exceptions, denoted as “V/VI” in Table 1, who were sampled about 2 months and 1 month follow-ing stagfollow-ing) and durfollow-ing ART. On average, participants in group 2 had been on ART for a longer period of time than those in group 1 (median 16.6 years at the time of sampling). Group 3 included 5 individuals who had been infected for long periods (up to 14.8 years) before initiating ART. We analyzed samples taken before these individuals initiated ART and after they had been on ART for up to 16.3 years.
The donors in group 1 were, with one exception, well suppressed. Donor CH 083-1 had a brief treat-ment interruption, during which viremia rebounded. In group 2, IDFU-192 had a treattreat-ment interruption, but had been fully suppressed for more than 9 years when the on-ART sample was taken. IDFU-194 had one very small blip early in the treatment period. AVBIO2-04 was poorly controlled early in the course of treatment but was well suppressed for more than 10 years. AVBIO2-14 and AVBIO2-23 had low-level blips early in the course of their treatment but were well suppressed for more than 10 years, and more than 8 years, respectively. In group 3, AVBIO2-08, AVBIO1-18, and AVBIO2-03 each had one minor blip before the on-ART samples were taken. AVBIO1-102 had one blip early in therapy but after that was suppressed below the limit of detection (LOD) until the on-ART sample was taken. However, all of the donors were well suppressed at the times on-ART samples were obtained, except AVBIO2-21, who had HIV RNA of 828 copies/mL when the last on-ART sample was taken.
Levels of viremia and infected cells on ART. Plasma HIV RNA and PBMC HIV DNA levels were measured
in the samples from all donors (Tables 1, 2, and 3). As expected, all donors exhibited a large reduction in the amount of viral RNA (Table 1) and DNA (Tables 2, 3, and 4) on ART. Viral DNA values in the samples taken at the last time point on ART, compared to the pretherapy samples, are summarized in Table 5 and Figure 1A. The decline in viral DNA was greater in the donors treated in early infection than in those treated at later stages (Figure 1A). The total decline of the viral DNA in PBMCs averaged about 360-fold for the Fiebig III donors, about 50- to 70-fold for the Fiebig IV–V donors, and about 11-fold for the chronic donors (Figure 1A and Table 5). However, there were considerable differences in the plasma viral RNA and cellular DNA levels among the individual donors (both before and after ART) with no obvious correlation with Fiebig stage at which the indi-viduals were diagnosed or initiated ART. Nonetheless, in all cases, the decrease in the viral DNA in the group 1 and 2 donors who initiated ART soon after they were infected was significantly greater (paired log ratio test P < 0.001) when compared with the decrease in viral DNA load in the donors who initiated ART during chronic infection (group 3, see Table 5), as has been reported previously (17, 35, 36).
No evidence of HIV replication in the donors on ART. The decline in plasma viral RNA levels on ART to
of proviruses present in all of the Fiebig III–V donors we tested were nearly homogeneous, as expected, providing no evidence of evolution in the sequences of the HIV proviruses in the 5 individuals in group 1 who were on ART continuously for periods of 2.8 to 3.7 years. This result implies that, if there was any viral replication in these individuals while they were on ART, it must have either been at a very low level or it occurred only in sites that did not communicate with the blood.
Clonal expansion of HIV-infected cells. We used the methods described in Maldarelli et al. (25) to determine
and analyze the sites of proviral DNA integration in PBMC samples taken from the donors both before ART and on ART. As expected, there was a correlation between the viral DNA copy number and the number of integration sites we recovered (Tables 2 and 3 and Supplemental Figure 1; R2 = 0.8; supplemental material available online with this article; https://doi.org/10.1172/jci.insight.128432DS1). We were particularly inter-ested in determining how soon after infection clonal expansion of HIV-infected cells could be detected in sam-ples taken before ART was initiated. In the integration site assay, clonal expansion is measured by the number of different DNA breakpoints associated with specific integration sites (38). However, as explained more fully in the Discussion, there are important differences in the way we interpreted the breakpoint data from samples obtained from pre-ART and on-ART donors. In an untreated individual, integrated viral DNA can be either in recently infected cells that are producing viral proteins and are destined to die within a few days, or in cells that carry highly defective or latent proviruses, most of which do not express viral proteins (22). Some of the latter cells can survive and divide for many years (35, 39). Therefore, in samples taken from untreated individuals, much of the viral DNA is in newly infected cells, which create a background that makes it more difficult to use integration site analysis to detect clonally expanded cells. Because HIV preferentially infects dividing cells, there are likely to be infected cells present that have replicated their DNA (including integrated viral DNA) but have not yet divided and are destined to die soon. In an individual who has been on therapy for years, most pro-virus-containing cells that are dividing are not making viral RNA (19). The dividing cells that are not making viral RNA are not about to die and are almost certainly members of a clone. As a consequence, if we recover the same end of a provirus from an on-ART sample with 2 (or more) different-sized host DNA fragments (2 or more breakpoints), we can safely conclude that the integration site is in a clone. In contrast, in samples taken from untreated donors, although integration sites with 2 breakpoints may have come from a clone, we cannot
Table 2. Pre-ART cell-associated HIV DNA, integration sites, and clones in PBMCs from the donors put on ART shortly after infection (groups 1 and 2)
Group Stage (PID) HIV DNAA Cells (×106) used for
ISA Unique integration sites Sites with >1 breakpoint Clones confirmed
1a
FIII (CH 83-1) 50,000 3 1,409 1 0
FIII (CH 84-4) 1,700 1.5 176 2 0
FIV PIT-001 14,000 1.5 149 1 0
Average per 106 cells 22,000 290 0.67 0
SD FIII–IV 25,000 210 0.51 0
1b
FIV/V (CH 62-1) 18,000 4.5 709 14 9
FV (CH 68-5) 5,600 1.5 366 1 0
FV (CH 91-4) 4,800 4.5 416 3 1
FV (CH 98-6) 1,900 3 179 2 2
Average per 106 cells 7,600 120 1.5 0.87
SD FIV/V–V 7,100 42 1.2 0.9
2
FV (IDFU-192) 17,000 1.5 409 3 0
FV (JRI) 1,500 3 193 1 1
FV/VI (AVBIO2-14) 4,300 1.5 144 0 0
FV/VI (AVBIO2-23) 21,000 1.5 405 3 0
FVI (AVBIO2-07) 2,100 1.5 48 0 0
Average per 106 cells 9,200 130 0.89 0.11
SD 9,100 120 0.94 0.15
safely conclude that we have identified a clone unless we isolate the same integration site with 3 or more break-points, or from at least 2 independently analyzed samples taken from the same individual. Thus, the integration site data, and the clone counts, will not be strictly comparable in samples taken from pre-ART and on-ART donors, and for that reason, the pre-ART and the on-ART data for groups 1 and 2 are presented in different tables. Because some or all of the integration sites with 2 breakpoints obtained from samples from untreated donors may not derive from clones of infected cells, such data are presented in Tables 2–5 as “integration sites with more than one breakpoint” and in Figure 1C by green circles.
For comparison to the early infection samples, we analyzed the integration sites from 5 individuals who had been infected for long periods of time (up to 14.8 years) before initiating ART (group 3, Table 4). We obtained integration sites from samples taken before these individuals initiated ART and after they had been on ART for up to 16.3 years.
Table 2 shows the pre-ART integration site data from the donors in groups 1 and 2. We were able to confirm the presence of infected cells that had clonally expanded in some, but not all, of the pre-ART samples from group 1. Clones were identified in 3 of the 4 pre-ART samples from the Fiebig IV/V and V donors. There were a number of integration sites with 2 breakpoints in samples from the 3 Fiebig III and IV donors; however, we did not detect any confirmed clones in these samples. Although the number of clones we identified in the group 1 pre-ART samples was small, there was a statistically significant differ-ence (P = 0.0002) in the frequency of confirmed clones between the Fiebig III–IV and IV/V–VI donors; the frequency of sites with 1 or more breakpoints was not significantly different among the groups (Table 5 and Figure 1C; compare green circles to purple circles). The data are consistent with there being an inter-val of approximately 4 weeks between the initial infection and the most rapidly expanding clones reaching a size that we can unambiguously detect.
In addition to 1 pre-ART and 1 on-ART PBMC sample, we obtained 1 or 2 intermediate on-ART PBMC samples from all but one of the infected individuals in group 1 (Table 2, Supplemental Table 1A, and Sup-plemental Table 2). The intermediate and final on-ART data were combined for all subsequent analyses. As
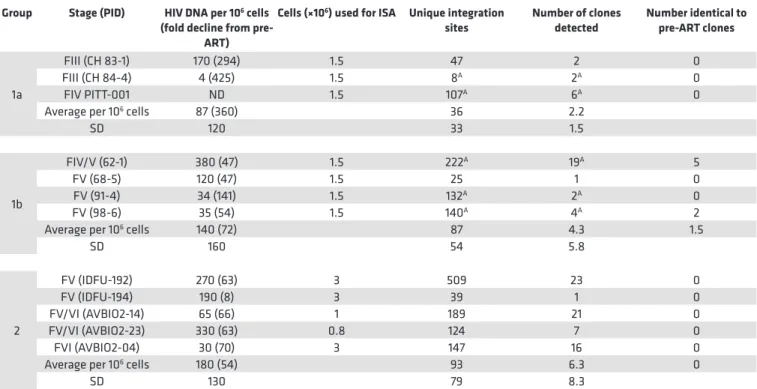
Table 3. On-ART cell-associated HIV DNA, integration sites, and clones in PBMCs from the donors put on ART shortly after infection (groups 1 and 2)A
Group Stage (PID) HIV DNA per 106 cells
(fold decline from pre-ART)
Cells (×106) used for ISA Unique integration
sites Number of clones detected Number identical to pre-ART clones
1a
FIII (CH 83-1) 170 (294) 1.5 47 2 0
FIII (CH 84-4) 4 (425) 1.5 8A 2A 0
FIV PITT-001 ND 1.5 107A 6A 0
Average per 106 cells 87 (360) 36 2.2
SD 120 33 1.5
1b
FIV/V (62-1) 380 (47) 1.5 222A 19A 5
FV (68-5) 120 (47) 1.5 25 1 0
FV (91-4) 34 (141) 1.5 132A 2A 0
FV (98-6) 35 (54) 1.5 140A 4A 2
Average per 106 cells 140 (72) 87 4.3 1.5
SD 160 54 5.8
2
FV (IDFU-192) 270 (63) 3 509 23 0
FV (IDFU-194) 190 (8) 3 39 1 0
FV/VI (AVBIO2-14) 65 (66) 1 189 21 0
FV/VI (AVBIO2-23) 330 (63) 0.8 124 7 0
FVI (AVBIO2-04) 30 (70) 3 147 16 0
Average per 106 cells 180 (54) 93 6.3 0
SD 130 79 8.3
AIncludes data from 1 or 2 intermediate on-ART time points. A list of the clones detected at the intermediate time points is given in Supplemental Table 2.
noted earlier, the viral DNA levels were much lower in the on-ART samples, reflecting the loss of most of the recently infected cells, and, as a consequence, we obtained fewer integration sites. Despite having fewer integration sites from the on-ART than the pre-ART samples, the fraction of the integration sites that were shown to be in clones was significantly higher in the on-ART than in the pre-ART samples (P < 0.001; Table 5), independent of the Fiebig stage at which ART was initiated. Notably, the fraction of integration sites that were shown to be in clones (ca. 0.1) was not significantly different for the on-ART samples from the Fiebig III individuals compared to the samples from all the later groups (Figure 1C, orange squares; P > 0.6). This result is consistent with the conclusion that, although the time between infection and acquisition of the pre-ART sample in the Fiebig III–IV individuals was apparently too short for the clones to grow large enough to be unambiguously detected, small clones were present and continued to grow after the initiation of ART blocked viral replication. This idea is strongly supported by the fact that a number of the clones that were detected in the pre-ART samples taken from the Fiebig IV/V–V individuals were also detected in samples taken at later time points (Table 2, last column, and Supplemental Table 1). This result shows that PBMCs infected in the first few weeks of infection can form clones rapidly and that some of the clones that arise early can persist for years.
Broadly speaking, the group 2 pre-ART samples had a lower level of viral DNA and we did not recover as many integration sites from the group 2 pre-ART samples as we did from the group 1 pre-ART samples (Table 2). However, probably because the numbers of integration sites we recovered was small, the difference in the number of recovered integration sites was not statistically significant (P > 0.2). We analyzed samples from 4 of the group 2 individuals that were taken after they had been on suppressive ART for periods up to 17.8 years. Despite having relatively few integration sites from one of the on-ART samples, we identified clones of infected cells from the on-ART samples from all 5 of the group 2 donors (Table 3). As was the case with the clonally expanded infected cells from group 1, these clones appear to have arisen from cells that were infected early and expanded until they became large enough that they were detected in on-ART samples collected years later. Unlike the infected clones in the Fiebig IV/V–V donors in group 1, none of the clones from the group 2 donors were detected in both the pre-ART and on-ART PBMCs, which likely reflects the small numbers of integration sites obtained.
In contrast to the acutely infected individuals (groups 1 and 2) in whom some of the clones of infected cells may have been expanding when the pre-ART samples were collected, in the individuals who had been infected for several years prior to ART initiation (group 3), most of the clones of infected cells were probably not still expanding rapidly. The fraction of the integration sites in clones, relative to the total number of integration sites recovered in the pre-ART samples (0.87%), was similar to the pre-ART samples from Fiebig IV/V–V (group 1b, 1.2%, P = 0.32) and somewhat greater than Fiebig V–VI (group 2, 0.07%, P = 0.014). Despite considerable patient-to-patient variation and the small num-ber of clones identified, this similarity suggests that a numnum-ber of the infected cells destined to expand
Table 4. Cell-associated HIV DNA, integration sites, and clones in PBMCs from chronically infected patients
PID Pre-ART Samples Final On-ART Samples
HIV DNA per
106 cells Cells (×10 6)
used for ISA integration Unique sites
Sites with >1
breakpoint Confirmed clones per 10HIV DNA 6 cells (fold decline from
pre-ART)
Cells (×106)
used for ISA integration Unique sites
Clones
detected identical to Clones pre-ART
AVBIO2-21 1800 1.5 97 3 2 190 (9.5) 1.5 178A 11A 2
AVBIO2-08 3000 0.9 78 0 1 184 (16) 1.5 28 1 1
AVBIO2-18 5700 1.5 167 1 0 249 (23) 1.5 117B 16B 0
AVBIO1-102 810 1.5 46 0 0 311 (2.6) 1.5 28 1 0
AVBIO2-03 5700 1.5 66 0 0 926 (6.2) 1.5 129 9 0
Average per
106 cells 3402 66 0.6 0.5 372 (11) 1.5 64 5.1
SD 2237 32 1.1 0.7 310 44 4.4
into clones large enough to be detectable had already been infected, and the clones had already begun to expand, very soon after the initial infection. Moreover, the fraction of cells that were detected as being in clones in the on-ART samples from the individuals who started ART during chronic infection (8%) was similar to the fraction in clones in the on-ART samples in the 2 groups of participants who initiated ART much sooner (all around 6%) (P > 0.09; Table 5). These data strongly suggest that the large difference in the frequency at which clones were detected in the samples taken before ART and on ART is due to the presence in the pre-ART samples of large numbers of short-lived, recently infected cells. In pre-ART samples, the majority of the proviruses are in recently infected cells, which, as was noted earlier, creates a background that makes it more difficult to detect clones using integration site analysis. However, we did see clonally expanded cells in the pre-ART samples from 2 of the individuals who initiated treatment in chronic infection. All 3 of the clones that were detected before ART were also detected in the on-ART sample from the same donor. This observation is similar to what was observed in group 1, where 7 of the 11 clones identified in pre-ART samples from the Fiebig IV/V–V patients were also found in the on-ART samples (Supplemental Table 1). The similarity in the frequency at which clones were detected in the Fiebig IV/V–V samples and in the samples taken at later stages implies that the distribution in the sizes of the infected clones has reached approximately its final value in the first few months after infection.
Discussion
We and others have proposed that clonal expansion of HIV-infected cells plays an important role in the gener-ation and maintenance of the reservoir that has made it impossible to cure HIV infection with ART alone. Nor will it be possible to eliminate the reservoir with any combination of antiretrovirals that suppress HIV replication by blocking new cycles of replication because this type of therapy has no effect on cells that are already infected (25, 26). In some cases, clonally expanded cells can produce infectious virus and release it into the blood at levels that can readily be detected (28, 31). The goal of the present study was to better understand the formation and persistence of clones of infected cells after initial infection. We have obtained similar results in an SIV-macaque model of HIV persistence (40); i.e., clones of SIV-infected cells appear within a few weeks of infection, some of which persist and expand for at least a year of suppressive ART. The similarity of these results and of the distri-bution of HIV integration sites in human cells and SIV integration sites in both macaque and human cells shows that the SIV/macaque model can be used in further studies of HIV clonal expansion and persistence.
We analyzed the integration sites in PBMC DNA in 2 groups of HIV-infected donors who initiated ART early after infection, ranging from Fiebig III–VI (ca. 20 days to several months) and compared the results with a group of donors who had been infected for years prior to initiating ART. Our results are summarized for the participants treated at different stages in Table 5, and graphically in Figure 1. We show
Table 5. Summary of all results
Pre-ART (per 106 cells) On ART (per 106 cells)
Fiebig stage (number of
donors)
Weeks since
infection Viral DNA copies integration Unique sites
Sites with >1 breakpoint (percentage of total integrants) Clones (percentage of total integrants) Viral DNA copies (fold decline from pretherapy) Unique integration sites Clones (percentage of total integrants)
FIII–IV (3) ~20–30 22,000 ±
25,000 289 ± 209 0.67 (0.23)
A ±
0.51 0 (<.058)
B,C 87 (360) ± 120 36 ± 33 2.2 (6.2)C,D ± 1.5
FIV/V–V (4) ~30–100 7,600 ± 7,100 124 ± 42 1.5 (1.2)A,E ± 1.2 0.89 (0.72)B,F ±
0.90 140 (72) ± 164 87 ± 54 5.5 (6.4)
C,D ± 7.2
FV/VI–VI (4) ~100–180 9,200 ± 9,100 132 ± 115 0.89 (0.67)E ±
0.94 0.11 (0.084)
C,G
± 0.15 180 (54) ± 130 94 ± 78 6.2 (6.6)
C,D ± 8.3
Chronic (5) > ~700 3400 ± 2200 665 ± 32 0.43 (0.88)E
± 1.1 0.56 (0.66)
C,F,G
± 0.67 370 (11) ± 310 64 ± 32 5.1 (7.9)
C,D ± 4.4
that clones of infected cells can arise soon after HIV is acquired, and that, in a period of about 4 weeks, can grow large enough for us to detect (estimated to be >1 × 10⁵ cells). Some of the clones that were detected in the first few weeks persisted for years in infected individuals (Supplemental Table 1).
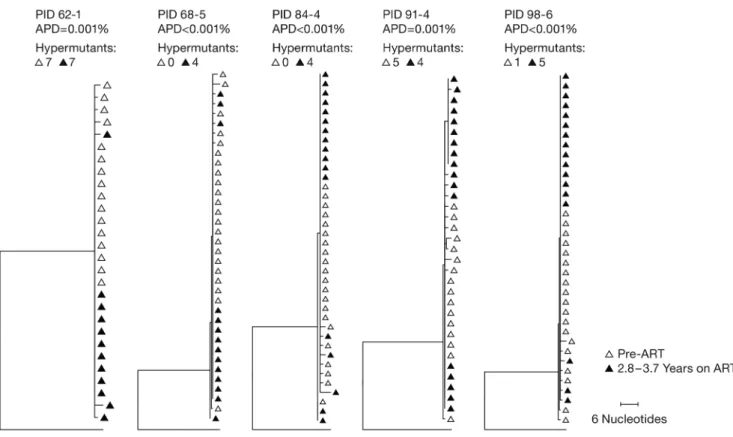
To test whether there was significant ongoing viral replication during ART treatment, which would mean that some of the integrated DNA in the on-ART samples could have been from newly infected cells, we asked if there was any evidence of viral evolution in a subset of the donors in group 1. We used SGS to compare the pre-ART viral DNA sequences in PBMCs from 5 of the group 1 participants who did not have any treatment interruptions (Fiebig III to V) with samples taken after approximately 3–4 years of suppressive ART (Figure 2). The extremely low diversity of the viral DNA implied that all donors were initially infected with a single founder virus, which is the case in about 80% of infections (4, 37). Further, there was no measurable divergence in the viral sequences during the period of sup-pression, consistent with our previous findings for children treated early in life (7), which shows there was very little or no viral replication on ART. Thus, the reservoir is generated and sustained by the clonal expansion and long-term survival of cells that were infected before ART was initiated. Because ART was initiated early in these donors, some or all of the cells that gave rise to the clones must have
Figure 1. Summary of the results for all of the donors in Tables 2–5. (A and B) The plots show the individual pre-ART
been infected either during, or very shortly after, the eclipse period following viral transmission. This conclusion is strongly supported by the observation that some of the clones of infected cells detected in the pre-ART samples were also detected after several years of suppressive ART (Supplemental Table 1).
As can be seen in Figure 1A, there was a significant reduction in the amount of total viral DNA in the on-ART samples compared to the pre-ART samples. The viral load dropped about 100-fold in the participants who initiated therapy during Fiebig III–IV, about 10-fold in the participants who initiated therapy during chronic infection, and by intermediate amounts in the Fiebig IV/V–VI donors. These data are consistent with prior reports based on a larger number of samples (17, 35, 36), and reflect a reduction in the proportion of the total viral DNA present in recently infected, short-lived cells compared with the viral DNA in long-lived cells, which are generated less frequently and accumulate more slowly. As expected, there was a correlation between the amount of viral DNA present in the various samples and our ability to recover integration sites (Supplemental Figure 1). As shown in Figure 1C, we were not able to unambigu-ously identify expanded clones of infected cells (<0.2% of total proviruses) in pre-ART samples taken from participants initially tested at Fiebig stage III or IV, but the fraction of infected cells that was confirmed to be in clones was approximately the same (about 1% of the total integration sites) in the pre-ART samples taken at all stages after Fiebig IV. However, in all of the samples taken after a year or more of suppressive ART, including the samples from individuals who initiated therapy in Fiebig III–IV, approximately the same fraction of infected cells was found in clones (ca. 5%–10%). This fraction is lower than what we reported in Maldarelli et al. (25) (about 40%) because, generally speaking, we analyzed fewer integration sites from the on-ART samples we report here, and our ability to detect clones depends on the number of integration sites we obtain from a sample. This result implies that cells that were infected at any time, rel-ative to the initial infection of the host, have approximately the same potential for clonal expansion. The only difference is that, before early Fiebig V (approximately 4 weeks), infected clones do not have enough time to expand to a size large enough for us to determine unambiguously that they have clonally expanded.
Figure 2. Neighbor-joining trees of P6-PR-RT single-genome sequences. Single proviral sequences were obtained from pre-ART and on-ART PBMCs
It would take approximately 16–17 cell divisions for a clone to grow to a size we can expect to detect (ca. 1 × 10⁵ cells). The doubling time of activated CD4+ T cells in HIV-infected humans is not known. If the dou-bling time is approximately 1 day, it takes a little over 2 weeks for an infected cell to grow to a size we could detect. If the doubling time is 11 hours, as calculated in mice infected with lymphocytic choriomeningitis virus (LCMV) (41), then clones could grow to visible size in a little over 1 week. This result is consistent with data that show that the reservoir is formed very early in both HIV-infected humans and SIV-infected macaques (17, 18, 42).
In an untreated individual, integrated viral DNA can be either in recently infected cells that express viral proteins and are destined to die within 1 or 2 days, or in cells that carry defective or latent proviruses that may not express viral proteins. Some of those cells can survive and divide for many years. As our results show, the relative numbers of the different types of infected cells change with time, both off and on ART, as the numbers of new productively infected cells increase or decline. Cells with latent and defective proviruses accumulate by division as well as by new infection. In samples taken from untreated individuals, much of the viral DNA is in newly infected cells, creating a background that makes it more difficult to use integration site analysis to detect clonally expanded infected cells. Furthermore, although some of the proviruses detected by our assay with 2 breakpoints may be from clones of infected cells, they may also be from single cells that have replicated their DNA but not yet divided. HIV encodes a protein, Vpr, that specifically causes cell cycle arrest in the G2 stage. In cells infected in culture, Vpr leads to the accumulation of cells with 4n DNA content (22). Although the extent of the G2 block and how long any G2-blocked cells survive in infected individuals are unclear, there is a real possibility that there could be newly infected cells that have replicated their DNA, including a newly integrated provirus, that will not go on to make clones in untreated individuals.
In contrast, if there are cells that have replicated their viral DNA in an individual who has been on ART for years, those cells are almost certainly members of a clone. As a consequence, in on-ART samples, if we recover the same end of a provirus 2 (or more) times, with different lengths of appended host DNA (2 or more different breakpoints), we can safely conclude that the integration site is from a clone. For that reason, in pre-ART samples, we only counted integration sites as coming from a clone if we isolated the integration site 3 or more times, or if an integration site that was found in a pre-ART sample was also present in at least one other sample taken from the same individual. Thus, the integration site data, and the clone counts, are not strictly comparable in samples taken from pre-ART and on-ART donors, and for that reason the pre-ART data and the on-ART data are presented in different tables and the proportions of integration sites with more than 1 breakpoint are shown by open bars in Figure 1C.
Using these strict rules, in pre-ART samples taken from donors at FIV/V or later, we were able to identify integration sites in clonally expanded cells. In contrast, none of the integration sites with 2 breakpoints in the samples taken at earlier Fiebig stages could be confirmed as being in clones. Given the small size of the samples assayed (ca. 1–5 million cells) relative to the total estimated number of CD4+ T cells (ca. 5 × 10¹²) in the whole body, we can expect to reliably detect infected clones only after they have grown larger than 1 × 10⁵ cells (see Methods). Using what is the shortest estimated doubling time for CD4+ T cells in viral infection (about 11 hours), based on analyses of mice infected with LCMV (41), it would take an infected cell about 1 week to reach this size. Although additional analysis, involving more donors and samples taken at different time points, will be required to deter-mine if there are rare, large clones of infected cells that arise earlier, we do know that there are some large clones present about 1 month after the initial infection, and that some of the clones that arise early can persist for years.
Second, eliminating the reservoir is not a problem of blocking viral replication, but is rather a problem of eliminating all the infected cells that carry infectious proviruses, at least some of which have clonally expanded. It is likely that the forces which drove the clonal expansion in the first place will still be present following the administration of a curative therapy, such as “kick and kill” (44). Even if a strategy is found that activates the expression of all of the infectious proviruses in the cells of a particular clone, leading to the elimination of that clone, it is not clear that such a strategy would be able to successfully activate all of the infectious proviruses that are in all of the different clones of expanded cells. The observation that the predominant virus that arises following ex vivo activation of latently infected cells is often genetically distinct from that which rebounds following ART interrup-tion (45) implies that we still have much to learn about the regulainterrup-tion of expression in vivo before such a strategy can be put into place.
Finally, our data point to the magnitude of the problem of eliminating all the intact, infectious proviruses that comprise the HIV reservoir. On average, infected individuals on suppressive ART have been reported to have about 1 provirus per 2,000 PBMCs (35). Our results, based on both the viral DNA level and the integration site data, are similar, corresponding to about 10 million proviruses in the blood and about half a billion proviruses in the whole body. Although most of these proviruses are defective, current estimates suggest that, in those on long-term ART, the intact, infectious proviruses represent a few percent of the total (9). This calculation suggests that an infected individual whose HIV replication is fully suppressed contains approximately 10 million cells that carry intact infectious proviruses, most likely distributed over hundreds to thousands of clones. The fact that we have previously identified a single clone of about 10 million cells that carries an infectious provirus (28) suggests that, in at least some individuals, the reservoir could be larger. Every cell that carries a fully intact provirus has the potential to release infectious virus that could rekindle the infection. Although it has been possible to eliminate large masses of tumor tissue with immunotherapy, the tumor cells that respond to immuno-therapy express antigens that make it possible to target them (44). If, as appears to be the case, most of the HIV-infected cells that carry intact proviruses do not express viral RNA or proteins, eliminating the HIV-infected cells that carry fully intact proviruses will require a strategy that activates the expression of the proviruses in all, or almost all, of the cells that carry latent infectious proviruses or an alternative strategy that prevents any expressed virus from rekindling a systemic infection.
Methods
Donor samples. Cryopreserved PBMCs were obtained from several sources: individuals enrolled in the
UNC-Duke Acute HIV Treatment Cohort and CHAVI-001 at University of North Carolina, Chapel Hill; individuals enrolled in the Acute HIV Infection study at the University of Pittsburgh (protocol 15120105); and individuals participating in AVBIO1 and AVBIO2, studies of the effects of ART in HIV-infected adults (NIH protocol 97-I-0082, 08-I-0221), as well as IDFU, a natural history study of HIV-infected individuals undergoing ART (NIH protocol 95-I-0072).All participants gave informed written consent to allow samples to be used for additional research. All studies were approved by the respective Institutional Review Boards (University of North Carolina: IRB and the Office of Human Research Ethics, University of North Carolina at Chapel Hill; FWA 00004801, expiration 10/15/2023. NIH: National Institute of Allergy and Infectious Diseases IRB located at the NIH Clinical Center, Bethesda, Maryland, USA; FWA 00005897, expiration 7/16/2023. University of Pittsburgh: IRB at the University of Pittsburgh Common-wealth System of Higher Education; FWA00006790, expiration 7/1/2020).
Fiebig staging. The Fiebig stage of the donors was established using standard methods for plasma HIV
RNA detection, soluble plasma p24 detection, screening using EIA for HIV antibodies (third or fourth generation tests), and Western blot as described by Fiebig et al. (34).
Quantification of plasma HIV-1 RNA. Plasma HIV-1 RNA measurements were performed using the
FDA-approved Abbott HIV Real-time Assay on the M2000 instrument (LOD 40 copies/mL plasma), version 2 Quantiplex HIV RNA bDNA version 2 (LOD 500 copy/mL plasma), version 3 Quantiplex HIV RNA bDNA (LOD 50 copies/mL plasma), or Roche HIV Monitor ultrasensitive version 1.5 (LOD 50 copies/mL).
Measurements of HIV DNA. Total HIV-1 DNA in PBMCs was quantified as previously reported (46).
Briefly, total nucleic acid was isolated from 2.5 million PBMCs using proteinase K/guanidinium HCl/ guanidinium thiocyanate lysis and isopropanol precipitation. The amplification target is in the 3′ end of
DNA standards. Seven hundred nanograms of DNA was used for each qPCR reaction. The number of cell equivalents was estimated by qPCR amplification of CCR5 according to a published protocol (47) and was used to normalize the levels of HIV-1 DNA.
Single-genome sequencing. SGS was performed on the P6-PR-RT region of the genome as previously described
(4, 48). PBMC DNA was extracted using the methods described in Van Zyl et al. (7). Clustal W alignments and neighbor-joining phylogenetic analyses were performed using MEGA 6 (https://www.megasoftware.net/).
Integration site assay. Integration site analysis was performed as previously described (25). Briefly,
DNA was isolated from PBMCs of infected donors. Genomic DNA was fragmented by random shearing into 300- to 500-bp fragments. Linker-mediated nested PCR was performed to amplify the human and linked HIV sequences from both the 5′ and 3′ LTRs. Paired-end sequencing was carried out using the MiSeq 2 × 150 bp paired-end kit (Illumina). The sequences of the host-virus junctions and the host DNA breakpoints were determined. The host DNA sequences were then mapped to human genome (hg19) using BLAT. A stringent filter for mispriming and other possible artifacts was included in the pipeline used to check quality of recovered integration sites.
Identifying clones of infected cells in pre-ART samples. Most of the previous analysis of the clonal expansion
of HIV-infected cells involved the analysis of samples taken from individuals who had been on successful ART for years. In samples taken from donors who were on long-term ART, when we obtained exactly the same integration site twice (with different breakpoints), it was taken as evidence that the cells had clonally expanded. This conclusion followed from the absence, in the donors we were studying (who were on suc-cessful ART), of newly infected cells. It is formally possible that there were, in some of the samples from individuals on ART, single infected cells in S, G2, or M that contained 2 copies of a provirus that was present only once when the cells were in G1. However, if there are any infected cells that are dividing after years of successful ART, it is quite likely that these cells are part of a clone. The situation is different in an untreated HIV-infected human, in which there are large numbers of newly infected cells that will live only for 1 or 2 days. HIV preferentially infects activated T cells. It is likely that some of the newly infected cells will repli-cate their DNA but die before they can divide, much less form a clone. As such, finding the same integration site twice in a single sample from an untreated donor is not sufficient to determine that the infected cell was part of an expanded clone. We use 2 criteria to identify clones in samples taken from untreated humans: (a) the integration site was isolated 3 or more times in a single integration site assay (with different breakpoints); and (b) the integration site was seen in 2 (or more) independent assays, either done with cells taken at the same time, or at different times, either before, or after, the initiation of ART. For samples taken from donors on ART, the isolation of the same integration site twice is still considered to be evidence that there is an infected clone of cells in the sample.
Calculation of the likelihood of detecting a clone by integration site analysis relative to the number of cells in the clone in the patient. On average, an HIV-infected individual on therapy has about 1 provirus per 1,000
CD4+ T cells. Given a total of about 1 × 10¹⁰ CD4+ T cells in blood, and nearly 1 × 10¹² cells in the whole body, this implies that there are roughly 1 × 10⁹ infected cells if the CD4+ T cell count is near normal, and substantially less if the count is lower. Some of the infected cells will have clonally expanded and the cells in each infected clone will have a provirus with an identical integration site. We want to know the probability, if we sample the population N times, that we can detect a clone of a particular size. We per-formed a calculation based on the suppositions that we obtained a total of 100 integration sites, 500 sites, 1,000 sites, etc., from an infected individual. Given a population of 1 × 10⁸ total cells, if we start with the case in which we obtained 1,000 integration sites, and if we have a clone that comprises 1 × 10⁵ cells, the expected number of times we would obtain the integration site for the clone would be 1. To detect a clone in a patient on ART, we need to see the integration site for the clone of interest at least twice. We can use the Poisson distribution to get the probability of obtaining the same integration site 2 (or more) times. The probability is the sum of the Poisson values (based on an average of 1) for which the number of positives was greater than or equal to 2, or, more simply, 1 minus the sum of the Poisson expectations for 0 and 1 (Supplemental Table 3).
Statistics. In the comparisons between different groups of individuals of the number of identified clones
(such as in R) have converted this to a 2-tailed test based on the probability that the odds ratio is 1 (50). Therefore, all P values presented here are 2-tailed values, with one exception. When the difference between the fractions of clones before ART and on ART were compared for a single group, it was clear that the fraction was higher on ART. Therefore, the significance of this difference was determined using a 1-tailed binomial test. All statistical analyses were preformed either on an isolated single group or pair of groups. Because each group, or each pair of groups, was examined independently, no correction for multiple comparisons was used. We determined whether each specific difference was significant, not whether any difference was significant.
Author contributions
JMC, MFK, FM, XW, JWM, and SHH planned the experiments. JDK recruited patients, and performed data management, sample collection and distribution. The experiments were performed by DWW, JMZ, SG, JS, FRS, and SH. JMC, MFK, FM, XW, JWM, SHH, JJE, MB, and BTL analyzed the data. JMC and SHH wrote the manuscript, with help from JWM, XW, FM, MFK, JJE, FRS, JDK, and JMZ.
Acknowledgments
The authors would like to thank Teresa Burdette for help in preparing the manuscript, and Allen Kane for help with the figures. This research was supported by the Intramural Research Programs of the NIH, National Cancer Institute. JMC was a Research Professor of the American Cancer Society and was sup-ported by the NCI through a Leidos subcontract, l3XS110. JWM was supsup-ported by the NCI through a Leidos subcontract, 12XS547. This project has been funded in whole or in part with federal funds from the National Cancer Institute, NIH, under contract no. HHSN261200800001E. The University of North Carolina CHAVI cohort was supported by research grant UM1AI100645 from the NIH and the Center for AIDS Research (grant P30 AI50410). The content of this publication does not necessarily reflect the views or policies of the Department of Health and Human Services or the NIH, nor does mention of trade names, commercial products, or organizations imply endorsement by the US government.
Address correspondence to: Stephen H. Hughes, 1050 Boyles Street, 539/130A; Frederick, Maryland, 21702, USA. Phone: 301.846.1619; Email: [email protected].
1. Lorenzo-Redondo R, et al. Persistent HIV-1 replication maintains the tissue reservoir during therapy. Nature. 2016;530(7588):51–56.
2. Kearney MF, et al. Ongoing HIV replication during ART reconsidered. Open Forum Infect Dis. 2017;4(3):ofx173.
3. Hosmane NN, et al. Proliferation of latently infected CD4(+) T cells carrying replication-competent HIV-1: Potential role in latent reservoir dynamics. J Exp Med. 2017;214(4):959–972.
4. Dinoso JB, et al. Treatment intensification does not reduce residual HIV-1 viremia in patients on highly active antiretroviral therapy. Proc Natl Acad Sci U S A. 2009;106(23):9403–9408.
5. Kearney MF, et al. Well-mixed plasma and tissue viral populations in RT-SHIV-infected macaques implies a lack of viral repli-cation in the tissues during antiretroviral therapy. Retrovirology. 2015;12:93.
6. Kearney MF, et al. Lack of detectable HIV-1 molecular evolution during suppressive antiretroviral therapy. PLoS pathogens. 2014;10(3):e1004010.
7. Van Zyl GU, et al. No evidence of HIV replication in children on antiretroviral therapy. J Clin Invest. 2017;127(10):3827–3834. 8. Ananworanich J, et al. A novel acute HIV infection staging system based on 4th generation immunoassay. Retrovirology.
2013;10:56.
9. Bruner KM, et al. Defective proviruses rapidly accumulate during acute HIV-1 infection. Nat Med. 2016;22(9):1043–1049. 10. Spina CA, et al. An in-depth comparison of latent HIV-1 reactivation in multiple cell model systems and resting CD4+ T cells
from aviremic patients. PLoS Pathog. 2013;9(12):e1003834.
11. Hutter G, et al. Long-term control of HIV by CCR5 delta32/delta32 stem-cell transplantation. N Engl J Med. 2009;360(7):692–698. 12. Gupta RK, et al. HIV-1 remission following CCR5Δ32/Δ32 haematopoietic stem-cell transplantation. Nature.
2019;568(7751):244–248.
13. Henrich TJ, et al. Antiretroviral-free HIV-1 remission and viral rebound after allogeneic stem cell transplantation: report of 2 cases. Ann Intern Med. 2014;161(5):319–327.
14. Hutter G. More on shift of HIV tropism in stem-cell transplantation with CCR5 delta32/delta32 mutation. N Engl J Med. 2014;371(25):2437–2438.
15. Verheyen J, et al. Rapid rebound of a preexisting CXCR4-tropic human immunodeficiency virus variant after allogeneic trans-plantation with CCR5 Δ32 homozygous stem cells. Clin Infect Dis. 2019;68(4):684–687.
infection: An observational study. PLoS Med. 2017;14(11):e1002417.
18. Whitney JB, et al. Rapid seeding of the viral reservoir prior to SIV viraemia in rhesus monkeys. Nature. 2014;512(7512):74–77. 19. Bui JK, et al. Proviruses with identical sequences comprise a large fraction of the replication-competent HIV reservoir. PLoS
Pathog. 2017;13(3):e1006283.
20. Crooks AM, et al. Precise quantitation of the latent HIV-1 reservoir: Implications for eradication strategies. J Infect Dis. 2015;212(9):1361–1365.
21. Finzi D, et al. Latent infection of CD4+ T cells provides a mechanism for lifelong persistence of HIV-1, even in patients on
effective combination therapy. Nat Med. 1999;5(5):512–517.
22. Coffin JM. HIV population dynamics in vivo: implications for genetic variation, pathogenesis, and therapy. Science. 1995;267(5197):483–489.
23. Perelson AS, Neumann AU, Markowitz M, Leonard JM, Ho DD. HIV-1 dynamics in vivo: virion clearance rate, infected cell life-span, and viral generation time. Science. 1996;271(5255):1582–1586.
24. Huang SH, et al. Latent HIV reservoirs exhibit inherent resistance to elimination by CD8+ T cells. J Clin Invest. 2018;128(2):876–889.
25. Maldarelli F, et al. HIV latency. Specific HIV integration sites are linked to clonal expansion and persistence of infected cells.
Science. 2014;345(6193):179–183.
26. Wagner TA, et al. HIV latency. Proliferation of cells with HIV integrated into cancer genes contributes to persistent infection.
Science. 2014;345(6196):570–573.
27. Cohn LB, et al. HIV-1 integration landscape during latent and active infection. Cell. 2015;160(3):420–432. 28. Simonetti FR, et al. Clonally expanded CD4+ T cells can produce infectious HIV-1 in vivo. Proc Natl Acad Sci U S A.
2016;113(7):1883–1888.
29. Gandhi RT, et al. The effect of raltegravir intensification on low-level residual viremia in HIV-infected patients on antiretroviral therapy: a randomized controlled trial. PLoS Med. 2010;7(8):e1000321.
30. McMahon D, et al. Short-course raltegravir intensification does not reduce persistent low-level viremia in patients with HIV-1 suppression during receipt of combination antiretroviral therapy. Clin Infect Dis. 2010;50(6):912–919.
31. Einkauf KB, et al. Intact HIV-1 proviruses accumulate at distinct chromosomal positions during prolonged antiretroviral thera-py. J Clin Invest. 2019;129(3):988–998.
32. Lorenzi JC, et al. Paired quantitative and qualitative assessment of the replication-competent HIV-1 reservoir and comparison with integrated proviral DNA. Proc Natl Acad Sci U S A. 2016;113(49):E7908–E7E16.
33. Wang Z, et al. Expanded cellular clones carrying replication-competent HIV-1 persist, wax, and wane. Proc Natl Acad Sci U S A. 2018;115(11):E2575–E2E84.
34. Fiebig EW, et al. Dynamics of HIV viremia and antibody seroconversion in plasma donors: implications for diagnosis and stag-ing of primary HIV infection. AIDS. 2003;17(13):1871–1879.
35. Besson GJ, et al. HIV-1 DNA decay dynamics in blood during more than a decade of suppressive antiretroviral therapy. Clin
Infect Dis. 2014;59(9):1312–1321.
36. Gandhi RT, et al. Levels of HIV-1 persistence on antiretroviral therapy are not associated with markers of inflammation or acti-vation. PLoS Pathog. 2017;13(4):e1006285.
37. Keele BF, et al. Identification and characterization of transmitted and early founder virus envelopes in primary HIV-1 infection.
Proc Natl Acad Sci U S A. 2008;105(21):7552–7557.
38. Berry CC, Gillet NA, Melamed A, Gormley N, Bangham CR, Bushman FD. Estimating abundances of retroviral insertion sites from DNA fragment length data. Bioinformatics. 2012;28(6):755–762.
39. Mexas AM, et al. Concurrent measures of total and integrated HIV DNA monitor reservoirs and ongoing replication in eradi-cation trials. AIDS. 2012;26(18):2295–2306.
40. Ferris AL, et al. Clonal expansion of SIV-infected cells in macaques on antiretroviral therapy is similar to that of HIV-infected cells in humans. PLoS Path. In press.
41. De Boer RJ, Homann D, Perelson AS. Different dynamics of CD4+ and CD8+ T cell responses during and after acute
lympho-cytic choriomeningitis virus infection. J Immunol. 2003;171(8):3928–3935.
42. Colby DJ, et al. Rapid HIV RNA rebound after antiretroviral treatment interruption in persons durably suppressed in Fiebig I acute HIV infection. Nat Med. 2018;24(7):923–926.
43. Gandhi RT, et al. No effect of raltegravir intensification on viral replication markers in the blood of HIV-1-infected patients receiving antiretroviral therapy. J Acquir Immune Defic Syndr. 2012;59(3):229–235.
44. Chaillon A, et al. Size, composition, and evolution of HIV DNA populations during early antiretroviral therapy and intensifica-tion with maraviroc. J Virol. 2018;92(3):e01589-17.
45. Lu CL, et al. Relationship between intact HIV-1 proviruses in circulating CD4(+) T cells and rebound viruses emerging during treatment interruption. Proc Natl Acad Sci U S A. 2018;115(48):E11341–E113E8.
46. Hong F, et al. Novel assays for measurement of total cell-associated HIV-1 DNA and RNA. J Clin Microbiol. 2016;54(4):902–911. 47. Malnati MS, et al. A universal real-time PCR assay for the quantification of group-M HIV-1 proviral load. Nat Protoc.
2008;3(7):1240–1248.
48. Palmer S, et al. Multiple, linked human immunodeficiency virus type 1 drug resistance mutations in treatment-experienced patients are missed by standard genotype analysis. J Clin Microbiol. 2005;43(1):406–413.
49. Fisher RA. On the interpretation of χ2 from contingency tables, and the calculation of P. J Royal Stat Soc. 1922;85(1):87–94.