Comparison of Left Ventricular Global
Longitudinal Strain Measured with
Real Time Triplane and 2-Dimensional
Echocardiography in Patients with Atrial
Fibrillation
Lingyun Kong, Chao Yu, Jihong Guo and Tiangang Zhu
Department of Cardiology, Peking University People’s Hospital.
Introduction
Atrial fibrillation (AF) has become the most common persistent arrhythmia.1 It interacts with left ventricular (LV) systolic
function2 and also makes reliable assessment difficult.3 LV
global longitudinal peak systolic strain (GLPS, also known as GLS), particularly the global average GLPS (GLPSAvg, which is the average of sectional GLPSs) measured with speckle tracking echocardiography (STE) has been well validated to assess global LV systolic function.4-6 However, its application
in patients with AF has been restricted due to the irregular heart rhythm intrinsic to AF , the constantly varying cardiac contractility coupled with the necessity of analyzing three separate apical views to get GLPSAvg.2,3,7 Using the conventional
2DE imaging, GLPSAvg is determined after separate recording and analysis of apical 4-, 2- and 3-chamber LV views. The varying ventricular cycle lengths make difficult the tracking and
matching of the speckles in AF patients, thus, the integration of strain measures from the three views would be either unfeasible or unrepresentative of cardiac function status for any of the three separately selected beats.8 Consequently, most clinical
studies concerning the global GLPS have excluded patients with AF. On the other hand, the past and present guidelines have been recommending all measurements performed on a minimum of five beats in patients with atrial fibrillation.6 This
also indicates that relatively accurate measurement would depend highly on reliable quantification for each beat. Generally, parameters involving more than one views, such as Biplane disk summation for LV volume quantification and GLPSAvg, would tell more of the actual functional status.9 Real time
triplane echocardiography (3PE), based on three-dimensional echocardiography, can demonstrate 3 two-dimensional (2DE) tomographic images simultaneously on a squad view using one matrix probe.10,11 When the triplane echo probe is apically
Abstract
Background
Left ventricular (LV) global longitudinal peak systolic strain (GLPS, also known as GLS) based on speckle tracking echocardiography (STE) is validated to evaluate global LV systolic function, particularly the global average GLPS (GLPSAvg, which is averaged
from three apical longitudinal views). However, its application is limited in atrial fibrillation (AF) due to its variability of cycle lengths. A novel imaging technique, real time triplane echocardiography (3PE), allows simultaneous presentation of apical 4-, 2-, and 3- chamber views within one ultrasonic view. We compared GLPS measures using 3PE and conventional 2-dimensional echocardiography (2DE) in patients with AF.
Methods
Patients with AF and a control group with sinus rhythm were enrolled prospectively. Three apical sectional GLPSs and GLPSAvg were measured with conventional 2D (2D-STE) and 3PE (3P-STE) modes. Comparison, correlation and agreement of measurements with both modes were made. Ten patients were selected randomly for reproducibility study.
Results
(1) A total of 39 patients with AF and 38 control subjects were analyzed. Adequate apical 3PE views were acquired in most subjects (95%). Measurement of GLPSs with 3P-STE was more readily available than with 2D-STE in AF group (97.5% vs. 60.0%, P=000). (2) The GLPSs measured with 3P-STE was constantly lower than that of 2D-STE, but linearly correlated, with GLPSAvg revealing the best correlation (r=0.86, P=0.00 in both groups). (3) The reproducibility of GLPS measured by 3P-STE was valid.
Conclusions
Triplane echocardiography may extend the use of LV global longitudinal strain to patients with AF for assessment of global LV systolic function.
Key words: Atrial Fibrillation; Left Ventricle; Triplane Echocardiography; Speckle Tracking; Strain
Citation: Kong, L.Y., Yu, C., Guo, J. and Zhu T. Comparison of Left Ventricular Global Longitudinal Strain Measured with Real Time Triplane and 2-Dimensional Echocardiography in Patients with Atrial Fibrillation. International Cardiovascular Forum Journal. 2015;24-29. DOI: 10.17987/icfj.v4i0.156
placed, the apical 4-, 2- and 3-chamber views of LV can be shown at once within one ultrasonic view. Hence, apical 3PE may allow accurate single-beat measurement of LV GLPSAvg untethered by arrhythmia. It has been validated to evaluate LV volume and dyssynchrony with tissue velocity imaging.10,11
However, the combination use of 3PE and strain analysis with STE technique for evaluation of LV mechanics, particularly GLPSAvg in AF patients is limited. The present study was aimed to compare measurements of LV sectional and global average GLPS using 3PE and the conventional 2DE techniques in patients with AF.
Methods
1. Study Population
Patients with AF and age- and gender- matched subjects with sinus rhythm were prospectively enrolled consecutively during March 2012 and January 2013. All participants underwent 12-lead electrocardiography (ECG) examination, based on which they were divided into AF and sinus group. Patients with frequent premature atrial or ventricular beats were excluded. Informed consent was obtained from each patient and the study protocol conformed to the ethical guidelines of the 1975 Declaration of Helsinki as reflected in a priori approval by the institution’s human research committee.
2. Echocardiography
Echocardiography was performed with a commercially available machine (GE Vivid E9, General Electric Ultrasound) which was equipped with 2 transducers: one was a M5S for conventional 2DE imaging, the other a 3V transducer for 3PE imaging, both sharing a frequency of 1.7~3.3MHz. Digital loops were stored for off-line analysis. The built-in automated functional imaging (AFI) software allowed measurement of segmental, sectional and global average LV GLPS using STE principle under both conventional 2-dimensional (2D-STE) and 3PE views (3P-STE).
2.1 Image acquisition
The images were obtained with the patient in the left lateral decubitus position. With M5S probe, the conventional parasternal and LV apical 4-, 2- and 3-chamber (A4CH, A2CH and A3CH) views were respectively and sequentially acquired; with 3V probe under the “tri-plane” mode and apically placed, these 3 views could be demonstrated in one ultrasonic view
(Figure 1). The depth and width were adjusted so that the frame rate ranged from 40-80 frames/sec and the region of interest was kept within the sector. Imaging quality was scored as: 1, poor, LV contour was incomplete or unclear, inappropriate for strain analysis; 2, acceptable, artifacts existed but adequate for strain analysis; and 3, ideal, LV contour was complete and clear, ideal for strain analysis.
2.2 Echocardiographic
parameters
The cardiac dimensions and volume were measured complying with the guidelines.6
The sweep speed was set at 100m/s for measurement. Strain analysis was performed with AFI software built in the equipment, with which GLPSAvg could be averaged upon analysis of 3 apical planes. Measurements were averaged for five cardiac cycles in AF group and three in sinus group.
2D-STE
Strain analysis started from A3CH view. Select two intersecting points of LV wall and mitral annulus and one point at the cardiac apex at end systole, and a U-shaped LV region of interest would be developed. Each of the opposing walls was divided into 3 segments (base, middle and apex) and color-coded respectively. Adjust the width of region of interest to make it match with the wall thickness. For segment that was considered inadequately tracked for strain analysis, manual adjustment was made to ensure the speckles moved together with the myocardium. If>5 of the 6 segments were reliably tracked and approved for speckle tracking analysis, the images were accepted. Inadequately tracked segments were excluded from the analysis. Care was taken in patients with AF to choose A4CH and A2CH views that were of similar cardiac cycle lengths for 2D-STE analysis.
3P-STE
Strain analysis with 3PE was similar to the conventional method, starting from the A3CH view and followed by A4CH and A2CH views, except that the software would recognize and start analysis from A3CH view automatically and the three apical views were of the same cycle.
3. Intraobserver and interobserver variability
To determine intraobserver variability, the same examiner re-evaluated LV strain 4 weeks later using both modes. To determine interobserver variability, two independent examiners performed strain analysis respectively in 10 randomly selected patients. Repeat measurement was made at the same cardiac cycle of the same image for each patient to avoid the inherent variability caused by different cycle lengths.4. Statistical Analysis
All numeric data were expressed as mean± SD, and categorical variables as frequency or percentage (%). Differences in variables between groups were assessed using the unpaired Figure 1: Echocardiographic apical views and bull eye’ plot to show the results of strain analysis.
Student t-test for continuous data and nonparametric test for categorical data. Intra-group comparisons were performed with paired t tests or nonparametric test, and the absolute value of strain was used for comparison. Correlations were determined using linear regression analysis. Bland-Altman analysis was used to assess consistency between two measurements. Variability was assessed with the average difference between two measurements and intra-class correlation coefficient (ICC). All data analysis was performed using commercially available statistical analysis software packages (SPSS version 16.0; SPSS Inc., Chicago, Ill). Results were considered statistically significant when P value <0.05.
Results
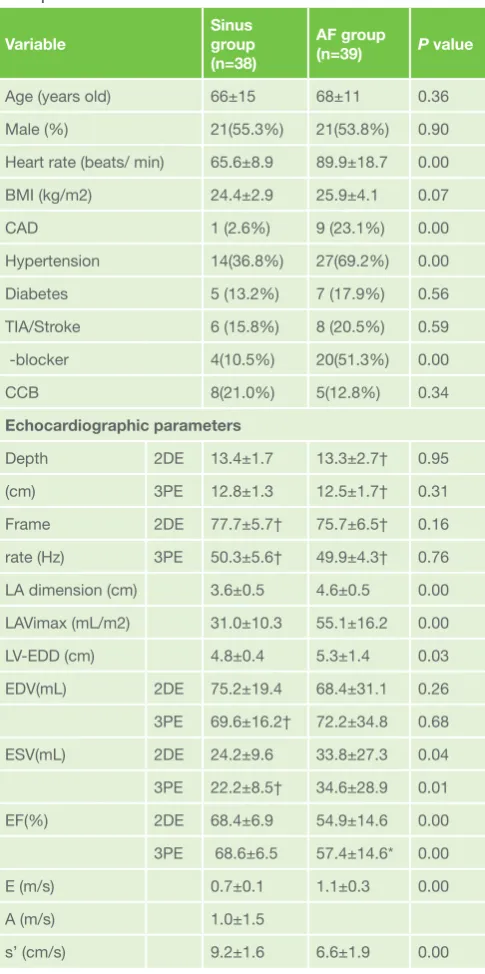
A total of 40 consecutive patients with AF (68±11 years, male 53.8%) and 40 with sinus rhythm (66±15 years, male 55.3%) were enrolled prospectively. One patient in AF group was excluded for poor echogenicity, and two in the control group excluded due to poor ECG tracking or echogenicity. Table 1 showed the clinical and echocardiographic characteristics of Table 1: Clinical and echocardiographic characteristics of the
participants
Variable
Sinus group (n=38)
AF group
(n=39) P value
Age (years old) 66±15 68±11 0.36
Male (%) 21(55.3%) 21(53.8%) 0.90
Heart rate (beats/ min) 65.6±8.9 89.9±18.7 0.00
BMI (kg/m2) 24.4±2.9 25.9±4.1 0.07
CAD 1 (2.6%) 9 (23.1%) 0.00
Hypertension 14(36.8%) 27(69.2%) 0.00
Diabetes 5 (13.2%) 7 (17.9%) 0.56
TIA/Stroke 6 (15.8%) 8 (20.5%) 0.59
γ-blocker 4(10.5%) 20(51.3%) 0.00
CCB 8(21.0%) 5(12.8%) 0.34
Echocardiographic parameters
Depth 2DE 13.4±1.7 13.3±2.7† 0.95
(cm) 3PE 12.8±1.3 12.5±1.7† 0.31
Frame 2DE 77.7±5.7† 75.7±6.5† 0.16
rate (Hz) 3PE 50.3±5.6† 49.9±4.3† 0.76
LA dimension (cm) 3.6±0.5 4.6±0.5 0.00
LAVimax (mL/m2) 31.0±10.3 55.1±16.2 0.00
LV-EDD (cm) 4.8±0.4 5.3±1.4 0.03
EDV(mL) 2DE 75.2±19.4 68.4±31.1 0.26
3PE 69.6±16.2† 72.2±34.8 0.68
ESV(mL) 2DE 24.2±9.6 33.8±27.3 0.04
3PE 22.2±8.5† 34.6±28.9 0.01
EF(%) 2DE 68.4±6.9 54.9±14.6 0.00
3PE 68.6±6.5 57.4±14.6* 0.00
E (m/s) 0.7±0.1 1.1±0.3 0.00
A (m/s) 1.0±1.5
s’ (cm/s) 9.2±1.6 6.6±1.9 0.00
2DE, 2-dimensional echocardiography; 3PE, triplane echocardiography; CAD, coronary artery disease; EDD, end diastolic dimension; LA, left atrium; LAVi, left atrium volume index; LV, left ventricle; s’, systolic wall motion peak velocity; TIA, transient ischemic attack.
*P<0.05 between 2DE and 3PE imaging. † P<0.01 between 2DE and 3PE imaging.
Table 2: Number of segmental and global GLPS accepted for analysis
GLPS acquired Sinus group (n=40) AF group (n=40)
Segmental 2DE 656(96.5%) 643(94.6%) 3PE 641(94.3%) 622(91.5%) Global average 2DE 38(95.0%) 24(60.0%)
3PE 37(92.5%) 39(97.5%)
Abbreviations as above.
Table 3: Global segmental and average strains of AF versus Sinus group
GLPS
(%) AF group (n=39)2DE 3PE P Sinus group (n=38) value 2DE 3PE P value
A3CH§ -11.6±4.1 -10.8±4.3* 0.04 -20.3±2.9 -19.3±3.2* 0.02 A4CH§ -11.9±2.9 -10.4±2.8** 0.001 -20.0±3.3 -19.5±3.1 0.06 A2CH§ -12.3±4.1 -10.9±4.7** 0.01 -20.2±2.9 -19.8±3.3 0.20 Avg§ -11.8±3.5 -10.6±3.8** 0.005 -20.2±2.9 -19.5±2.9** 0.01 A3CH, apical 3 chamber view; A4CH, apical 4 chamber view; A2CH, apical 2 chamber view; Avg, global average GLPS; GLPS, global longitudinal peak systolic strain; other abbreviations as above.
§P<0.01 between the AF and sinus groups. * P<0.05 between 2DE and 3PE approach. **P<0.01 between 2DE and 3PE approach.
Table 4: Univariate linear regression model of GLPS measured by both techniques
GLPS Regression equation t value P value
A3CH Sinus Y3PE=0.8X2DE 5.9 0.000
AF Y3PE=0.9X2DE 7.1 0.000
A4CH Sinus Y3PE=0.8X2DE-4.1 8.8 0.000
AF Y3PE=0.7X2DE 5.4 0.000
A2CH Sinus Y3PE=0.9X2DE 7.0 0.000
AF Y3PE=0.9X2DE 6.9 0.000
Avg Sinus Y3PE=0.9X2DE 9.9 0.000
AF Y3PE=0.9X2DE 7.7 0.000
Abbreviations as above.
Table 5: Reproducibility of GLPS measured by both techniques
GLPS (%)
Intra-observer variability
Inter-observer variability
Mean difference (ICC) Mean difference (ICC)
2DE 3PE 2DE 3PE
the participants. The dimensions and volume of LA in the AF group were significantly higher than that of the sinus group (P< 0.01), while LV EF and Sa were lower than the control group (P< 0.01).
The image quality of 3PE in AF group was slightly reduced compared with 2DE (image score 2.63±0.49vs. 2.79±0.41,
P=0.01), but similar in the sinus group (2.79±0.41 vs. 2.84±0.37, P=0.16). The frame rate of 3PE was dramatically lower than
2DE in both groups (Table 1).Table 2 showed the number of segments adequate for analysis and finally acquired number of global GLPS. Notably in AF group, measurement with 3P-STE was achieved with more practicability than 2D-STE (97.5%vs.60.0%, P< 0.01).
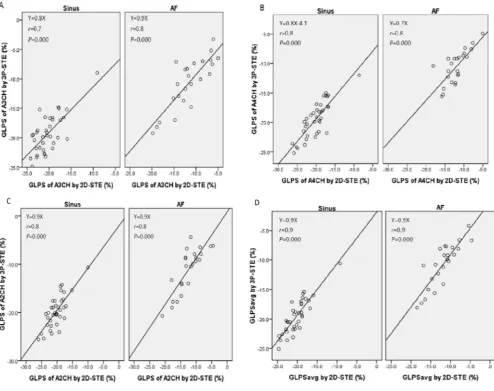
The sectional and global average GLPSs measurements in AF group were consistently lower than that of the sinus group using both modes (Table 3). The correlation of LV GLPS measured by both modes was demonstrated in Figure 2, of which GLPSAvg showed the best correlation (r=0.86, P=0.00 in both groups). With GLPSAvg measured by 2D-STE as the independent variable (X) and by 3P-STE as the dependent variable (Y), a linear regression equation could be established (Table 4). There was excellent agreement of GLPSAvg measured using the two modes (Figure 3). The reproducibility for strain analysis of each study group was revealed in Table 5.
Discussion
Findings
This prospective study was aimed to compare LV GLPS measured with3P-STE and 2D-STE and came to three major findings: 1). It was practical to measure LV GLPS in AF patients with 3PE and STE techniques; 2). GLPSAvg was of the best correlation and agreement among the longitudinal strain indices by both modes; 3). GLPSAvg had the best inter- and intra-observer reproducibility among the GLPS indices.
Data interpretation
LV global systolic function and deformation in patients with AF
LV global longitudinal strain has been accepted as a valuable complimentary index to EF as an indicator of global LV systolic function.6 The present study verified a fair correlation between
GLPSAvg and EF, consistent with the previous studies. It is subject to various factors like age,12 however, we showed that
both EF and GLPS in AF group were lower than that of the age and gender matched sinus group. The possible mechanisms have been explored in experimental and clinical studies. Ling and colleagues2 showed that irregular ventricular rhythm caused
an alteration in ventricular cardiomyocyte excitation-contraction coupling and deteriorated LV systolic function, as was
evidenced by clinical study.13 Rapid heart rate that is frequently
function, as our study showed that the heart rate in AF group was significantly faster than the sinus control group.14 Besides,
loss of atrial contraction during AF decreases the preload and hence LV pump efficacy through Frank-starling mechanism.15
Meanwhile, as shown in our study, the fact that patients in AF group were complicated with more cardiovascular diseases and on more medications of negative inotropic effects may also play a part for the reduced global LV systolic function in AF patients.
LV deformation assessed with 3P-STE in patients with AF The present study evaluated LV mechanics in AF patients with sectional and global GLPS measures. LV longitudinal strain measured with STE has been recommended by the recently published guideline.6 Automated functional imaging technique
offers a user-friendly process for speckle tracking analysis as already demonstrated by several other authors.4,16,17 Lee
and colleagues18 evaluated the role of strain values using
automated function imaging for assessment of acute chest pain and showed its diagnostic and prognostic value. Our study provided further evidence for its usability in patients with AF. Conventionally, evaluation of GLPS measured with STE, particularly GLPSAvg, has been limited in AF patients, 3,6,7 owing
primarily to the constantly varying cycle lengths inherent with AF and separate acquisition and analysis of apical views with the conventional 2DE approach. The present study utilized 3PE imaging for real time and simultaneous presentation of the three LV apical views and automated function imaging for analysis of strain measures, ensuring the accuracy for measurement of GLPSAvg on a single beat basis.
Published studies on 3PE imaging have validated its value for volume and deformation quantification.11,18 The present study
extended its use for assessment of global LV mechanics into patients with AF, confirmed that the frame rate presented by 3PE was adequate for LV strain analysis, and showed significantly higher success rate of GLPSAvg measurement with 3P-STE (97.5%) than 2D-STE (60.0%) in AF patients (Table 2). Cases in which GLPS could not be analyzed with 3PE
were affected mostly by technical factors: poor image quality, reverberation or off-axis view of LV leading to inadequate tracking.
The present study showed that the correlation of GLPS parameters measured by both modes was consistently high in the sinus group, confirming the reliability of 3P-STE measuring GLPS, particularly considering the well validated value of 2D-STE.19 Intra-group comparison showed that GLPS
calculated by 3P-STE was 80~90% that of by 2D-STE. This may be associated with the lower frame rate in 3PE imaging than 2DE, which can induce discontinuation and de-correlation of tracking and reduce the ability to detect the maximal deformation.20 The revelation that correlation and agreement
of GLPS by the two techniques in AF group was similar to that in sinus group may also indicate that if 3 beats close in cycle length could be selected, GLPSAvg measured by 2D-STE was practical in AF patients.
Limitations
This study did not use tagged CMR as standard reference to assess the accuracy of GLPS measured with 3P-STE, but the conventional 2D-STE technique had been well validated as accurate and reliable both invasively and noninvasively.21 The
influence of cycle length variation on LV function in AF and the methods that select a representative “index beat” have been proposed in the literature.3,7 The present study did not select
such beat, instead, complying with the recently published guideline, measurements were averaged from five cardiac cycles in AF group and three in sinus group.6,21 The subjects in
the two groups were matched only with gender and age, hence, the inter-group comparison was reflective only of heterogeneity of the enrolled individuals. Further study with more comparable baseline data and more population is wanted to confirm the impact of AF on LV systolic function.
Conclusion
Triplane echocardiography allows single beat assessment of LV GLPS, particularly GLPSAvg in patients with AF, which is the basis of multiple measurements for an average value. It extends the use of GLPSAvg to patients with AF for evaluation of global LV systolic function.
Statement of ethical publishing
The authors state that they abide by the statement of ethical publishing of the International Cardiovascular Forum Journal.22
Conflict of interest:
The authors have no conflict of interest to disclose.
Address for correspondence:
Department of CardiologyPeking University People’s Hospital. #11 Xi Zhi Men Avenue South Beijing, China, 100044. Tel: +86 010 85231403 Fax: +86-010-65913918 E-mail: [email protected]
References:
1. Boriani G, Diemberger I. Globalization of the epidemiologic, clinical, and financial burden of atrial fibrillation. Chest. 2012;142(6):1368-1370. DOI: 10.1378/chest.12-1091.
2. Ling LH, Khammy O, Byrne M, et al. Irregular rhythm adversely influences calcium handling in ventricular myocardium: implications for the interaction between heart failure and atrial fibrillation. Circ Heart Fail. 2012;5(6):786-793. DOI: 10.1161/CIRCHEARTFAILURE.112.968321. 3. Lee CS, Lin TH, Hsu PC, et al. Measuring left ventricular peak
longitudinal systolic strain from a single beat in atrial fibrillation: validation of the index beat method. J Am Soc Echocardiogr. 2012;25(9):945-952. DOI: 10.1016/j.echo.2012.06.006. 4. Feigenbaum H, Mastouri R, Sawada S. A practical approach to
using strain echocardiography to evaluate the left ventricle. Circ J. 2012;76(7):1550-1555. DOI:http://doi.org/10.1253/circj.CJ-12-0665 5. Saito M, Negishi K, Eskandari M, et al. Association of Left Ventricular
Strain with 30-Day Mortality and Readmission in Patients with Heart Failure. J Am Soc Echocardiogr. 2015;28(6):652-666. DOI: 10.1016/j. echo.2015.02.007.
6. Lang RM, Badano LP, Mor-Avi V, et al. Recommendations for Cardiac Chamber Quantification by Echocardiography in Adults: An Update from the American Society of Echocardiography and the European Association of Cardiovascular Imaging. J Am Soc Echocardiogr. 2015;28(1):1-39. DOI: 10.1016/j.echo.2014.10.003.
7. Kusunose K, Yamada H, Nishio S, et al. Index-beat assessment of left ventricular systolic and diastolic function during atrial fibrillation using myocardial strain and strain rate. J Am Soc Echocardiogr. Sep;25(9). 2012;25(9):953-959. DOI: 10.1016/j.echo.2012.06.009.
8. Zhang Y, Mazgalev TN. Achieving regular slow rhythm during atrial fibrillation without atrioventricular nodal ablation: selective vagal stimulation plus ventricular pacing. Heart Rhythm. 2004;1(4):469-475. DOI: http://dx.doi.org/10.1016/j.hrthm.2004.06.011
9. Rodevand O, Bjornerheim R, Aakhus S, Kjekshus J. Left ventricular volumes assessed by different new three-dimensional echocardiographic methods and ordinary biplane technique. Int J Card Imaging.
1998;14(1):55-63. PMID: 9559379. No DOI.
10. Van de Veire NR, Yu C-M, Ajmone-Marsan N, et al. Triplane tissue Doppler imaging: a novel three-dimensional imaging modality that predicts reverse left ventricular remodelling after cardiac resynchronisation therapy. Heart. 2008;94(3):e9. DOI:10.1136/ hrt.2007.122564
11. Ren M, Tian J-W, Leng X-P, Wang H-M, Wang Y, Wang Z-Z. Assessment of Global and Regional Left Ventricular Function After Surgical Revascularization in Patients With Coronary Artery Disease by Real-time Triplane Echocardiography. J Ultrasound Med. 2009;28(9):1175-1184. PMID: 19710215.No DOI.
12. Bajraktari, G., Lindqvist, P., & Henein, M. Y. Left ventricular global dyssynchrony is exaggerated with age. International Cardiovascular Forum. 2013;1:47-51. http://dx.doi.org/10.17987/icfj.v1i1.16 13. Clark DM, Plumb VJ, Epstein AE, Kay GN. Hemodynamic effects of an
irregular sequence of ventricular cycle lengths during atrial fibrillation.
J Am Coll Cardiol. 1997;30(4):1039-1045. DOI:10.1016/S0735-1097(97)00254-4
14. Boettler P, Hartmann M, Watzl K, et al. Heart rate effects on strain and strain rate in healthy children. J Am Soc Echocardiogr. 2005;18(11):1121-1130. DOI: http://dx.doi.org/10.1016/j.echo.2005.08.014
15. Popoviγ ZB, Yamada H, Mowrey KA, et al. Frank-Starling mechanism contributes modestly to ventricular performance during atrial fibrillation. Heart Rhythm. 2004 1(4):482-489. DOI: http:// dx.doi.org/10.1016/j. hrthm.2004.06.016
16. López-Candales A. Automated functional imaging for assessment of left ventricular mechanics in the presence of left ventricular hypertrophy. Echocardiography. 2014;31(5):605-614. DOI: 10.1111/echo.12441. 17. Lee M, Chang SA, Cho EJ, et al. Role of strain values using automated
function imaging on transthoracic echocardiography for the assessment of acute chest pain in emergency department. Int J Cardiovasc Imaging. 2015 31(3):547-556. DOI: 10.1007/s10554-015-0588-z.
18. Eroglu E, D’hooge J, Herbots L, et al. Comparison of real-time tri-plane and conventional 2D dobutamine stress echocardiography for the assessment of coronary artery disease. Eur Heart J. 2006;27(14):1719-1724. DOI: http://dx.doi.org/10.1093/eurheartj/ehl023 1719-1724 First published online: 23 May 2006
19. Amundsen BH, Helle-Valle T, Edvardsen T, et al. Noninvasive myocardial strain measurement by speckle tracking echocardiography: validation against sonomicrometry and tagged magnetic resonance imaging. J Am Coll Cardiol. 2006 47(4):789-793. DOI:10.1016/j.jacc.2005.10.040 20. Negishi K, Negishi T, Agler DA, Plana JC, Marwick TH. Role of temporal
resolution in selection of the appropriate strain technique for evaluation of subclinical myocardial dysfunction. Echocardiography. 2012;29(3):334-339. DOI: 10.1111/j.1540-8175.2011.01586.x.
21. Lang RM, Bierig M, Devereux RB, et al. Recommendations for Chamber Quantification: A Report from the American Society of Echocardiography’s Guidelines and Standards Committee and the Chamber Quantification Writing Group, Developed in Conjunction with the European Association of Echocardiography, a Branch of the European Society of Cardiology. J Am Soc Echocardiogr. 2005;18(12):1440-1463. DOI: http://dx.doi.org/10.1016/j. echo.2005.10.005