*Address for correspondence
E-mail: [email protected]
Research
Research Paper
Paper
Development and Validation of a RPLC Method for the
Determination of 2-Phenoxyethanol in Senselle Lubricant
Formulation
G. A. SHABIR*, T. K. BRADSHAW, G. Q. SHAR1 AND S. A. ARAIN2
Oxford Brookes University, School of Life Sciences, Headington Campus, Oxford, UK, 1University of Sunderland,
Sunderland Pharmacy School, Sunderland, UK, 2University of Strathclyde, Department of Pure and Applied
Chemistry, Glasgow, UK
Shabir, et al.: Validation of RPLC Method for Determination of 2-Phenoxyethanol
A new and simple reversed-phase liquid chromatographic method has been developed and validated for the determination of 2-phenoxyethanol preservative (0.3%, w/w) in senselle lubricant formulation. The separation was achieved with acetonitrile-tetrahydrofuran-water (21:13:66, v/v/v) as mobile phase, a C8 column, and UV detection at 258 nm. The calibration curve is linear (r2= 0.9999) from 20-140% of the analytical concentration of 0.75 mg/ml. The mean percent relative standard deviation values for intra- and inter-day precision studies are 1%. The recovery of 2-phenoxyethanol ranged between 99.76 and 100.03% from lubricant formulation. The limits of detection and quantitation are determined to be 0.094 and 0.15 mg/ml, respectively. The method was found to be robust and can be successfully and reliably used to determine the 2-phenoxyethanol preservative content of marketed formulations.
Key words: HPLC, method validation, senselle lubricant formulation, 2-phenoxyethanol
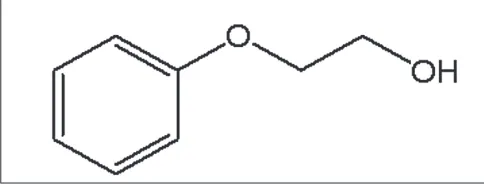
2-Phenoxyethanol (ethylene glycol monophenyl ether, C8H10O2, fi g. 1) has been widely used as preservative in cosmetics, skin care products, toiletry, sexual lubricant products and pharmaceutical applications (i.e. in vaccine formulations)[1,2],because of its broad
antimicrobial spectrum with good stability and non-volatility[3]. It is a good general bactericide (most active against gram negative bacteria) but a weak fungicide and is generally used in combination with other preservatives. Some liquid chromatographic (LC) methods have been reported for the determination of 2-phenoxyethanol with combination
of other components[4,5]. These reported methods
are complicated and time consuming with poor chromatographic separation and longer analytical run time. Furthermore, forced degradation decomposition studies were not included in this work. Determination of 2-phenoxyethanol with solid phase microextraction-gas chromatography-mass spectrometry
(SPME-GC-MS/MS) detection has also been reported[6], but
this technique is not common use in pharmaceutical quality control laboratories. LC technique (fig. 2) has been widely used in pharmaceutical analysis in quality control laboratories because of its sensitivity and specificity. The purpose of this study was to develop and validate a rapid, cost-effective and selective reversed-phase liquid chromatographic (RPLC) method for routine quality control analysis of 2-phenoxyethanol. Stress testing of the preservative was also conducted, as required by the International
Conference on Harmonization (ICH)[7] to support the
suitability of the method. As a best practice[8-12] in the
subsequent investigation, the new RPLC method was validated according to ICH and U.S. Food and Drug Administration (FDA)[13-16] guidelines.
MATERIALS AND METHODS
Methanol grade), tetrahydrofuran (HPLC-grade), 2-phenoxyethanol (pure >99%), and formic acid were purchased from Sigma-Aldrich (Gillingham, UK). Distilled water was de-ionised by using a Milli-Q system (Millipore, Bedford, MA). A Knauer HPLC system (Berlin, Germany) equipped with a module 1000 LC pump, 3950 autosampler and 2600 photodiode-array (PDA) detector was used. The data were acquired via ClarityChrom data acquisition software. Separation was achieved
using Lichrosorb C8 column (150×4.6 mm i.d.,
5 m particle size) from Jones Chromatography
(Hengoed, UK). All chromatographic experiments were performed in isocratic mode. The mobile phase consisted of a mixture of acetonitrile-tetrahydrofuran-water (21:13:66, v/v/v) pH 3.0. The pH was adjusted
with formic acid. The fl ow rate was 1 ml/min, the
injection volume was 10 l, and the temperature was
set at 35. Chromatograms were recorded at 258 nm
using UV detector.
Standard and sample preparation:
2-Phenoxyethanol standard solutions at 0.75 mg/ ml were prepared by dissolving approximately 75 mg of 2-phenoxyethanol in 100 ml mobile phase. An accurately weighed amount (1.25 g) of 2-phenoxyethanol sample lubricant was dissolved in 50 ml mobile phase, yielding a fi nal concentration of
25 mg/ml. The sample was fi ltered through a sample
filtration unit (0.45 μm) and injected into the LC
system.
Method validation:
The method was validated for linearity, range, precision (intermediate precision and repeatability), accuracy, specificity, limits of detection and quantitation. Calibration standard solutions of 2-phenoxyethanol were prepared at concentrations of 0.15, 0.45, 0.75, 0.90 and 1.05 mg/ml in the mobile phase and injected in triplicate. Linear regression analysis was carried out on the standard curve generated by plotting the concentration of 2-phenoxyethanol versus peak area response. The accuracy of the method was evaluated by performing recovery studies at three different levels (50, 100 and 140%) addition of 2-phenoxyethanol. Recovery and average recovery was calculated. The repeatability of the method was evaluated by assaying six replicate injections of the 2-phenoxyethanol at 100% of test concentration (0.75 mg/ml) and was expressed as relative standard deviation (RSD). Intermediate precision was demonstrated by two analysts using two LC systems and evaluating the relative peak area percent data across the two LC systems at three concentration levels (60, 100 and 120%) and expressed as RSD. The limit of detection (LOD) and limit of quantitation (LOQ) were evaluated by applying different dilutions of the standard solution of and peak area of analyte was plotted against concentration and calculated using formula: LOD = (3.3 )/s and LOQ = (10 )/s. The specifi city of the
method was confi rmed by injecting extracted placebo
sample to demonstrate the absence of interference with the elution of the 2-phenoxyethanol. Forced degradation studies were also performed to evaluate the specifi city of 2-phenoxyethanol under four stress conditions (heat, UV light, acid, base).
RESULTS AND DISCUSSION
Efficient chromatography and high sensitivity was
achieved by using acetonitrile-tetrahydrofuran-water as the mobile phase with varying detection wavelengths, based on the response of the analyte. However, the analyte peak tailed badly on some
C18 columns with this mobile phase with longer
analytical run time. Using the C8 column minimised
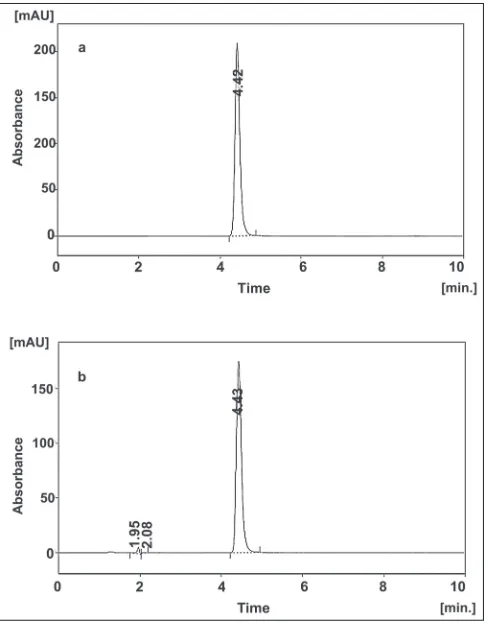
the tailing and shortened the run time. The amount of organic modifier was adjusted so that the assay run time could be reduced for faster analysis of samples. Chromatograms illustrating the separation of 2-phenoxyethanol reference standard and lubricant sample formulation are displayed in fi gs. 2a and 2b, respectively confirming specificity with respect to 2-phenoxyethanol. The remaining chromatographic conditions listed in Section LC instrumentation and conditions were chosen for the following reasons:
the lower fl ow rate of 1 ml/min was chosen because
of the potential problems associated with elevated back pressures. The PDA UV detector was set at 258
nm,
max for 2-phenoxyethanol. Column temperaturewas held at 35 although separation at 30 and 40
indicated that slight variation in temperature did not have a significant effect on retention or peak
shape. Therefore, results produced at 35 were
more reproducible and stable compared to those
produced at 30 and 40, and therefore 35 was
selected as the working temperature. The injection
volume of 10 μl and sample concentration of 0.75 mg
2-phenoxyethanol/ml in mobile phase were chosen to simplify sample preparation (further dilution is not needed). This concentration allows purity evaluation. The peak for 2-phenoxyethanol is well resolved within the linear range for UV detection. System suitability testing was performed by injecting ten replicate injections of a solution containing 0.75 mg 2-phenoxyethanol/ml. The percent relative standard deviation (RSD) of the peak area responses was
measured, giving an average of 0.18 (n = 10). The
tailing factor (T) for each 2-phenoxyethanol peak was 1.257, the theoretical plate number (N) was
4803, and the retention time (tR) variation %RSD
was 1% for ten injections. The RPLC method met
these requirements within the accepted limits[9,13].
For the determination of method robustness within a laboratory during method development a number of chromatographic parameters were determined,
which included fl ow rate, temperature, mobile phase
composition, and columns from different lots, In all cases good separation of 2-phenoxyethanol were always achieved, indicating that the method remained selective for 2-phenoxyethanol preservative under the tested conditions. For stability study, samples and standard solutions were chromatographed immediately after preparation and then re-assyed after storage at room temperature for 48 h. The results in Table 1
show that there was no significant change (1%
response factor) in 2-phenoxyethanol concentration over this period.
Linearity was studied using five solutions in the concentration range 0.15-1.05 mg/ml (20-140% of the theoretical concentration in the test preparation,
n= 3). The regression equation was found by plotting
the peak area (y) versus the 2-phenoxyethanol
concentration (x) expressed in mg/ml. The correlation
coefficient (r2= 0.9999) obtained for the regression
line demonstrates that there is a strong linear relationship between peak area and concentration of 2-phenoxyethanol (Table 1). The analyte response is linear over the range of 80 to 120% of the target concentration for 2-phenoxyethanol assay.
The accuracy of the method was evaluated by means of recovery assay, adding known amounts
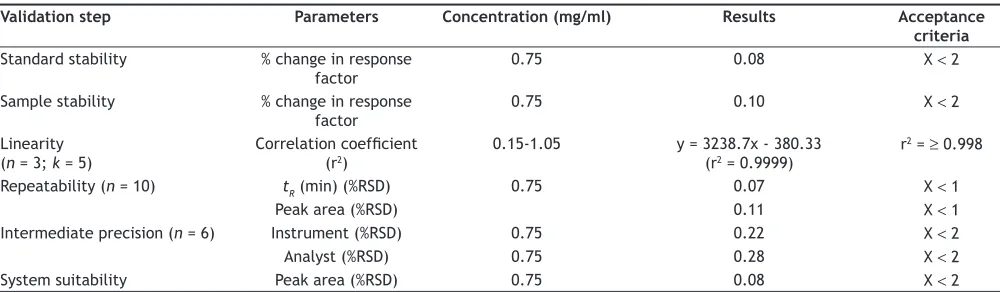
TABLE 1: METHOD VALIDATION RESULTS OF 2-PHENOXYETHANOL
Validation step Parameters Concentration (mg/ml) Results Acceptance criteria
Standard stability % change in response
factor 0.75 0.08 X 2
Sample stability % change in response
factor
0.75 0.10 X 2
Linearity
(n = 3; k = 5) Correlation coef(r2) fi cient
0.15-1.05 y = 3238.7x - 380.33
(r2 = 0.9999)
r2 = 0.998
Repeatability (n = 10) tR (min) (%RSD) 0.75 0.07 X 1
Peak area (%RSD) 0.11 X 1
Intermediate precision (n = 6) Instrument (%RSD) 0.75 0.22 X 2
Analyst (%RSD) 0.75 0.28 X 2
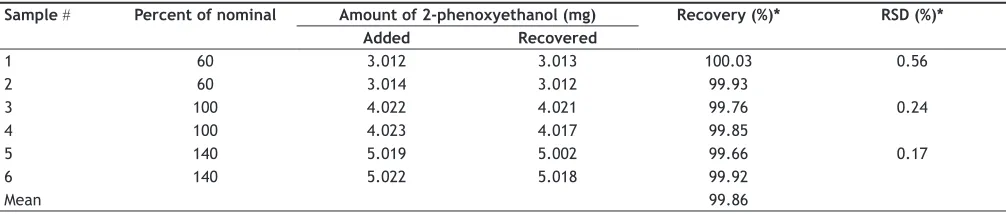
of 2-phenoxyethanol reference standard to a known amount of lubricant formulation in order to obtain three different levels (50%, 100% and 140%) of addition. The samples were analysed and the mean recovery was calculated. The data presented in Table 2 shows the recovery of 2-phenoxyethanol in spiked samples met the evaluation criteria for accuracy (100 +/-2.0% over the range of 80 to 120% of target concentration).
Precision of the method was investigated with respect to repeatability (intra-day precision) and intermediate precision (inter-day variation). Repeatability of the method was evaluated by assaying six replicate injections of the 2-phenoxyethanol at 100% of test concentration (0.75 mg/ml). The %RSD of the retention time (min) and relative percent peak area were found to be less than 0.12% (Table 1). Intermediate precision (inter-day variation) was demonstrated by two analysts using two LC systems and evaluating the relative peak area percent data across the two LC systems at three concentration levels (60, 100 and 120%) that cover the assay method range (0.15-1.05 mg/ml). the mean and %RSD across the systems and analysts were calculated from the individual relative percent peak area mean values at the 50%, 100% and 125% of the test concentration. The %RSD values for both
instruments and analysts were 0.28% (Table 1) and
illustrated good precision of RPLC method.
The RPLC-PDA/UV isoplot chromatogram demonstrates a good separation of the 2-phenoxyethanol. The isoplot chromatogram data consist of PDA UV/Vis absorption spectra from 200 to 300 nm for each point along the chromatogram. Injections of the extracted placebo were also performed to demonstrate the absence of interference with the elution of the 2-phenoxyethanol. These results demonstrate that there was no interference
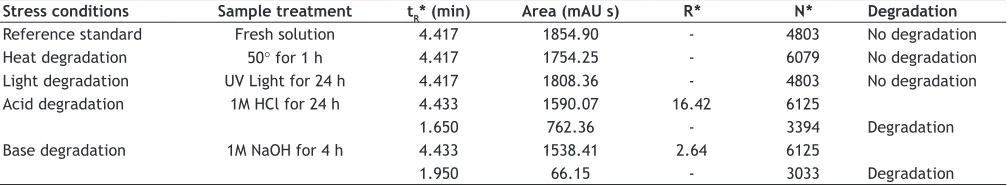
from the other materials in the lubricant formulation and, therefore confirm the specificity of the RPLC method. Forced degradation studies were performed to evaluate the specifi city of 2-phenoxyethanol under four stress conditions (heat, UV light, acid, base).
Solutions of 2-phenoxyethanol were exposed to 60
for 1 h, UV light using a UVL-56 lamp for 24 h, acid (1 M HCl) for 24 h and base (1 M NaOH) for 4 h. A summary of the stress results (retention
time (tR), peak area, resolution (R) and theoretical
plate numbers, (N) is shown in Table 3. Under acid (major degradation) and alkaline (minor degradation) hydrolysis conditions, the 2-phenoxyethanol content decreased and additional peaks were observed (fi g. 3). No degradation was observed under other hydrolysis conditions (heat, UV light) studied. The addition peak detected at 1.65 min under acid and 1.95 min under alkaline conditions. This was further confi rmed by peak purity analysis on a PDA UV detector. The 2-phenoxyethanol analyte obtained by acid hydrolysis was well resolved from the additional peak indicating the specificity of the method. In addition, the selectivity of the method was also checked by mixing all degradation samples and analysing by LC. No degradation peaks were found
TABLE 2: RECOVERY STUDIES OF 2-PHENOXYETHANOL FROM SAMPLES WITH KNOWN CONCENTRATION
Sample Percent of nominal Amount of 2-phenoxyethanol (mg) Recovery (%)* RSD (%)* Added Recovered
1 60 3.012 3.013 100.03 0.56
2 60 3.014 3.012 99.93
3 100 4.022 4.021 99.76 0.24
4 100 4.023 4.017 99.85
5 140 5.019 5.002 99.66 0.17
6 140 5.022 5.018 99.92
Mean 99.86
*n = 3
Fig. 3: LC chromatograms of 2-phenoxyethanol under stress conditions.
near to the 2-phenoxyethanol peak. As mentioned above, degradation was occur only under acidic conditions and resolution between 2-phenoxyethanol and degradation peak were >2 in each case.
The LOD and LOQ of 2-phenoxyethanol was
determined based on standard deviation () of
response and slope (s). 2-Phenoxyethanol solutions
were prepared in the range 0.05-250 μg/ml and
injected in triplicate. Average peak area of analyte was plotted against concentration. LOD and LOQ were calculated by using the following equations:
LOD = (3.3 )/s and LOQ = (10 )/s. The LOD was
determined to be 0.095 mg/ml and LOQ was found to be 0.15 mg/ml for 2-phenoxyethanol with %RSD less than 0.14% for six replicate injections.
A system suitability test was performed to determine the accuracy and precision of the system by injecting six replicate injections of 2-phenoxyethanol standard solution. The RSD of the peak areas responses was measured. The RSD for 2-phenoxyethanol was 0.08% as can be seen in Table 1.
A simple and rapid reversed-phase liquid chromatographic method with UV spectrophotometer detection was developed for the determination of 2-phenoxyethanol in senselle lubricant formulation. The method was validated and the results obtained were accurate and precise with RSD< 1 % in all cases and no significant interfering peaks were detected. The method is specific, selective, robust and reliable for routine use in quality control for analysis of 2-phenoxyethanol in bulk senselle lubricant samples, raw materials, and fi nal products release.
ACKNOWLEDGEMENTS
We thank Dr Simon Giles (School of Life Sciences,
Oxford Brookes University) for providing materials for the research work.
REFERENCES
1. Cecilia A, Anna E, Marco A, Marisanna C, Paolo N, Anna DS. In vitro induction of apoptosis vs. necrosis by widely used preservatives: 2-phenoxyethanol, a mixture of isothiazolinones, imidazolidinyl urea and 1, 2-pentanediol. Biomed Pharmacol 2002;63:437-53.
2. Hall AL. Cosmetically acceptable phenoxyethanol. In: Kabara JJ, editor, Cosmetics and drug preservation, principles and practice. New York: Marcel Dekker; 1984. p. 79-108.
3. The Japanese standards of cosmetic ingredients-with commentary, 2nd ed. Tokyo: The Society of Japanese Pharmacopoeia, Yakuginippousha; 1984.
4. Borremans M, Van LJ, Roos P, Goeyens L. Validation of HPLC analysis of 2-phenoxyethanol, 1-phenoxypropan-2-ol, methyl, ethyl, propyl, butyl and benzyl 4-hydroxibenzoate (parabens) in cosmetic products, with emphasis on decision limit and detection capability. Chromatographia 2004;59:47-53.
5. Sharma B, Joseph A, Sood A. A simple and rapid method for quantifying 2-phenoxyethanol in diphtheria, tetanus and w-pertussis vaccine. Biologicals 2008;36:61-3.
6. Eva K, Kateřina R, Jana H, Jan P, Jitka K, Vladimír K. Development of an SPME–GC–MS/MS procedure for the monitoring of 2-phenoxyethanol in anaesthetised fi sh. Talanta 2008;75:1082-8. 7. Validation of analytical procedures; text and methodology Q2 (Rl),
International conference on harmonization of technical requirements for registration of pharmaceuticals for human use. Geneva, Switzerland, 2005.
8. Shabir GA, Lough WJ, Shafi que AA, Bradshaw TK. Evaluation and application of best practice in analytical method validation. J Liq Chromatogr Relat Technol 2007;30:311-33.
9. Shabir GA. Validation of HPLC methods for pharmaceutical analysis: Understanding the differences and similarities between validation requirements of the U.S. Food and Drug Administration, the U.S. Pharmacopoeia and the International Conference on Harmonization. J Chromatogr A 2003;987:57-66.
10. Shabir GA. Step-by-step analytical methods and protocol in the quality system compliance industry. J Validation Technol 2004;10:314-24. 11. Shabir GA. A practical approach to validation of HPLC methods
under current good manufacturing practices. J Validation Technol 2004;10:210-8.
12. Shabir GA. HPLC method development and validation for pharmaceutical analysis. Pharma Technol Europe2004;16:37-49. 13. Reviewer Guidance: Validation of Chromatographic Methods, Food and TABLE 3: FORCE DEGRADATION STUDIES DATA OF 2-PHENOXYETHANOL
Stress conditions Sample treatment tR* (min) Area (mAU s) R* N* Degradation
Reference standard Fresh solution 4.417 1854.90 - 4803 No degradation
Heat degradation 50 for 1 h 4.417 1754.25 - 6079 No degradation
Light degradation UV Light for 24 h 4.417 1808.36 - 4803 No degradation
Acid degradation 1M HCl for 24 h 4.433 1590.07 16.42 6125
1.650 762.36 - 3394 Degradation
Base degradation 1M NaOH for 4 h 4.433 1538.41 2.64 6125
1.950 66.15 - 3033 Degradation
Proposed Rules, US FDA HHS, 21 CFR Part 211, Federal Register, Vol. 61, 87: 1996. p. 20106.
Accepted 18 April 2010 Revised 10 January 2010 Received 14 August 2009 Indian J. Pharm. Sci., 2010, 72 (3): 312-317 Drug Administration (FDA), Centre for Drug Evaluation and Research
(CDER), 1994.
14. Analytical Procedures and Methods Validation: Chemistry, Manufacturing and Controls Documentation, U.S. FDA, Federal Register (Notices) 65 (169), Aug 2000, p. 52776.
15. Guideline for Submitting Samples and Analytical Data for Methods Validation. US FDA, February 1987.