Pricing Security Software: Theory and Evidence
Anindya Ghose, Arun Sundararajan
Leonard N. Stern School of Business, New York University
Extended Abstract for WEIS 2005
1
Introduction
This paper presents a model of multi-product pricing for consumer security software. It highlights two aspects unique to this kind of software. The …rst is a supply-side e¤ect relating to the security software update process that alters its cost structure, and the second is a demand-side e¤ect relating to the fact that customers often get free substitutes for components of security software suites, which are bundled with products unrelated to computer security. We develop an analytical model that captures each of these e¤ects. In contrast with prior results, this model predicts the optimality of mixed bundling as a pricing strategy; we show how removing the e¤ects we highlight leads to the optimality of pure bundling, which is consistent with past work on information goods. The analytical model also predicts that the “discount" on a bundled software suite increases as the variable cost of high-quality updates goes up. We test the predictions of our model using data on security software demand and pricing we have gathered from Amazon.com, and …nd preliminary support for our theory.
There are a number of aspects of security software that make its economics somewhat di¤erent from those of traditional consumer software. First, the quality of security software depends less on the range of end-user features incorporated into the software, and more on the reliability and
comprehensiveness of frequent updates from the seller of the software that are critical to its e¤ective functioning. For example, Symantec’s AntiVirus software updates the virus de…nition …les on each of its clients using its LiveUpdate functionality very frequently (on the order of 100 updates a year; far more than the frequency of product updates or upgrades for traditional application software). The perceived quality of this software is likely to be a¤ected more by whether these virus de…nition …les are delivered in a timely manner, and whether they are collected comprehensively, rather than by the interface or user features that AntiVirus o¤ers. Similarly, many spam blockers (such as PanicWare’s MailWasher) include subscriptions to spam databases that frequently update the …lters on their clients; the functioning of these …lters, most of which use some sort of binary classi…cation algorithm, depends critically on periodically retraining the …lters to detect new forms of spam, or updating them with newly trained ones.
The need to continuously maintain current lists of viruses (or of spamming techniques), to develop functionality that responds to new threats, and to deliver these to each of one’s customers imposes two kinds of costs on a seller. There is a …xed cost of maintaining the infrastructure associated with the collection of new virus lists/spamming techniques, the application development capability required to address each new threat, and the technological capability to deliver the updates. There may be economies of scope across di¤erent components of client security: the capabilities required to deliver updates can be shared, and there may be learning from countering one kind of security threat (antivirus software, for instance) that may reduce the cost of …guring out how to maintain software that counters another (personal …rewalls, for example). Additionally, each new installation imposes a variable cost on the seller, since the seller has to keep track of and periodically update one additional client’s computer1. It would seem sensible for a seller to take this expected future stream of update costs into account when formulating their pricing strategy. This is especially because it is likely to be independent of the number of components of a security 1This may not be a “continuously varying" cost, but may manifest as periodic discrete increases in labor, servers
suite a client has installed, since the actual updates and …xes are developed independently, and the primary cost driver is likely to be simply the need to keep track of one more client.
A second major distinguishing aspect of security software is that a number of consumers may not wish to purchase certain components of a security software suite for reasons that are independent of their preferences. This is because of the nature of security software: rather than being like application software that provides consumers with software functionality, it is more like utility software that “keeps their systems running" reliably. The reason why this distinction is important is because the latter results in certain components of a security software suite being bundled with other software that is not directly related to providing security. For instance, Windows XP is sold bundled with a fairly e¤ective personal …rewall. Most consumers do not purchase Windows XP for security reasons; however, a consumer who has XP installed may not wish to pay for Norton’s Firewall – this has little to do with the consumer’s underlying preferences for the capabilities of the …rewall. Similarly, a user of Google’s GMail is less likely to want to pay for a spam …lter because GMail’s spam …ltering capability is quite advanced. Again, this unwillingness to pay is not on account of the user’s preferences for spam (most users are likely to adopt GMail for its search, interface and storage). Many organizations mandate the installation of antivirus software on all of their employees computers, which leads to these employees being less willing to pay for independent purchases of such software2. This aspect of security software manifests as a demand-side e¤ect, wherein a random fraction of consumers have low (or no) willingness to pay for certain components, independent of their preferences for the functionality provided by this component.
We model how each of these aspects –higher costs due to security updates that vary with the number of client installations (rather than the number of components sold), and the presence of 2For instance, both authors of this paper have Symantec’s AntiVirus 8.0 installed on each of their computers,
and therefore have a willingness to pay of zero for antivirus software; this has nothing to do with their underlying preferences for such software, and provides no information about their relative disutility from a potential computer virus infection.
a random fraction of customers whose willingness to pay for security components is independent of their preferences – a¤ects optimal pricing strategy for security software. We show that mixed bundling emerges as the optimal strategy, and relate the bundle discount to the magnitude of our parameters. We then test the predictions of our model on data we have gathered from Amazon.com, and …nd preliminary support for our theory.
We have organized the rest of this paper as follows. Section 2 presents our analytical model, derives the optimal pricing strategy for security software suites, and outlines the empirical implica-tions of our model. Section 3 describes our data and Section 4 presents the preliminary empirical results. Section 5 concludes and summarizes our ongoing work.
2
Theory
We model a multi-product monopolist who sells two security software components (for example, an antivirus program and a spam …lter) for which consumer preferences and seller costs are symmetric. The results of our model generalize to directionally for multiple components. Towards the end of this section, we discuss the implications of our results for a model of multi-product oligopoly in which each consumer has a preferred brand.
2.1 Model
A monopolist sells two security software components, denoted I and II. The seller makes two choices: a quality level for its software, and a pricing strategy. The quality level s chosen is assumed to be identical across both components, and the …xed cost borne by the seller from it choice is denoted C(s). This includes development costs associated with the components, as well as …xed costs associated with maintaining the infrastructure associated with updates at a quality levels.
of both components, or may o¤er consumers both of these options. The price of each individual component3 is denotedpc, and the price of the bundle is denoted pb. The seller’s variable cost has two parts. The …rst part is a base costc0, which includes the costs of the CD, manual, packaging,
shrink-wrapping and distribution. If the software is distributed digitally, this cost may be zero. The second part is a per-installation update cost cu that represents the expected future variable costs that a seller will incur over the lifetime of the installation while keeping the installation of its software current with the latest updates (of virus de…nition …les, for instance, as discussed in Section 1). We assume that the same cost [c0 +cu] is incurred when the seller sells either an
individual component or a bundle. That is, the marginal cost of adding the second component to a bundle containing the …rst is zero. This is because the base cost is largely independent of how many components are on the CD in the package, and the update cost is incurred on account of having to contact an IP address, determine the status of updates, and send updated software/data to the client: this is a per installation, rather than per component cost.
There is a unit mass of consumers. Each consumer is indexed by a parameter x which is uniformly distributed on the interval [0;1]. If the quality level of the seller’s software is s, the maximum utility that a consumer with index x gets from component I is s(1 x), and from component II is s[1 (1 x)]. Consumers preferences for the components are therefore based on a model of these components being horizontally di¤erentiated4.
A fractionr of consumers own a perfect substitute for componentI, and an equal fractionr of 3
Given the model’s symmetry, the assumption of symmetric component quality and price is without loss of generality, and for expositional brevity, to avoid having to de…ne multiple quality (and subsequently, price) variables that will be equal in equilibrium. We can provide a more detailed exposition on request.
4A slightly more general formulation would include a “mis…t cost" ratertwhich we have normalized to1. Choosing
t >1leads to a positive mass of consumers (at the ends of the interval) placing no value on each component; these are the customers with the highest valuation of the other component, which seems unrealistic. Choosingt <1increases the value of the bundle relative to the value of each component for each consumer, but does not change our results otherwise.
consumers own a perfect substitute for componentII. As discussed in Section 1, this is on account of these components being developed and o¤ered by sellers of software that is directly unrelated to security (…rewalls with operating systems, spam …lters with email clients). Since the ownership of the unrelated software does not depend on a consumer’s preferences for security, the fraction is chosen randomly, and independently for each component.
The realization of these random fractions segments consumers into four groups. The …rst segment consists of consumers whose willingness to pay for each component is determined by their indexx, and this segment is of size (1 r)2. The second and third segments consist of consumers
whose willingness to pay for one of the two component is determined by their index x, and whose willingness to pay for the other component is zero. Each of these segments is of size r(1 r). The fourth segment consists of those consumers whose willingness to pay for both components is zero. This split is illustrated in Figure 1. Notice that those customers who are willing to pay for both components all have the same willingness to pay for the bundle –this is intentional, to enable our model to capture “demand pooling" e¤ect of larger bundles in a two-component model.
The seller does not know which consumers are in each of these segments, and therefore, cannot directly price-discriminate based on the consumer’s segment. The sequence of events is as follows: the seller chooses their quality level s; the seller chooses their pricing strategy, and the relevant values of pc and pB; consumers purchase either one component, both components or the bundle; each party receives its payo¤s.
2.2 Pure component pricing and pure bundling
We …rst present some baseline results about pure component pricing, and pure bundling. Next, we characterize the optimal prices under mixed bundling, show that mixed bundling is optimal if and only if r > 0, and examine how the seller’s bundling strategy a¤ects their choice of quality of upgrades. We then examine how the discount o¤ered by the seller on its security suite varies
0
x
1
s
0
1
x
s
0
x
1
s
0
1
x
s
Segment 1: Willing to pay for both components
Segment 2: Willing to pay for component I
Segment 3: Willing to pay for component II
Segment 4: Not willing to pay for either
0
x
1
s
0
1
x
s
0
x
1
s
0
1
x
s
Segment 1: Willing to pay for both components
Segment 2: Willing to pay for component I
Segment 3: Willing to pay for component II
Segment 4: Not willing to pay for either
Figure 1: Illustrates consumer willingness to pay for each component as a function of their index x, in each of four segments. In each …gure, the blue (thick) line denotes WTP for component I, the maroon (thin) line denotes WTP for componentII, and the black (dotted) line denotes WTP for a bundle of both components.
with the variable cost of security updatescu and the fraction of customers with outside substitutes r. Finally, we discuss extensions that admit asymmetry in the demand for the individual security components, and what the model’s results tell us about oligopoly.
Our …rst result characterizes optimal pure component pricing, when the seller does not o¤er a bundle of the two components.
Lemma 1 The seller’s optimal choice of pure component pricing is
pc = s+ [co+cu]
All our proofs are in Appendix A. The result of this lemma is straightforward: in the absence of a bundle, the demand for each component is independent, and therefore, the seller simply chooses the pro…t-maximizing monopoly price for each component.
Our next result characterizes optimal pricing under pure bundling, when the seller only prices its bundle, and does not sell either component independently.
Lemma 2 The seller’s optimal choice of pure bundle pricing is as follows: if r s 3s 2[c0+cu] , thenpB=s, and if r > s 3s 2[c0+cu] , then pB= s+ [c0+cu] 2 + s(1 r) 4r :
Lemma 2 shows that for a range of lower values ofr, the seller prices the bundle at the maximum possible price s. At this price, only to those customers who are willing to pay for both products (segment 1 in Figure 1) purchase the bundle. For higher values of r, there is a su¢ ciently high number of customers in segments 2 and 3 to warrant loweringpB below the maximum, in order to induce a fraction of these customers to purchase. Also, as cincreases, the range of values ofr over which the seller sets the maximum possible price increases, which is natural, since it is more costly to increase revenues by lowering price.
It is straightforward to show that pure bundling always dominates pure component pricing. A proof of this assertion is available on request; since it is not central to our research questions, it is not discussed further.
2.3 Optimal mixed bundling
Our next result speci…es the seller’s optimal choice of mixed bundling, and is described in Propo-sition 1.
Proposition 1 The seller’s optimal choice of pricing when using a mixed bundling pricing strategy
(a) For r s 2(s [c0+cu])
, the seller chooses the maximum bundle price:
pB = s (2) pc = s+ [c0+cu] 2 + (1 r)(s [c0+cu]) 2 (3) (b) For r > s 2(s [c0+cu])
, the seller lowers the bundle price below the maximum, but still prices each component lower than the bundle:
pB = s+ [c0+cu] 2 + s 4r (4) pc = s+ [c0+cu] 2 + s(1 r) 4r (5)
Proposition 1 shows that for all values of r < 1, the component prices (as well as the bundle price) arehigher than the pure components (monopoly) price derived in Lemma 1. In addition, the range of values of r over which the seller charges the maximum bundle price islarger under mixed bundling than under pure bundling. The intuition for this is as follows: when using mixed bundling, and withpB=s, a fraction of customers in segment 1 already choose to purchase the components, since their surplus is positive form doing so. This is in contrast with their choices under pure bundling, where every customer in segment 1 bought the bundle. Moreover, the corresponding sets of customers in segments 2 and 3 also purchase the components, so the seller’s lost revenue from these segments whenpB=sis lower.
When r = 0, pB = pc = s, and the seller’s strategy becomes equivalent to pure bundling, since the demand for the individual components is zero at these prices. All customers purchase the bundle, and the seller captures all their surplus. This is consistent with prior results on monopoly bundling (Bakos and Brynjolfsson, 1999) – note that while our model includes a positive variable cost [c0+cu], the marginal cost of adding a component to the bundle is zero.
Our next proposition speci…es the seller’s optimal pricing strategy.
Proposition 2 When r >0, mixed bundling is the seller’s optimal pricing strategy, for any c0
The proposition’s proof is straightforward: it follows from the fact that pc < pB when r > 0, and therefore, mixed bundling yields higher pro…ts than any pure bundling strategy (notice that a pure bundling strategy with pricep yields pro…ts that are identical to those under pc =p; pB =p). This is an important conclusion, because it indicates that the kind of random participation that is unrelated to a customer’s preferences, which we have modelled as being characteristic of consumer security software, leads to a di¤erent optimal pricing strategy.
De…ne the seller’s discount on their bundle as the percentage di¤erence between the price of the bundle and the sum of the prices of the individual components: that is,[1 (pB=2pc)]. By inspection of equations (2-5), it is clear that the seller always discounts their bundle, sincepc >(s+[c0+cu])=2,
while pB s. The following corollary describes how this discount varies with cand r.
Corollary 1 The discount o¤ ered by the seller on their bundled security suite is strictly increasing
in the variable update cost cu, and strictly decreasing in the fraction r of customers who have an outside substitute for a security component.
The next corollary describes how the relative demand for the bundle and its individual compo-nents vary with cu andr.
Corollary 2 The demand for the bundle relative to the demand for the component increases in the
update cost cu, and decreases in r.
Intuitively, as c increases, selling the bundle becomes increasingly desirable for the seller, since pro…t margins on both products shrink as c increases, but at a higher (percentage) rate for the component. A natural response for the seller is to adjust prices that shift demand away from the bundle and towards the components. Correspondingly, asr increases, the size of the segment containing potential customers for the bundle shrinks, leading to a pricing response that shifts demand in the opposite direction.
2.4 Implications for oligopoly pricing
We have analyzed an extension of the monopoly model to the case of duopoly with brand prefer-ences. That is, we model duopoly pricing for two …rms M andN. who sell identical product lines. A fractionk of customers have a preference for brandM, and a fraction (1 k) have a preference for brandN. The …rms …rst choose quality levelssM; sN, and then choose pricing strategy (which may include pure component pricing, pure bundling, or mixed bundling). Our analysis of this model is in progress, and our current results indicate that while prices for both …rms are lower than monopoly prices, each chooses a mixed bundling strategy (which is symmetric whenk= 0:5), and the monopoly results of Proposition 2, and of Corollaries 1 and 2 persist, so long as the preferences for brands are not too weak.
2.5 Empirical implications
Our analytical model and its assumptions leads to the following hypotheses about consumer security software:
1. Ifr >0, the optimal pricing strategy involves mixed bundling (Proposition 2).
2. If the cost of updates cu is greater then zero, then the variable cost of security software is higher than the variable cost of standard application software.
3. The higher the cost of updates cu,
(a) the greater the discount o¤ered on bundled suites of security software (Corollary 1). (b) the higher the demand for the bundle relative to the demand for the components
(Corol-lary 2).
4. Between two security software product categoriesX and Y with the same update costs, and with corresponding fractionsrX and rY, ifrX > rY, then
(a) the discount o¤ered on a bundle of X and Y is higher relative to the component price of Y than to the component price of X (Corollary 1).
(b) the demand for a bundle ofX and Y is higher relative to the demand forY than to the demand for X (Corollary 2).
In order to test these hypotheses, we …rst need estimates of the variable costs for di¤erent security software, as well as estimates of the variable costs for standard application software. These can be inferred from the markups p c
p for each product (component, bundle), which in turn are computed using the Lerner index for each product, which uses the price elasticities of demand for these products with respect to their own prices, with respect to the prices of their substitutes (the bundle for each component, and each component for the bundle), and with respect to the prices of competing products. We follow the approach of Hausman (1994), who provides the following to estimate the markups for products sold by multi-product oligopolists, weighted by their market share. For simplicity, we make the following assumption: that the demand for the components of the bundle of each …rm are independent (that is, for instance, there is no substitution between spam software and anti-virus software, except through the sales of a bundle that contains both components). Therefore, the estimated markups for components involve own-price elasticities, cross price elasticities with respect to the bundle sold by the …rm, and the cross-price elasticities of the corresponding component and bundle of any competing …rm(s).
Based on this assumption, the revenue-share-weighted markups can be computed as follows. Consider a set of productsf0;1;2; :::; mg, where the bundle is indexed by0and the other products are its components. Assuming, as in our model, that all substitution between individual components is mediated by the bundle (that is, demand for the components are mutually independent). Then, the …rst-order conditions for oligopoly pro…t maximization yield a system of linear equations such that
where s is the vector of revenue shares, N is the matrix of cross price elasticities and M is the vector of price cost markups multiplied by the product share under the Nash-Bertrand assumption. By inverting the matrix of own and cross price elasticities, we estimate the marginal costs, ci of each individual component of a bundle.
3
Data and Evidence
3.1 Industry Details
The 2 largest …rms in the security software industry are Symantec and McAfee, whose combined revenues account for over half the total industry revenues.5 The various products in the security industry can categorized into the following classes.6
(i) Secure Content Management: SCM is a market that re‡ects corporate customers’ need for policy-based Internet management tools that manage Web content, messaging security, virus protection, and malicious code. SCM is a super-set of three speci…c product areas: Antivirus software, Web …ltering and Messaging security software.
(2) Firewall/VPN Software: The …rewall/VPN market consists of software that identi…es and blocks access to certain applications and data. These products may also include virtual private net-work (VPN) encryption as an option. Software …rewalls fall into two distinct categories: enterprise and desktop. The desktop …rewall is itself divided into corporate and consumer categories.
(3) Intrusion Detection and Prevention Software: Intrusion detection products provide contin-uous monitoring of devices or networks and react to malicious activity. Intrusion prevention is a subset of intrusion detection because you must be able to detect before you can prevent.
(4) Security and Vulnerability Management Software: (SVM) is a comprehensive set of solutions 5
There are also a few other known …rms as well such as Trend Micro, Computer Associates and Internet Security Systems.
6
that collects and correlates events, adds security intelligence to the mix, provides proactive alerts, and suggests …xes. They also automate or semi-automate the process of discovering systems on the network, identifying missing patches and installing those patches across the enterprise immediately or on a scheduled basis.
3.2 Data
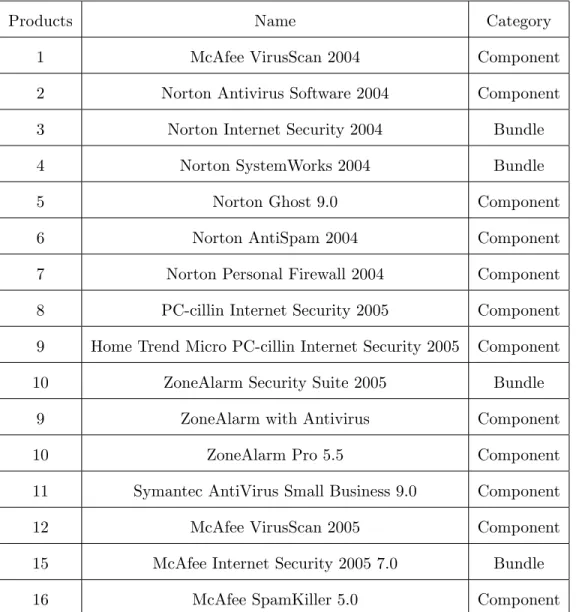
To estimate the model of demand, we compiled a market-level data set on a cross-section of security software vendors, encompassing the above four categories. Our data are compiled from publicly available information on new product prices and sales rankings at Amazon.com. The data are gathered using automated Java scripts to access and parse HTML pages downloaded from the retailer. The data was collected over a 120 day time period from October 2004 to February 2005 and includes 45 individual software titles from the Security Products category. These products include a mix of bundled security suites as well as their individual components. A representative list of our products is given in the Appendix in Table 1. For each sample, we collect data on the Amazon.com sales rank (which serves as a proxy for quantity sold as described in Section 3.3), list prices, new good prices charged by Amazon.com, the date the product was released into the market, the average customer rating for the product and number of reviewers based on which the average rating was displayed. We also collected similar data from Amazon’s marketplace. Note that Amazon allows even some of its competitors like O¢ ce Depot and J&R to sell products on its marketplace. Thus our data also takes into account some of the competitive e¤ects on the retail prices. 7
7
We also have data from Buy.com consisting of sales ranks, list prices and retail prices and so on for the various products in our sample. Buy.com provides sale rankings of all of its products publicly and these sales ranks are also based on actual quantities sold at their site, similar to Amazon.com. The Buy.com data exhibits similar summary characteristics as the Amazon. com data.
3.3 Demand share, revenue share and elasticity estimates
Two recent papers provided a way to map the observable Amazon.com sales rank to the corre-sponding number of books sold. In both cases, the authors …nd on a stable relationship between the ordinal sales rank of a book and the cardinal number of sales, using roughly the following Pareto relationship:
Log(Qi) =K Log(Ri); (7)
whereQi is the demand for product iandRi is its sales rank. Chevalier and Goolsbee (2003) cali-brate this relationship using a creative and easily executed experiment where the authors obtain a book with a known number of weekly sales, purchase several copies of the book in rapid succession from Amazon.com and track the Amazon sales rank before and shortly after their purchase. Using these two points, they estimate =-0.855. Brynjolfsson, Hu and Smith (2003) calibrate this rela-tionship using data from a book publisher mapping the Amazon sales rank to the number of copies the publisher sold to Amazon. The data include weekly sales and rank observations for 321 books with sales ranks ranging from 238 to 961,367 observed over the course of weeks in the summer of 2001. Using these data they estimate = 0:871: Over the next two weeks, we will conduct a similar sales-rank experiment for software titles. For this preliminary analysis, we use the value of = 0:871 that was estimated by Brynjolfsson, Hu and Smith (2003). Notice that since our em-pirical analysis aims to compare assessed variable costs across security and non-security software, so the absolute values of these parameters are unlikely to change our results directionally.
Once we make this assumption about , we can calculate pair-wise demand and revenue shares without any knowledge of K:Additionally, di¤erentiating both sides of (7) with respect to pj and multiplying throughout bypi yields:
pi Qi dQi dpj = pi Ri dRi dpj ; (8)
which in turn implies that we can directly estimate price elasticities from sales ranks without computing demand levels, so long as we have estimates of dRi
regressions of observations over time, and controlling for Amazon marketplace prices, the time since the product was released (Datedi¤), the customer rating (Customer Rating) and the number of reviewers (Number of Reviewers) who have reviewed the product.
4
Preliminary results
We test our …rst hypothesis using three software suites produced by Norton (Symantec), McAfee and Adobe Systems: Norton Anti Virus and Personal Firewall 2004, McAfee Virus Scan and Firewall 2005 and Adobe Photoshop 3.0 and Premier Elements. First, we con…rm trivially by observation that each component of the suite is also sold individually, and therefore, the …rms are using mixed bundling. In order to estimate the optimality of mixed bundling, we assess the extent to which each …rm’s pro…ts would increase by dropping (a) its bundle (that is, o¤ering pure component pricing), and (b) sales of its individual components (that is, o¤ering just a pure bundle).
A multi-product …rm faces two consequences of extending its product line: a “cannibalization e¤ect” and a “revenue generating e¤ect”.8 The former e¤ect captures the encroachment of addi-tional products introduced by the …rm on the market share of the …rm’s existing products. The latter e¤ect captures the fact that introducing a new product expands the …rm’s entire market: either by bringing in new customers who were unserved by existing product lines (the “market expansion” e¤ect) or by poaching its competitors’customers (the “business stealing” e¤ect). The interplay between these e¤ects eventually determines the optimality of extending one’s product line. In our context, a bundle of two or more components can lead to the same e¤ects. It can 8Several empirical studies (Kekre and Srinivasan 1990, Bayus and Putsis 1999) have demonstrated that product
proliferation and in particular line extensions can be a pro…table strategy for managers. Firms compete through their product lines in two ways. First, …rms have an incentive to extend their product lines along a vertically di¤erentiated dimension, in order to extract more consumer surplus. This involves quality based price discrimination. Another kind of line extension is on the horizontal dimension. This is dictated by competitive considerations, particularly to prevent poaching by rival …rms.
potentially cannibalize the market share of the individual components but, at the same time, it can also expand the …rm’s total market share and revenues. Our …rst hypothesis thus aims to test the optimality of mixed bundling for security software products using the same ideas.
To estimate the impact of bundles on individual components and vice-versa, we note that from the de…nition of elasticity, due to competition from individual components, the change in bundled suite sales, Qbi should be given by:
Qbi =Qbi bici
Pbi Pci
Pbi
; (9)
where Qbi is the total number of bundled suites of product i sold per year, bci is the cross
price elasticity of the bundle with respect to prices of the components c1; c2; ::; ci, and the fourth
term corresponds to the average discount of component prices with respect to the price of the bundled suite. Using our cross price elasticity estimates of a bundle with respect to a component product, we compute the number of bundle sales lost due to the concurrent availability of individual components. Similarly, using the elasticity estimates of a component with respect to the bundle, we compute the number of component sales lost, Qci due to the presence of a bundle.
Qci =Qci cibi Pci Pbi Pi k=1 Pbi : (10)
Suppose we want to show that the revenue gain from having componentiis more than the loss due to some units of the bundle being cannibalized by the component. We know thatPci Qciare the
total revenues from Component i. Similarly the revenue loss from the bundle being cannibalized is given by Qbi Pbi. We are thus able to derive the “cannibalization e¤ect" and a “revenue
generating e¤ect of each product, both bundles and individual components. While this does not take into account price changes that the …rm would implement if it were to change its product line, a negative result would indicate that mixed bundling is not optimal (and therefore, while not su¢ cient to establish the optimality of mixed bundling empirically, it seems necessary).
We conduct this analysis for each of our 3 product lines: Adobe, Norton and McAfee. For the Adobe family, our analysis reveals that 19.73% and 13.5% of bundle revenues were cannibalized by the individual components Adobe Premier and Adobe Photoshop, respectively. Similarly, the bundled suite cannibalized 19.5% and 3% of Adobe Premier and Adobe Photoshop revenues, re-spectively. In the same time period, the ratio of the total revenues of Adobe Premier and Adobe Photoshop to that of the bundle, was approximately 34.3. Thus, given the information on prices that we have from the data, our analysis revealed that the gain in revenues from a larger market share (across all three products), more than compensated for the loss due to cannibalization, both due to the bundle as well as the individual components. For the McAfee family, our estimates highlight that 8.1% and 1.5 % of the bundle revenues were cannibalized by two the individual components McAfee VirusScan and McAfee Firewall, respectively. Similarly, the bundled suite cannibalized 9% and 2% of Adobe Premier and Adobe Photoshop revenues, respectively. In the same time period, the ratio of the total revenues of McAfee VirusScan and McAfee Firewall to that of the bundle, was approximately 15.1. Again, given the information on prices that we have from the data, our analysis revealed that the gain in revenues from a larger market share (across all three products), more than compensated for the loss due to cannibalization, both due to the bundle as well as the individual components of the bundle. We obtain similar trends for Norton products. This analysis provides preliminary support for our hypothesis that mixed bundling is indeed optimal for both …rms and thus con…rms Hypothesis 1.9
Next, we compute demand and revenue shares for each of our products, which are then used to compute the markups and the marginal costs of each of our products. Our empirical analysis con…rms that the marginal costs on average for security software are higher than those of non-security software, which provides preliminary support for Hypothesis 2. We also compare bundle discounts for those security products with higher variable cost, and …nd preliminary support for Hypothesis 3. The estimated relative demand ij, however o¤ers mixed evidence. The McAfee
bundle has a higher proportionate demand than the Adobe bundle and this is consistent with the fact that the McAfee family of products has higher marginal costs on an average than the Adobe family of products. However, the Norton bundle seems to have the lowest proportionate demand across all three products.
5
Concluding Remarks
We have presented a theoretical model which relates a security …rm’s pricing strategy to two important aspects that distinguish security software, and have shown how these aspects a¤ect optimal bundle and component pricing. We have provided preliminary empirical validation of some of our analytical results using a unique data set from Amazon.com. Our theoretical analysis in progress will complete the mathematical analysis of our model of oligopoly. We also aim to assess the impact of pricing strategy on the optimal levels of product quality chosen by the seller, and explore an extension to components with asymmetric value. To complete our empirical analysis, we will …rst conduct experiments to estimate for software on Amazon.com. We will then expand the scope of our tests of Hypotheses 1 through 3 to include a larger data set, one we have already complied.
References
[1] Adams, W. and J. Yellen (1976), “Commodity Bundling and the Burden of Monopoly,’ Quar-terly Journal of Economics, 90: 475-498
[2] Bakos, Y. and E. Brynjol¤son (1999), “Bundling Information Goods: Pricing, Pro…ts and E¢ ciency,’Management Science, 45(12): 1613-1630
[3] Bayus, B. and Putsis, W. (1999), “Product proliferation: An empirical analysis of product line determinants and market outcomes,"Marketing Science 18: 137–153.
[4] Brynjolfsson, E., Y. Hu, M. Smith (2003), “Consumer Surplus in the Digital Economy: Esti-mating the Value of Increased Product Variety,”Management Science 49(11) 1580-1596.
[5] Chevalier, J., A. Goolsbee(2003), “Measuring Prices and Price Competition Online: Amazon and Barnes and Noble,”Quantitative Marketing and Economics 1(2) 203-222.
[6] Hausman, J. (1994), “Valuation of New Goods Under Perfect and Imperfect Competition,’ NBER working paper.
[7] Kekre, S. and Srinivasan, K. (1990),“ Broader product line: A necessity to achieve success?,"
Management Science 36: 1216–1231
[8] Manelli, A. and D. Vincent (2005), Bundling as an Optimal Mechanism for a Multiple-Good Monopolist,’Journal of Economic Theory, Forthcoming.
[9] McAfee, P., J. McMillan, and M. Whinston (1989) “Multiproduct Monopoly, Commodity Bundling, and Correlation of Values,"Quarterly Journal of Economics, 104: 371-384.
[10] Nalebu¤, B. (2004b), “Bundling as an Entry Barrier,’Quarterly Journal of Economics, 119(1): 159-187 February.
Products Name Category
1 McAfee VirusScan 2004 Component
2 Norton Antivirus Software 2004 Component
3 Norton Internet Security 2004 Bundle
4 Norton SystemWorks 2004 Bundle
5 Norton Ghost 9.0 Component
6 Norton AntiSpam 2004 Component
7 Norton Personal Firewall 2004 Component
8 PC-cillin Internet Security 2005 Component
9 Home Trend Micro PC-cillin Internet Security 2005 Component
10 ZoneAlarm Security Suite 2005 Bundle
9 ZoneAlarm with Antivirus Component
10 ZoneAlarm Pro 5.5 Component
11 Symantec AntiVirus Small Business 9.0 Component
12 McAfee VirusScan 2005 Component
15 McAfee Internet Security 2005 7.0 Bundle
16 McAfee SpamKiller 5.0 Component