POST OPERATIONS ANALYSIS REPORT
October, 2020
___________________________________________________________________________________________ Page 1 of 17 CCC-CATFM/2020/11/05
___________________________________________________________________________________________ Page 2 of 17 CCC-CATFM/2020/11/05
Contents
A. Executive Summary ... 4
B. Traffic Analysis ... 4
I. Daily ATMs at four major airports ...5
II. Comparison of total ATMs (YoY) and Month wise ...6
III. Air-Traffic Growth (Post COVID Lockdown period) ...8
IV. Flight Operations – Airport wise ...8
V. Flight Operations – Airline wise (Post COVID lockdown period) ...9
C. ATFM Post Operations – CDM Analysis ... 10
I. Introduction ... 10
II. ATFM Measures Overview ... 11
III. Overall Compliance ... 12
IV. CTOT Compliance rate – Airport wise ... 14
V. CTOT Compliance rate – Airline wise ... 15
VI. Air Delay during the CDM Scenario period ... 16
___________________________________________________________________________________________ Page 3 of 17 CCC-CATFM/2020/11/05
List of Figures
Figure 1: Daily ATMs at four major airports - Oct'20 ...5
Figure 2: Percentage Traffic Variation (YoY) ...6
Figure 3: Month wise ATMs at four major airports ...7
Figure 4: Traffic Growth - Post Covid ...8
Figure 5: Busiest Airports in India - Oct’20 ...8
Figure 6: Flight Movements – Airline wise ...9
Figure 7: ATFM Measures - Oct'20 ... 10
Figure 8: Affected Flight Statistics –Oct’20 ... 11
Figure 9: Overall Compliance –Oct’20 ... 12
Figure 10: ATFM Compliance – Month wise ... 13
Figure 11: Airlines Overall Compliance - Oct'20 ... 15
___________________________________________________________________________________________ Page 4 of 17 CCC-CATFM/2020/11/05
A.
Executive Summary
Government of India has now allowed a winter schedule deploying 60% of the originally approved summer schedule for domestic flights whereas the scheduled international flight movements remain suspended till 1829
UTC of 30 Novemebr’20. (NOTAM G0915 replacing NOTAM G0804/20).
Given the gradual and steady revival in domestic air travel, the aviation ministry had recently said that it may soon hike the slots from 60% to 75%. But as of now the 60% cap could remain till February 24, unless there is any change depending on the circumstances.
Even though India has extended its embargo on international flights till 30thNovemeber’20, special international
passenger flights have been operating in India under the Vande Bharat Mission since May and under bilateral air bubble arrangements formed between India and other countries since July. Air bubbles or travel corridors are systems established between two countries that perceive each other to be safe and allow carriers of both the countries to fly passengers either way without any restrictions. Government is also implementing “air bubble”
agreements with countries in order to mitigate a host of quarantine and Covid-19 testing rules at arrival destinations.
“Air bubbles” or “Air bridges” have become the only medium through which commercial international travel has
resumed since mid-July. India now has air bubble arrangements with 15 countries including the US, UK, Germany, France, Afghanistan, Bahrain, Bhutan, Kenya, Canada, Iraq, Japan, Maldives, Nigeria, Qatar, and UAE.
ATFM measures were applied six times for Bengaluru Airport in the month of October’20 due to scheduled Runway
maintenance and inherent scheduling issues. The average CTOT compliance rate was observed to be 73% and 84% of arrivals received an air delay of 10 minutes or less during the period when ATFM measures were in force.
B.
Traffic Analysis
Domestic flight services have resumed in India on May 25, after about two months of suspension due to the coronavirus disease (COVID-19)-necessitated nationwide lockdown.
The total number of ATMs at Indian Airports in Oct’20 (during Covid pandemic) w.r.t. Dec’19(Pre -Covid) is 51.3%. The total Air traffic movement including Passenger and Combination other flights i.e. All-Cargo flights, International scheduled , International non-scheduled , Domestic scheduled,Domestic non-scheduled ,Air taxi & commercial business flights and all other aircraft movements at four major Indian Airports namely Delhi, Mumbai, Bengaluru and Hyderabad is plotted for each day of the month of Oct’20.
The data used is the movement data received from Delhi, Mumbai, Bengaluru and Hyderabad Airport. Airline movement is also plotted for the month for major Scheduled Operators.
___________________________________________________________________________________________ Page 5 of 17 CCC-CATFM/2020/11/05
I.
Daily ATMs at four major airports
Figure 1: Daily ATMs at four major airports - Oct'20
0 100 200 300 400 500 600 700 800 900
A
ir
Tr
aff
ic
M
o
ve
m
e
n
ts
Daily ATMs - October 2020
Mumbai Delhi Bengaluru Hyderabad
___________________________________________________________________________________________ Page 6 of 17 CCC-CATFM/2020/11/05
II.
Comparison of total ATMs (YoY) and Month wise
The graph below depicts the change in total ATMs in the month of Oct’20 in comparison to the total ATMs in Oct’19 for four major Airports in India. The traffic handled at Mumbai in Oct’20 is 57.6% less than the traffic handled in Oct’19 whereas the traffic handled in Delhi, Bengaluru and Hyderabad are 43.7% ,42.2% and 44.8% less than the traffic handled in Oct’19 respectively.
Figure 2: Percentage Traffic Variation (YoY)
Total ATMs (YoY) for four major airports
Airports\Year Oct’20 Oct’19
Mumbai 11893 28064
Delhi 22758 40487
Bengaluru 11683 20218
Hyderabad 8947 16225
-57.6%
-43.7% -42.2% -44.8%
-70% -60% -50% -40% -30% -20% -10% 0%
Mumbai Delhi Bengaluru Hyderabad
%
C
h
an
ge
%Traffic Variations : Oct'20 vs. Oct'19
___________________________________________________________________________________________ Page 7 of 17 CCC-CATFM/2020/11/05
The graph below presents the month wise air traffic movement in the year 2020, at four major Airports.
Figure 3: Month wise ATMs at four major airports
42261
27873
21115
16922
41021
24457
19752
15474
28277
17983
14338
11354
1449 992
502 251
4092
1860 1567
851
12498
4395 5017
3606
14160
5586 5820 5403
16204
6100 7564 6392
19408
9130 9639
8041
22758
11893 11683
8947
Delhi Mumbai Bengaluru Hyderabad
A
TM
s
Total ATMs (Month wise - 2020)
Jan-20 Feb-20 Mar-20 Apr-20 May-20 Jun-20 Jul-20 Aug-20 Sep-20 Oct-20 Data Source: AOCC & ATC Automation
___________________________________________________________________________________________ Page 8 of 17 CCC-CATFM/2020/11/05
III.
Air-Traffic Growth (Post COVID Lockdown period)
The graph below plots the percentage change per month in Air traffic (domestic and international) post Covid Lockdown and resumption of flight operations from May’20. The Indian aviation industry witnessed continued recovery in domestic passenger traffic in October, with a sequential growth over September by 23%.
Figure 4: Traffic Growth - Post Covid
IV.
Flight Operations
–
Airport wise
Figure 5: Busiest Airports in India - Oct’20
22758 11893 11683 8947 7464 6174 4315 2601 2542 2508 0 5000 10000 15000 20000 25000 N o .O f Fl ig h ts
Top 10 Busiest Airports - Oct'20
Data Source: AOCC, ATC Automation & SKYFLOW
7371 8459 8680 9633 10507
27467 30047 34260
46096 56863 0 10000 20000 30000 40000 50000 60000 70000 80000 90000 100000
Jun'20 Jul'20 Aug'20 Sep'20 Oct'20 Nov'20 Dec'20 Jan'20
N o .O f Fl ig h ts
Traffic Growth Post-COVID
International Domestic 9% 14% 3% 14% 35% 11% 23% 9%
___________________________________________________________________________________________ Page 9 of 17 CCC-CATFM/2020/11/05
V.
Flight Operations
–
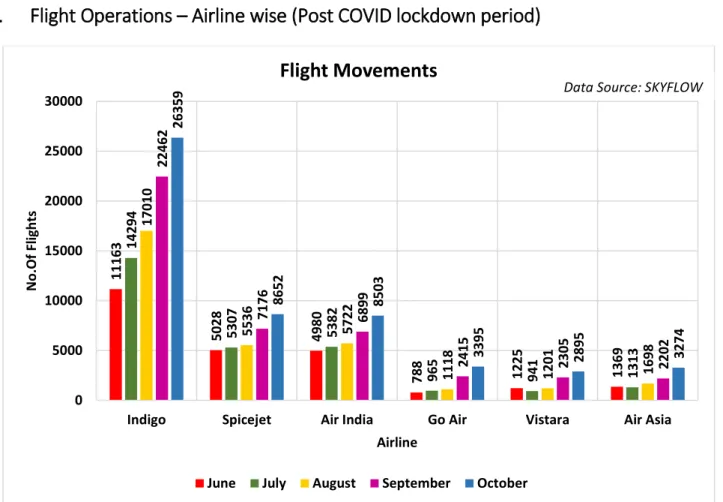
Airline wise (Post COVID lockdown period)
Figure 6: Flight Movements – Airline wise
11163
5028 4980
788 1225 1369
14294
5307 5382
965 941 1313
17010
5536 5722
1118 1201 1698
22462
7176 6899
2415 2305 2202
26359
8652 8503
3395 2895 3274
0 5000 10000 15000 20000 25000 30000
Indigo Spicejet Air India Go Air Vistara Air Asia
N
o
.O
f Fl
ig
h
ts
Airline
Flight Movements
June July August September October
___________________________________________________________________________________________ Page 10 of 17 CCC-CATFM/2020/11/05
C.
ATFM Post Operations
–
CDM Analysis
I.
Introduction
Analysis Period
1st– 31st October’20
Back Ground During the above mentioned period, ATFM measures were applied six(6) times for Bengaluru Airport due to the following reasons as illustrated in the bar chart below:–
Figure 7: ATFM Measures - Oct'20
3 3
0 1 2 3 4 5 6 7
Bengaluru
N
o
. o
f A
TFM
M
e
asu
re
s Ap
p
lie
d
ATFM MEASURES - OCT'20
Inherent Scheduling Issue Scheduled Runway Closure
___________________________________________________________________________________________ Page 11 of 17 CCC-CATFM/2020/11/05
II.
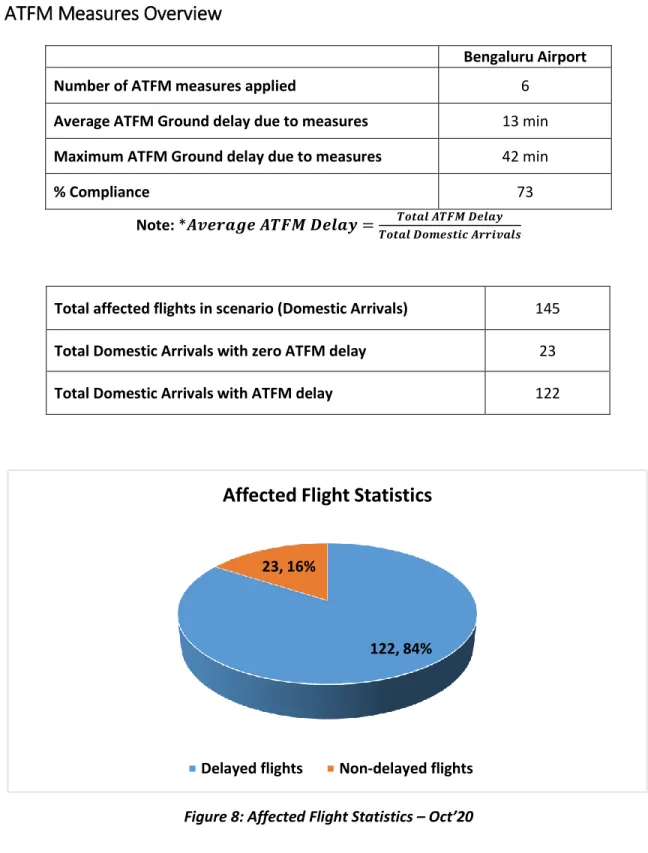
ATFM Measures Overview
Bengaluru Airport
Number of ATFM measures applied 6
Average ATFM Ground delay due to measures 13 min Maximum ATFM Ground delay due to measures 42 min
% Compliance 73
Note: *𝑨𝒗𝒆𝒓𝒂𝒈𝒆 𝑨𝑻𝑭𝑴 𝑫𝒆𝒍𝒂𝒚 = 𝑻𝒐𝒕𝒂𝒍 𝑨𝑻𝑭𝑴 𝑫𝒆𝒍𝒂𝒚 𝑻𝒐𝒕𝒂𝒍 𝑫𝒐𝒎𝒆𝒔𝒕𝒊𝒄 𝑨𝒓𝒓𝒊𝒗𝒂𝒍𝒔
Total affected flights in scenario (Domestic Arrivals) 145
Total Domestic Arrivals with zero ATFM delay 23
Total Domestic Arrivals with ATFM delay 122
Figure 8: Affected Flight Statistics – Oct’20 122, 84% 23, 16%
Affected Flight Statistics
___________________________________________________________________________________________ Page 12 of 17 CCC-CATFM/2020/11/05
III.
Overall Compliance
Total Arrivals 156
Domestic arrivals 145
Flights with complete data (ATOT) 142
Flights with incomplete data 3
Flights Not Operated 0
Compliant* 103
Non-Compliant 39
Total No. of Revised CTOTs issued = 2 (Compliance calculation for flights which were issued revised CTOT is w.r.t. new CTOT issued)
Figure 9: Overall Compliance – Oct’20
NOTE: Flights with required data (i.e. ATOT) are only considered for compliance measurement
103, 73%
39, 27%
Overall Compliance
___________________________________________________________________________________________ Page 13 of 17 CCC-CATFM/2020/11/05
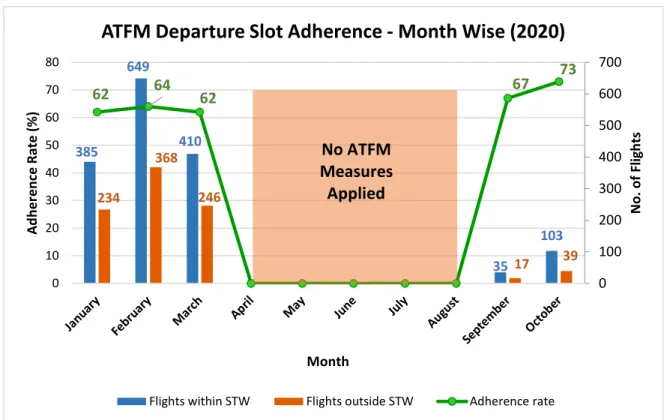
Figure 10: ATFM Compliance – Month wise
Inference
1. Out of the total arrivals captured for the constrained Airports during the CDM scenario , 93% of flights i.e. Domestic arrivals, are participating.
2. Out of these Domestic Arrivals, 84% of arrivals are assigned ATFM ground delay & 16% of flights are without any ATFM ground delay.
3. Out of the total arrivals captured to the constrained Airport during the ATFM scenario, 78% of flights are assigned ATFM Ground Delay.
385 649 410 35 103 234 368 246 17 39
62 64 62 67
73 0 100 200 300 400 500 600 700 0 10 20 30 40 50 60 70 80 N o . o f Fl ig h ts A d h e re n ce R ate ( % ) Month
ATFM Departure Slot Adherence - Month Wise (2020)
Flights within STW Flights outside STW Adherence rate
No ATFM
Measures
___________________________________________________________________________________________ Page 14 of 17 CCC-CATFM/2020/11/05
IV.
CTOT Compliance rate
–
Airport wise
MUMBAI FMP (72%)*
Compliant Non Compliant %Compliant
Ahmedabad 2 2 50
Mumbai 4 2 67
Bhopal 3 1 75
Pune 2 0 100
Surat 4 0 100
KOLKATA FMP (73%)*
Bhubaneshwar 5 0 100
Guwahati 4 2 67
Kolkata 13 2 87
Allahabad 1 3 25
Varanasi 4 2 67
DELHI FMP (70%)*
Delhi 10 2 83
Amritsar 0 2 0
Chandigarh 1 0 100
Jaipur 1 1 50
Lucknow 4 1 80
CHENNAI FMP (74%)*
Chennai 1 0 100
Cochin 4 1 80
Hyderabad 14 2 87
Belgaum 2 2 50
Madurai 3 0 100
___________________________________________________________________________________________ Page 15 of 17 CCC-CATFM/2020/11/05
V.
CTOT Compliance rate
–
Airline wise
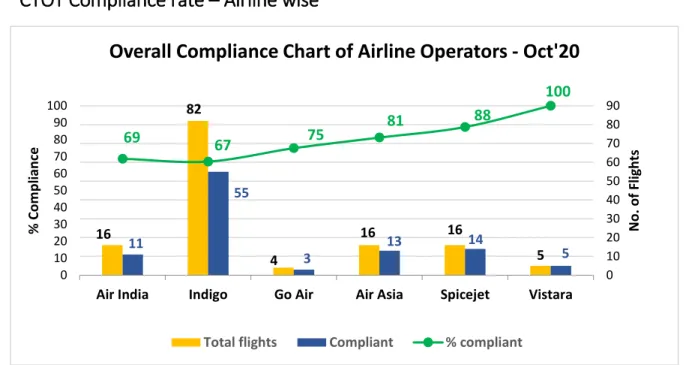
Figure 11: Airlines Overall Compliance - Oct'20
Inference
1. Out of the total domestic arrivals with complete data in the CDM scenario, 73% arrivals are compliant. 2. Chennai region has the highest compliance rate of 74% whereas Delhi region has the lowest compliance
rate of 70%.
3. Go Air, Air Asia, Spicejet and Vistara have a compliance rate above the average recorded 73% compliance.
16 82 4 16 16 5 11 55 3 13 14 5
69 67 75 81
88 100 0 10 20 30 40 50 60 70 80 90 100
Air India Indigo Go Air Air Asia Spicejet Vistara
0 10 20 30 40 50 60 70 80 90 % C o m p lian ce N o . o f Fl ig h ts
Overall Compliance Chart of Airline Operators - Oct'20
___________________________________________________________________________________________ Page 16 of 17 CCC-CATFM/2020/11/05
VI.
Air Delay during the CDM Scenario period
Average Air Delay to domestic arrivals* within the CDM Scenario period for Bengaluru is 4 minutes
*Note: Only calculated for domestic arrivals with both ATOT and ALDT information
Distribution of difference between AET & filed EET
AET-EET min
(time band) <= -10 -9 to -6 -5 to -1 0 to 5 6 to 10 11 to 15 16 to 20 21 to 25 26 to 30 >30
Bengaluru
Flt. Count 9 9 28 50 24 14 7 0 0 0
% flight 6 6 20 35 17 10 6 0 0 0
Figure 12: Cumulative Air Delay during CDM period
Inference
1. 84% of arriving flights to Bengaluru had an Air delay of equal to or less than 10 minutes during the CDM period.
6 12
32
67
84
94 100
0 10 20 30 40 50 60 70 80 90 100
< = -10 < = -6 < = -1 < = 5 < = 10 < = 15 < = 20 < = 25 < = 30 > 30
Per
ce
n
tage
Air Delay in Minutes
Cumulative Air Delay
___________________________________________________________________________________________ Page 17 of 17 CCC-CATFM/2020/11/05
D.
Glossary
ATFM Parameters
Definition
Affected Flight statistics
An insight of participating traffic in the scenario i.e. ratio of the domestic arrivals to the constrained airport affected by ATFM measures (assigned delay by the Ground Delay Program) to the domestic arrivals not affected by ATFM measures (not assigned any delay) within the CDM scenario.
ATFM Ground delay ATFM ground delay defined as CTOT-ETOT (Calculated take off time – Estimated take off time)
Average ATFM delay 𝑻𝒐𝒕𝒂𝒍 𝒎𝒐𝒏𝒕𝒉𝒍𝒚 𝑨𝑻𝑭𝑴 𝒅𝒆𝒍𝒂𝒚 (𝒊𝒏 𝒎𝒊𝒏𝒖𝒕𝒆𝒔)
𝑻𝒐𝒕𝒂𝒍 𝑫𝒐𝒎𝒆𝒔𝒕𝒊𝒄 𝑨𝒓𝒓𝒊𝒗𝒂𝒍𝒔
Maximum ATFM delay Maximum ATFM delay (in minutes) assigned in the month
Overall compliance rate
Defined as monthly ATFM departure slot adherence rate of regulated flights. Flights having ATOT within the ATFM Slot Tolerance Window (STW) of minus 5 to plus 10 minutes of CTOTs, are considered as compliant flights
CTOT Compliance rate of
Airline operators An overview of CTOT compliance rate of various Airline operators
CTOT Compliance rate of Airports within different
Regions
An overview of CTOT compliance rate of Airports within 4 FIRs
Air delay statistics
Air delay defined as difference between AET & EET, where AET(actual elapsed time) can be obtained from (ALDT-ATOT) and estimated elapsed time(EET)can be obtained from FPL/RPL or (CLDT-CTOT). Therefore, Air delay = AET-EET Average Air Delay is calculated as:
𝑨𝒗𝒆𝒓𝒂𝒈𝒆 𝑨𝒊𝒓 𝑫𝒆𝒍𝒂𝒚
=𝑻𝒐𝒕𝒂𝒍 𝑨𝒊𝒓 𝑫𝒆𝒍𝒂𝒚 𝒕𝒐 𝒅𝒐𝒎𝒆𝒔𝒕𝒊𝒄 𝒂𝒓𝒓𝒊𝒗𝒂𝒍𝒔 (𝒘𝒊𝒕𝒉 𝒗𝒂𝒍𝒖𝒆𝒔 𝒈𝒓𝒆𝒂𝒕𝒆𝒓 𝒕𝒉𝒂𝒏 𝒛𝒆𝒓𝒐)
𝑻𝒐𝒕𝒂𝒍 𝑫𝒐𝒎𝒆𝒔𝒕𝒊𝒄 𝑨𝒓𝒓𝒊𝒗𝒂𝒍𝒔
CLDT: Calculated Landing Time CTOT: Calculated Take off Time ALDT: Actual Landing Time ATOT: Actual Take off Time