Automatic Optic Disc Detection and Removal of False
Exudates for Improving Retinopathy Classification
Accuracy
G.Ferdic Mashak Ponnaiah
*, Capt.Dr.S.Santhosh Baboo
***
Research Scholar, Dept of Computer Science and Engineering,Bharathiar University,Coimbatore
**
Associate Professor, PG & Research Center, Dept of Computer Science,D.G.Vaishnav College, Arumpakkam, Chennai
Abstract- Detection of Optic disc (OD) in a fundus image is one of the important step in the process of automated screening of diabetic retinopathy. Hard Exudates detection algorithms generally find lot of false positives at the OD region since the intensity and colour distribution of OD region will much resemble that of a Hard Exudates region. So, most of the Exudates detection algorithms will wrongly classify the pixels at the OD region as Hard Exudates or Soft Exudates.
In our previous work, we used Genetic Algorithm(GA) to find the OD location and size and reduced overall time, even doing the search on the entire problem space. In this work we are going to remove false hard exudates and will improving Retinopathy detection accuracy using GA based automatic optic disc detection and removal method. We are going to use the outputs of baseline hard exudates detection method presented in the of DIARETDB1[8] for evaluating the improvement after the removal of false positives in the OD region. We will evaluate the improvement in performance using the more versatile metric ‘weighted error rate’ (WER). After removing false positives at OD region by manual removal method and the proposed automatic removal method, we will compare the results of baseline method for evaluating the improvement in classification accuracy.
Index Terms- Diabetic Retinopathy, Hard Exudates Detection, Genetic Algorithm, Optic Disc Detection.
I. INTRODUCTION
he most serious diabetic eye condition involves the retina and is called diabetic retinopathy(DR). This condition is very common in people who have had diabetes for a long time. The rapid increase of diabetes pushes the limits of the current DR screening capabilities for which the digital imaging of the eye fundus (retinal imaging), and automatic or semi-automatic image analysis algorithms provide a potential solution. The eye fundus structures, such as blood vessels, vascular arcade, optic disc, macula and fovea, are an essential part in diagnosis of diabetic retinopathy, and fundamental to the subsequent characterization of the disease.
It is important to detect and isolate OD region because, most of the algorithms designed to segment/detect abnormalities such as Hardexudates will detect lot of false positives in OD region. In other words, most of the pixel intensity and colour based abnormality detection algorithms will detect OD region as
a abnormality. So, the false positives in the OD region should be eliminated from the calculations of accuracy of a abnormality detection algorithm. Optic disc (OD) detection is a main step while developing automated screening systems for diabetic retinopathy.
Diabetic Retinopathy
Diabetic Retinopathy is a diabetic eye disease leads to blindness. Retina is a light sensitive tissue at the back of the eye and it is responsible for the vision. The changes in the retinal blood vessels such as swelling of the vessel, leakage of fluid affects the surface of the retina. The resulting diseases are Micro aneurysms, Hemorrhages, Cotton wool spots, Soft exudates and hard exudates. Research indicates that 90% of the new diabetic cases can be prevented from loss of vision by regular screening and monitoring of the retinal image. Digital image processing can play a vital role in detecting the above diseases with good accuracy in all metrics.
Eye Fundus Imaging
[image:1.612.349.537.568.710.2]Fundus imaging is a common clinical procedure used to record a viewing of the retina. This image may be used for diagnosis, treatment evaluation, and the keeping of patient history. These images are captured using fundus camera which is a specialized low power microscope with an attached camera. Fundus photography is also used to document the characteristics of diabetic retinopathy (damage to the retina from diabetes) such as macular edema and microaneurysms. This is because retinal details may be easier to visualize in stereoscopic fundus photographs as opposed to with direct examination[18].
Figure 1. The Anatomical and Pathological Parts in Retinal Images
Hard Exudates
Hard Exudates are formed in the retina by the clustering of protein and lipid leakage from the damaged blood vessel. They are diverse in size and forms and vary in numbers. Hard exudates are highly reflective and bright yellowish in color with the well defined margin as shown in the figure[1].
The Optic Disc (OD)
The OD is the exit point of retinal nerve fibers from the eye, and the entrance and exit point for retinal blood vessels. It is a brighter region than the rest of the ocular fundus and its shape is usually round. The location of OD is important in retinal image analysis, for example, to help locate anatomical and pathological parts in retinal images (e.g. the fovea), for blood vessel tracking, as a reference length for measuring distances in retinal images, and for registering changes within the optic disc region due to diseases such as glaucoma and the development of new blood vessels (which is very dangerous). The central portion of disc is the brightest region called optic cup or optic disc, where the blood vessels and nerve fibers are absent. In a colour retinal image the optic disc belongs to the brighter parts along with some lesions. Applying a threshold may separate part of the optic disc and some other unconnected bright regions from the background[4]. How ever, further processing will be needed to separate the OD only region from the image. So, the detection of exact location of OD is a important task and it is still a challenging task. The localization of optic disc is important for several reasons. The OD location serves as the baseline for finding the exact boundary of the disc[4]. Optic disc center and diameter are used to locate the macula in the image. In some methods and practices, OD location of the fundus image is used as a reference point or registration point. Further, false detections at the OD regions should be eliminated from the calculations of accuracy for that the exact region of OD should be known.
Problem Definition
Hard exudates detection is generally done by clustering the colour histogram values. The exudates detection algorithms generally find lot of false positives at the OD region since the intensity and colour distribution of OD region will much resemble that of a hard or soft exudates region. So, most of the exudates detection algorithms will wrongly classify the pixels at the OD region as hard exudates or soft exudates based on the intensity distribution at that location.
So it is important to isolate the OD region and treat it in a different way to avoid the detection of false positives at that region. Generally, the intensity of the pixels at OD region is used to separate it from the rest of the image using a suitable intensity based thresholding techniques. But the intensity based techniques may give more than one potential location of OD from a typical fundus image since there may be brighter regions which may resemble OD. The sophisticated template matching techniques such as [1] and [2]. will search all possible pixel locations for the best matching location. This sliding window operation used in template matching is time consuming one. In our earlier work we proposed a fast GA based method for detecting location and size of the OD in a eye fundus image. Tomi Kauppi1 et.al, of University of Tampere provided DIARETDB1 diabetic retinopathy database and a evaluation
protocol for evaluating the algorithms of diabetic retinopathy. They provided a baseline method for detecting different abnormalities form the retinal image. The base line algorithm may find lot of false positives in the OD region. In this work, we propose the use of GA based, automatic optic disc detection and removal of false exudates for improving retinopathy classification accuracy. The proposed algorithm will eliminate the false positives at the OD region and improve the overall classification accuracy.
II. ELIMINATIOM OF FALSE HARDEXUDATES USING
GA BASED AUTOMATIC OPTIC DISC DETECTION
AND REMOVAL
A. The Overal Design of False Hard Exudates Elimination using GA based Automatic Optic Disc Detection and Removal
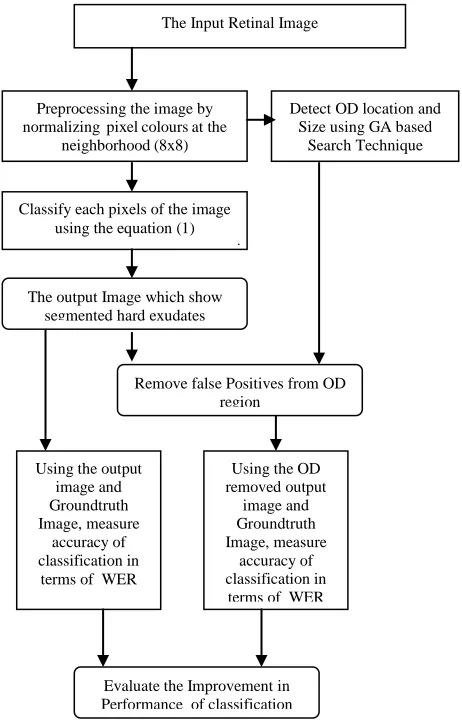
[image:2.612.325.556.288.648.2]The following diagram shows the simple sketch of the overall design of the proposed model for automatic removal of false exudates at OD region.
Figure 1. The Proposed Model for Automatic Removal of False Exudates at OD Region
B. Hard Exudates Detection Using Baseline Method
This baseline method provided with DIARETDB1 is based on the principle that different findings can be distinguished and detected based only on their photometric information, i.e. colour.
Preprocessing the image by normalizing pixel colours at the
neighborhood (8x8)
Classify each pixels of the image using the equation (1)
Using the output image and Groundtruth Image, measure
accuracy of classification in
terms of WER
The output Image which show segmented hard exudates
The Input Retinal Image
Detect OD location and Size using GA based
Search Technique
Remove false Positives from OD region
Using the OD removed output
image and Groundtruth Image, measure
accuracy of classification in terms of WER
This method used colour locus based face detection by Hadid et al. [] to design a multi-class diabetic retinopathy detection. This method utilises two colour channels R and G without intensity component. A colour locus for each finding type, Fi , is defined
by forming their colour histograms
h
Fi(
r
,
g
)
. The histogramsare computed from the intensity normalised pixel colours at the neighborhood (8x8) of the most representative points marked by the experts. By using the colour histograms of findings,
)
,
(
r
g
h
i
F , and a test image itself,
h
Fi(
r
,
g
)
. Schwerdt andCrowley [] have derived a formula for the Bayesian decision rule to classify a pixel with color (r,g) to one of the finding classes. The formula reduces to the histogram ratio of finding and test
image:
In this model they manually select an optimal posterior threshold for every finding type and compute the sum of pixels having higher or equal posterior value as the image based score.
C. The Different Aspects of Proposed OD Detection Algorithm
In the proposed method, the OD location will be detected using blue channel of the image of green channel of the image based on the intensity estimate on blue channel of the image. Further, instead of searching all the possible locations of better matching location, the GA will search the entire space in a fast manner by considering all the potential regions.
I.. The Channel Selection based on Intensity Estimate
Let I be the colour fundus image which has three layers R,G and B
I = { R, G, B }
Find the intensity estimate B at blue layer
0
,
)
(
(, )1 ) , (
1
j i m
i j i n
i
B
B
n
m
B
…………..(2)
So the normalized intensity estimate B may have value
between 0 and 1. If it is 0 then it means, all the blue layer pixels are having value equal to 0. If it is 1 then it means, all the blue layer pixels are having values greater than 0.
Even though the blue layer pixel will have values near zero, and will not be visible if we try to display that layer. If 50 % percent ot the pixels will have greater than 0 values, then we can use the green layer as the target image to detect the OD else we may use the green layer as target image.
If B >
//set Blue Layer as target Image T=B
Else
//set Green Layer as target Image T=G
End
In this experiment, we used the threshold = 0.5 to dicide whether to use blue layer of green layer for detecting the OD.
II. The Design of GA for OD detection
After selecting the suitable channel by using the above equation 1, the optimum OD location will be found using GA.
The 4 variables i,j,r1, and r2, which will decide the
optimum location and size of the OD should be represented in GA.
The lower bound of i,j,r1, and r2 are set as 150,150 0
0.The upper bounds i,j,r1, and r2 are set as 1152-150,1500-150
0 0 where 1152 x 1500 is the size of the fundus image in which we are going to find the OD location.
The GA was seeded with the initial population with approximate mid range of these 4 variables as 575,750,5 5. The GA applied for detecting the OD will be in the following form. The algorithm will search of optimum location and size of the OD in the target fundus image T. and will find a OD with in the radius of minumum expected radius rmid and
maximum expected radius rmax. On each iteration, the best
candidate location is selected based on the intensity estimate given by equation 2 of the fittness function.
Function GA_OD_Detect begin
INITIALIZE population with random candidate solutions;
(Each random candidate solution will represent 4 variables i,j,r1, and r2)
EVALUATE each candidate;
(find fitness of each candidate using the fitness function)
repeat
SELECT parents;
(Select two candidate having best fitness value)
RECOMBINE pairs of parents;
(use single point crossover on the selected candidates and generate new population – this includes the original parents)
MUTATE the resulting children;
(use gaussian mutation on entire population)
EVALUATE children;
(find fitness of all new candidates of the population)
until TERMINATION-CONDITION is satisfied end
Mark OD on the fundus image using the final optimum values of i,j,r1, and r2
Figure 1. The GA of OD detection
III. THE FITNESS FUNCTION
The following function is used to find the fitness at the location i,j. The point which has the lowest fitness vaue will be the potential cener of the OD.
) 1 ...( ... ) , (
) , ( )
, | (
g r h
g r h g r F p
total F i
i
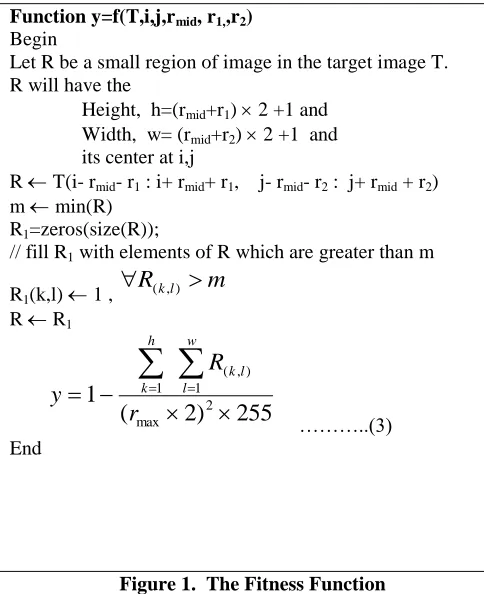
Function y=f(T,i,j,rmid, r1,,r2)
Begin
Let R be a small region of image in the target image T. R will have the
Height, h=(rmid+r1) 2 +1 and
Width, w= (rmid+r2) 2 +1 and
its center at i,j
R T(i- rmid- r1 : i+ rmid+ r1, j- rmid- r2 : j+ rmid + r2)
m min(R) R1=zeros(size(R));
// fill R1 with elements of R which are greater than m
R1(k,l) 1 ,
m
R
kl
( ,)R R1
(
2
)
255
[image:4.612.41.283.56.353.2]1
2 max 1 ) , ( 1
r
R
y
w l l k h k ………..(3) EndFigure 1. The Fitness Function
Where
Y - is the fittness of the function f
T – is the target image in which we have to locate the OD i,j – the center of the guessed OD location
rmin – minumum expected radius of the OD
rmax,- maximum expected radius of the OD
r1, - the small change in Height
r2 - the small change in width
At the exact location of OD, the above function y=f(T,i,j,rmid,
r1,,r2) will give the most optimum minimum value.
In this implementation, we set the limit of i,j as follows : i > 150 and i < (Height of the T – 150)
j > 150 and j < (width of the T – 150) The allowed change in radius = c = 10 rmid=90
rmin = rmid-c = 80
rmax= rmid+c = 100
So the algorithm will find a OD of arbitray size between 161x161 to 201x201.
We used the Genetic Algorithm tool box of matlab to implement this OD detection algorithm. We set Generations as 20,‘Population Size as 200 and used single point crossover. And for other parameters, the default values of the GA tool box is assumed.
D. Metric Used for Evaluating the Performance of Hard Exudates Detection
The classification accuracy of the diagnosis is assessed using the sensitivity and specificity measures. Following the practises in the medical research, the fundus images related to the diabetic retinopathy are evaluated by using sensitivity and
specificity per image basis. Sensitivity is the percentage of abnormal funduses classified as abnormal, and specificity is the percentage of normal fundus classified as normal by the screening. The higher the sensitivity and specificity values, the better the diagnosis. Sensitivity and specificity can be computed as ) 4 ...( ... ) ( , ) ( P N N N P P F T T SP y Specificit F T T SN y Sensitivit
The metric Equal Error Rate (EER) measure assumes equal penalties for the both false positives and negatives, which is not typically the case in the medical diagnosis. Therefore, in [1] they adapt a more versatile measure utilized in [6] and [7], where the two measures, sensitivity (SN) and specificity (SP), are combined to a weighted error rate defined as
) 5 ...( ... 1 ) 1 ( ) 1 ( 1 ) ( R SN R SP R FNR R FPR R WER
IV. RESULTSANDDISCUSSION
DIARETDB1 Database
This database consists of 89 colour fundus images of which 84 contain at least mild non-proliferative signs (Ma) of the diabetic retinopathy, and 5 are considered as normal which do not contain any signs of the diabetic retinopathy according to all experts participated in the evaluation[8]. The images were taken in the Kuopio university hospital. It, containing the ground truth collected from several experts and a strict evaluation protocol. The protocol is demonstrated with a baseline method included to the available tool kit. It provides the means for the reliable evaluation of automatic methods for detecting diabetic retinopathy.
Training and test set
The 89 images were manually assigned into categories representing the progressive states of retinopathy: normal, mild, moderate and severe non-proliferative, and profilerative. Using the categories, the images were divided into the representative training (28 images) and test sets (61 images)[8].
The model histograms used in the baseline method are originally computed from the intensity normalised pixel colours at the neighborhood (8x8) of the most representative points marked by the experts used in baseline method using the training images. In the training set with confGT = 0.75, 18 images
contain hard exudates, 6 soft exudates, 19 microaneurysms, and 21 hemorrhages. In the test set with conf GT = 0.75, 20 images
contain hard exudates, 9 soft exudates, 20 microaneurysms, and 18 hemorrhages[8].
Advantages of the proposed OD Detection method:
It is obvious that the proposed OD Detection method will only consume lesser time than the other previous methods since there is no complex operations such as FFT(Fast Fourier Transform), PCA(Principal Component Analysis) and eigenvector calculations involved in it. Further, the optimization technique will converge very fast since it will randomly chose potential OD locations and will find a optimum location from a limited set of locations. On the other hand, for better results, the other two methods should do the calculations at every possible OD locations/ pixels of the image under consideration from a 1500 x 1152 size fundus image
Sample Output Shows the Automatic Removal of False Possitives from OD Region
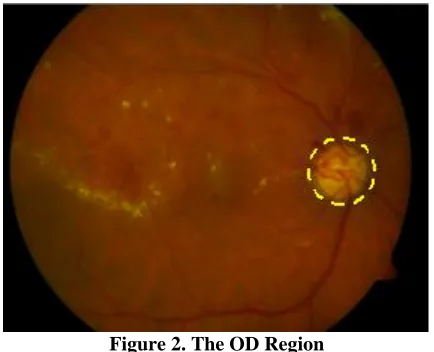
[image:5.612.336.553.100.269.2]The following is the image016 of DIARETDB1 database. We mark the region of OD in that image with a yellow circle.
Figure 2. The OD Region
[image:5.612.59.276.263.439.2]The following is the ground truth image showing the confidence levels of the Hard Exudates in that particular image016. It is obvious that there is no Hard Exudates present in the region marked with yellow circle.
Figure 3. The OD Region in Groundtruth Image
The following image shows the Hard Exudates regions of the image016 detected by the baseline algorithm. It is obvious there are lot of false positives in the OD region and they were
wrongly wrongly itentified as Hard Exudates because of the intensity distribution in that region. This region of false positives are marked with yellow circle.
Figure 4. The False Positives at OD Region
The following image is the output after automatic OD removal by GA. The false positives inside the region marked with yellow circle were automatically removed from the output.
Figure 5. The False Positives Removed from OD Region
[image:5.612.60.276.508.670.2]In [8] it is denoted that the WER values should be reported in results while comparing the different methods. But in the following Table, we also present the corresponding false positive and negative rates specificity and sensitivity.
Table 1. The Performance Before and After Removal of False Positives at OD Region
Performan ce with Different Method
FPR FNR WER Specifici
ty
Sensitivit y Baseline
Method
0.073 0.250 0.162 0.927 0.750 After
Manual OD Removal
0.220 0.100 0.160 0.780 0.900
After GA Based OD
[image:5.612.316.577.592.735.2]Removal
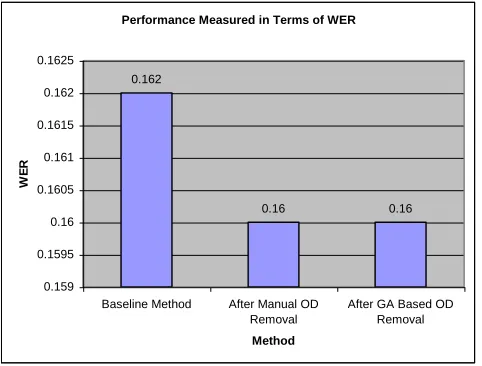
WER is a more versatile and balance metric, we considered this only as the main metric while evaluating the improvement in performance. The following graph shows the improvement in performance after removing false positives at the OD region.
Performance Measured in Terms of WER
0.162
0.16 0.16
0.159 0.1595 0.16 0.1605 0.161 0.1615 0.162 0.1625
Baseline Method After Manual OD Removal
After GA Based OD Removal Method
W
E
[image:6.612.48.289.143.326.2]R
Figure 6. The Performance in Terms of WER
As shown in the above graph, there was 2% drop in weighted error rate after removing the false positives at the OD region. The performance of GA based false positive removal method gives the same result of manual removal method and proves the good working of automatic false positive removal method.
V. CONCLUSION
We have successfully implemented the proposed automatic method for optic disc detection and removal of false exudates for improving retinopathy classification accuracy. To evaluate the performance of the automatic method of removal of false exudates at OD region, we compare the WER of the outputs of the original baseline method as well as the WER of the manually removed false positives at OD region from the another set of outputs of the original baseline method.
Most of the previous methods failed in detecting OD in brighter images were the intensity of OD region is almost similar or higher than the several other regions in the target image. But, proposed method was successful in finding OD in fundus image with both brighter and darker image intensities. The GA based search algorithm was very fast in locating the OD location. The accuracy of the detected location was very much depend up on the matching policy. So, the future work may address more efficient matching policies. Since GA is reducing overall search time considerably, we may even consider much complex matching policies to improve the accuracy of location and size of the OD.
The proposed GA based optic disc detection method is very faster than other two compared methods and is fining the optimum OD location using the intensity on blue and green layer. The proposed method achieved good accuracy and speed. For
example, in the image image004 the Li and Chutatapes Method failed to detect exact OD location because of the poor intensity at the OD region. But, in this case, our proposed method will use blue channel information so that, it will find the exact location more precisely than the other two methods.
In this work, a simple intensity estimation method is used in the fitness function of the GA. In future works, we may consider more complicated matching polity in the fitness function of the GA. Future works will address the ways to improve the pixel-wise accuracy of detection.
REFERENCES
[1] Tomi Kauppi, Heikki Kälviäinen, "Simple and Robust Optic Disc Localisation Using Colour Decorrelated Templates", Advanced Concepts for Intelligent Vision Systems, 10th International Conference, ACIVS 2008, Juan-les-Pins, France, October 20-24, 2008.
[2] Li, H., and Chutatape, O. Automatic location of optic disk in retinal images. In Proceedings of the International Conference on Image Processing (ICIP2001) (Thessaloniki, Greece, 2001), vol. 2, pp. 837-840. [3] Turk, M. A., and Pentland, A. P. Eigenfaces for recognition. Journal of
Cognitive Neuroscience 3, 1 (1991), 71-86.
[4] Jaspreet Kaur and Dr.H.P.Sinha, "Automated Localisation of Optic Disc and Macula from Fundus Images", International Journal of Advanced Research in Computer Science and Software Engineering Volume 2, Issue 4, April 2012
[5] Xie, X., and Mirmehdi, M. Localising surface defects in random colour textures using multiscale texem analysis in image eigenchannels. In Proceedings of the International Conference on Image Processing (ICIP2005) (Genova, Italy, 2005), vol. 3, pp. 837-840.Xie, X., and Mirmehdi, M. Localising surface defects in random colour textures using multiscale texem analysis in image eigenchannels. In Proceedings of the International Conference on Image Processing (ICIP2005) (Genova, Italy, 2005), vol. 3, pp. 837-840.
[6] P.J. Phillips, H. Moon, S.A. Rizvi, and P.J. Rauss. The FERET evaluation method- ology for face-recognition algorithms. IEEE Trans. on Pattern Analysis and Ma- chine Intelligence, 22(10), 2000.
[7] E. Bailliere, S. Bengio, F. Bimbot, M. Hamouz, J. Kittler, J. Mariethoz, J. Matas, K. Messer, V. Popovici, F. Poree, B. Ruiz, and J.P. Thiran. The BANCA database and evaluation protocol. In Proc. of the Int. Conf. on Audio- and Video-Based Biometric Person Authentication, pages 625-638, 2003.
[8] Tomi Kauppi1 et.al, "DIARETDB1 diabetic retinopathy database and evaluation protocol", University of Tampere, Perimetria Ltd., Helsinki, Finland
[9] Meindert Niemeijer, Bram van Ginneken, Stephen R. Russell, Maria S.A. Suttorp-Schulten,MichaelD.Abràmoff, "Automated Detection and Differentiation of Drusen, Exudates, and Cotton-Wool Spots in Digital Color Fundus Photographs for Diabetic Retinopathy Diagnosis",Investigative Ophthalmology and Visual Science, Vol.48, pp.2260-2267, 2007.
[10] Dr.lee Kai Yuen(private practice) Tsang CY Luke, Lam Hon Man,et.al.(Family Medicine Service,Department of Health,HKSAR). [11] C.Jayakumari and T.Santhanam, "Detection of Hard Exudates for Diabetic
Retinopathy Using contextual Clustering and Fuzzy Art Neural Network", Asian Journal of Information technology, Vol.6,No8,pp.842-846,2007. [12] C.Jayakumari and T.Santhanam,"An intelligent approach to detect hard and
soft exudates using echo state neural network", Information Technology Journal 2008.
[13] Automatic detection of hard and soft exudates in fundus images using color histogram thresholding. S.kavitha, K.Duraisamy , European Journal of scientific research.
[14] Automatic Exudates detection in diabetic retinopathy images using digital image processing algorithm. P.Aravindhan, P.N.Jebarani sargunar , proceedings on information science and applications ICISA 2010, Chennai, India.
[16] Akara Sopharak, Bunyarit Uyyanonvara, Sarah Barman, "Automatic Exudate Detection from Non-dilated Diabetic Retinopathy Retinal Images Using Fuzzy C-means Clustering", Journal of Sensors, Vol.9, No.3, pp.2148-2161, 2009.
[17] Gonzalez .R and R.Woods 1993 Digital Image Processing, Addison - Wesley press.
[18] Sterio fundus photography:principles and techniques marshall E.tyler,CRA,FOPS
[19] Madhuri A.Joshi, Digital Image Processing, An algorithmic Approach
AUTHORS
First Author – G.Ferdic Mashak Ponnaiah, Research
Scholar,Dept of Computer Science and Engineering, Bharathiar University, Coimbatore, Email: [email protected]
Second Author – Capt.Dr.S.Santhosh Baboo, Associate
Professor, PG & Research Center, Dept of Computer