Convention Paper
Presented at the 118th Convention 2005 May 28–31 Barcelona, Spain
This convention paper has been reproduced from the author's advance manuscript, without editing, corrections, or consideration by the Review Board. The AES takes no responsibility for the contents. Additional papers may be obtained by sending request and remittance to Audio Engineering Society, 60 East 42nd Street, New York, New York 10165-2520, USA; also see www.aes.org. All rights reserved. Reproduction of this paper, or any portion thereof, is not permitted without direct permission from the
Journal of the Audio Engineering Society.
Program Loudness: Nuts & Bolts
Jean Paul MoermanVRT
Belgian National Broadcasters for the Flemish Community August Reyerslaan 52, B-1043 Brussels Belgium
ABSTRACT
Program loudness is still one of the topics of discussion between broadcasters. This paper is not another attempt to give explanation on the causes. Instead it’s a practical guide how the problem for the viewer has been solved at VRT, Belgium’s National Broadcaster. Program makers are to be convinced of the importance of sound to get their message to the viewer. The technical management have to realize the necessity of processing units all over the production chain. Settings have to be carefully integrated throughout every department. How the settings are achieved and convincing the management is one of the many topics described in this practical paper.
1. PERCEPTION
How to get the message across is one of the goals of the sound department at every broadcaster. ‘But does it have to be that loud! ’, is one of the main complaints of their viewers. Often the program makers insist to be the loudest and this turns out contra productive. One of the many topics in this paper is how to convince them with something they know (and fear): viewing figures.
1.1. Viewer complaints
Nevertheless let’s start with something else and perhaps more familiar, viewer complaints. Not these are the problem, but we broadcasters seem to be the cause of this never ending story. Complaints about audio level-differences during broadcasting of programs: annoying trailers and commercials, dialogue to difficult to identify and to understand, too loud music
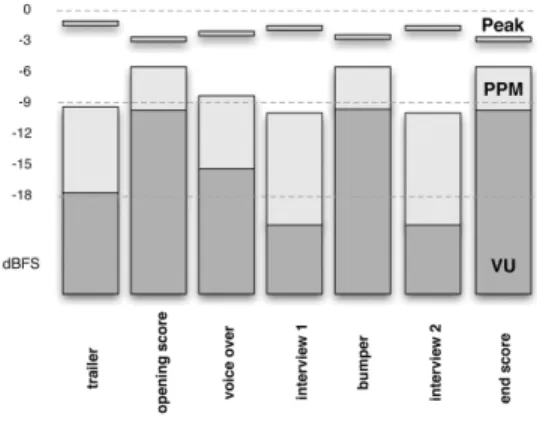
Figure 1 typical talk show
Above figure illustrates the perceived loudness in the darkest parts, which represents the amount of energy. Viewers were extremely annoyed by the sudden jumps in levels. The sound engineer possessed only a digital
1.2. Modulation in a digital environment
Sound engineers are tempted to modulate with 18dB crest factor in a digital TV-recording studio. As a matter of fact some don’t use any compression at all due to de availability of such a tremendous dynamic range. In doing so they create a too large dynamic range: music, opening score, jingles too loud and/or dialogues too difficult to understand. To convince sound engineers to use reference monitoring and to take the presenters voice as a reference is also described in a master plan. It should result in omitting exaggerated dynamic range or trivial listening to dialogue.
1.3. How to measure loudness
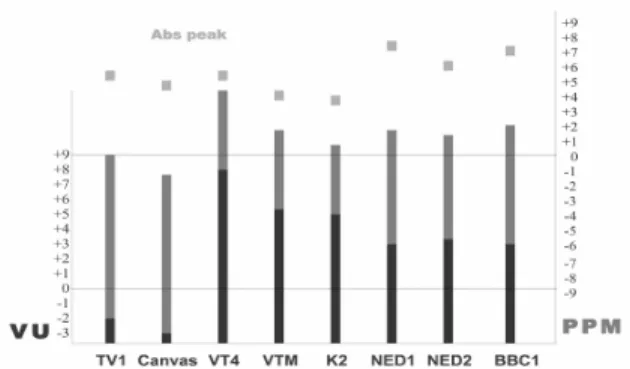
As a member of the VRT sound quality team I went home and watched television with the help of some equipment. First of all a PPM 10ms meter (VRT standard) was connected to the television set. The nominal level was set around 0dB for voices on VRT’s TV1 program. Zapping from one channel to another resulted in following figure.
Figure 2 zapping between different stations Measurement with a 10ms PPM meter (grey scale) reveals only a difference of 2-3dB. This was not the perceived loudness difference for the audience. Next step was to measure the same signals with an (old) VU meter (dark scale). The perceived loudness was visualized. Together with the absolute peak (1 sample), the average to peak was visible too. For VRT broadcasts this results in an average to peak of 18dB, BBC and NED (Dutch national broadcasters) 13dB, and the Flemish commercial broadcasters 7-8dB. VRT was about 5dB less loud compared to BBC and NED, and even an incredible 11dB less then VT4. VRT to faint or the others to loud? The viewers were right in their complaints about loudness differences.
1.4. How much compression is needed
Should we take the commercial bashed sound with an average to peak of 6dB or …? This question was raised in the sound quality team. It was decided to use more compression to gain a result of an average to peak of 12-14dB. This compression should first of all be gained in the console which have dynamics in the microphone input. They should be used to match the loudness differences from live microphones with line sources as VTR’s and other playback equipment which contain mixed voice-overs and other finished material. The final mix should pass a processor at the studio outlet which keeps the signal into the average to peak window of 14dB. But compression is not the whole story. Therefore a study was conducted and resulted in a master plan.
2. THE MASTER PLAN
The advice of the sound quality team and the results of a listening panel were decisive. The panel was composed of people from the sound quality team, technical management and program makers. The last ones were a good addition because they felt concerned and got involved. The amount of processing units (every unit in the production chain) deterred at first the technical management, but this argument was quickly omitted by the fact that more then ‘75% of viewer complaints’
was on program loudness. Viewers do not complain as rapidly on poor video quality or wrong lighting. The expense justified the gain of viewer appreciation.
2.1. The basics
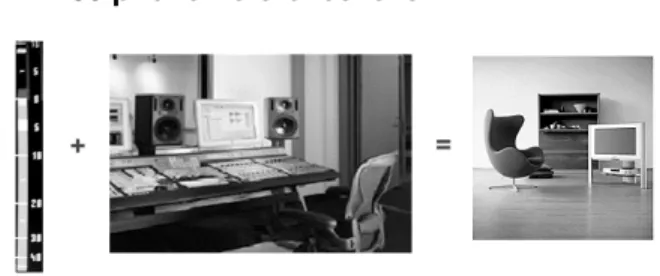
Figure 3 the basic rule
The viewer has only his ears to perceive the sound. This should be the starting point for every sound
engineer. Surrounded with additional features as reference monitoring, processing units and PPM-meters, overall control on sound should be maintained within acceptable levels.
2.2. REFERENCE MONITORING 2.2.1. General
By creating the same SPL in the studio as in an average home environment the sound engineer has better control over the loudness perception of the audience.
The dynamics of films are mutual consistent. Even trailers and commercials are (mostly) coherent. Since the seventies a reference of 83dB SPL for 0VU pro channel has been used. By using this reference during recording the sound engineer perceives the same dynamic range as the audience in the movie-theatre. Due to the fact that a DVD-playback at home needs a reduced dynamic range, the reference is also reduced to 77dB SPL pro channel. The environment of a sitting room does not equal the size or the acoustics of a theatre. Observe that the dynamics and reference level are reduced for home playback.
2.2.2. ’80 phone’ reference level
Figure 4 reference monitoring
At VRT a playback level of 80 phone is used since the seventies (stereo 77dB+77dB=80). In time this reference has been neglected and was one of the many causes, which lead to loudness problems. To loud fragments causing troubles with the neighbors or to weak passages that render dialogue inaudible. A re-introduction of the 80 phone reference was a logical step. The sound engineer has to use his ears to avoid to loud mixed programs that translate in a poor bas reproduction on a TV-set. To loud monitoring also results in a to large dynamic range. The viewer will turn down the volume during music or intros, but then dialogues appear to weak and ambient sounds inaudible. To soft mixed programs result in a dull and uninteresting sound because everything sounds with the same loudness. The use of a reference monitoring in all
facility units within the VRT is necessary but also monitoring of trailers and commercials should happen under the same circumstances.
2.2.3. Adjusting the 80 phone level
Play back of pink noise through one channel. Level set too nominal '0VU' or '0dB PPM 10ms’. Switch off all dynamic's and filtering (bypass) in console and speaker systems. Set the input sensitivity (or amplifier level) from speaker to a measured level of 77dBC SPL on the sound engineer’s position (sweet spot). Repeat on all channels. Playback of speech should result in a natural sounding SPL of approximately 73dB.
2.3. METERS
We all now there can be a difference between measuring and modulation. While seeing the level on a scale the loudness is perceived with our ears. Meters are used to control the overload of the transmission or recording, listening can control the average of loudness.
2.3.1. What kind of meter?
What kind of metering do we use to measure the loudness perception of the audience and to guarantee the optimal modulation of the signal? The answer is rather complex. While a 10ms PPM-meter gives a good indication for speech, the use of a VU or loudness-scale needs some experience. Nowadays we see meters that give different scales at the same time. Even a seasoned sound-engineer can still be fooled and will use other means to deliver an entertaining and effective content to the audience.
2.3.2. The proliferation of scales
In time different types of meters appeared in our studios. After VU-meter and analogue PPM, the digital age introduced the digital PPM. So it's quite common to find in the same studio environment, different meters with following integration times: 300ms (VU), 10ms, 1ms and 1 sample (digital). All these specifications lead to an offset between the meters for the same complex signal. While a tone gives an equal 0dB (-9dBFS) on all meters, speech can result in a difference of 5-8dB in nominal level (and loudness). In order to speak of uniformity 'one' standard should be used in all facility units of the production chain. Within VRT this is the PPM-meter with integration time of 10ms and an analogue scale, completed with overload indication. Surrounded by all this metering, it's easy to forget that
the audience at home does not dispose of such complex indicators. The viewer does not take in account signal peaks and signal to noise ratios but judges the loudness during a certain time. In the studio we work on one single program while the viewer watches different programs.
2.3.3. Standard meter
Metering within the VRT is done with a PPM-meter (DIN45406, IEC268-10 type I, IRT2/6, EBU3205). A modulo meter is designed to measure the quasi-peak level of a complex electrical signal. Signals, which occur during transmission of music or speech. In order to get an optimal modulation of the transmission or recording medium, the integration time should be chosen accordingly and this to get a maximal amplitude without overload of the medium. The integration time of 10ms is standard and results in an optimal modulation for speech. While an analogue medium is more tolerant to signals, which exceeds the 'clipping’ level, digital systems produce a nasty distortion when an overload occurs. Therefore a presence of overload indication is also necessary.
Figure 5 PPM-meter
2.4. MODULATION INSTRUCTIONS
In a television environment basic requirements are speed, simplicity and uniformity.
Modulation rules have to be applied during recording or a direct broadcast transmission, in all facility units of the production process like post-production, studio and OB, continuity and transmission.
2.4.1. The quest for an ideal average to peak
It's a natural determination that the average to peak is directly proportional to the size of the listening room for a normal perception. That’s why a movie has an average to peak of 20dB, a 'good' pop/rock CD has 14dB and TV-at-home (NICAM-stereo) 12dB. Average means loudness or '0VU' while peak stands for absolute
peak or the indication of a digital peak meter with an integration time of 1 sample.
A digital TV-recording can easily reach an average to peak of 18dB. This combined with a loud monitoring level results inevitably in a to large dynamic range. This is one of the main reasons why the loudness problems get bigger with the introduction of digital audio in TV-productions.
2.4.2. Stepwise to a dynamic reduction
During recording the average to peak will be reduced if necessary to 14dB. This ratio will be maintained during the whole production process. Just before transmission a further reduction will be applied, depending on the format: mono-fm 10dB, nicam-stereo 12dB and DVB-T 2.0 14dB (no reduction).
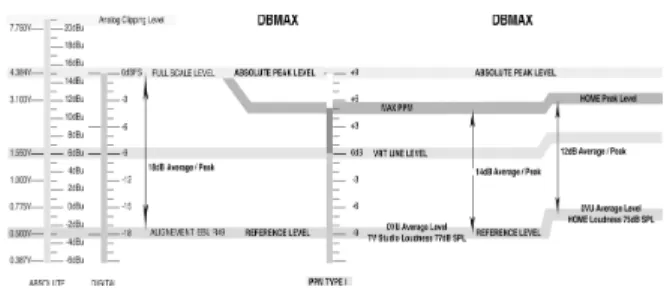
Figure 6 system levels
Even if 12dB is the final goal for nicam-stereo TV, a 2-step approach can be interesting. An intermediate stage of 14dB average to peak ratio could be useful if program material is to be (re)used for other media as DVB-T 2.0 which VRT also broadcasts.
2.4.3. VRT TV-modulation
The basic rule for mixing is to modulate on loudness, in which the human speech is taken as 'the' reference. An experienced sound engineer can work without metering and mix everything on the monitor speakers. He uses the meters simply as a guide. He gives the meters a glance from time to time but trusts on his ears! A PPM meter with an integration time of 10ms is a good compromise to get a balance between speech and music. On this meter an announcement can be placed between -3 to +1dB PPM. Transients as 'p's and 't's can sometimes reach +3dB. On a reference '80 phone' monitoring the loudness of speech typically is 73 dB SPL, which sounds naturally. All the other signals as music, ambient sounds, and jingles, ... should be placed in their natural sounding context. By taking the human voice as a reference and balancing the rest with it, we attend an acceptable situation. This results in a very
workable starting point because all the TV-programs contains one or another form of announcement or presentation. Don't make the false assumption to lower the monitoring level when playing an over compressed (to loud) item because you can't reach 0dB on the meters. That annoying sports-jingle should be played at -9dB PPM (or -18dBFS) if it sounds to loud in relation to the news anchor. As a result the grateful viewer at home doesn't have to reach for his remote control to adjust the volume.
2.5. THE USE OF BROADCASTPROCESSORS 2.5.1. Evolution
Traditionally a compressor/limiter was inserted in each step of the production process. This to protect against overloads from the mixing desk on recording equipment or transmission output. Headroom was more exploited with the introduction of multibandlimiting. The pumping effect could be avoided by dividing the dynamic processing in different frequency bands.
Adding multibandcompression augmented the possibilities. Items as 'brick wall-limiting', 'normalisation' and 'soft clipping' admitted to run on the borders of clipping without real overloads. All this items contain a certain risk to run in a trap called 'maximizing'.
2.5.2. Goal
Traditionally a compressor/limiter was inserted in each step of the production process. This to protect against overloads from the mixing desk on recording equipment or transmission output. Headroom was more exploited with the introduction of multibandlimiting. The pumping effect could be avoided by dividing the dynamic processing in different frequency bands.
Adding multibandcompression augmented the possibilities. Items as 'brick wall-limiting', 'normalisation' and 'soft clipping' admitted to run on the borders of clipping without real overloads. All this items contain a certain risk to run in a trap called 'maximizing'.
2.5.3. Position of multiband processors
Though the digital age made its entrance some time ago, we should take in account some analogue elements in the production chain. This means a possible change in processing parameters.
In this figure each section has its own processor with specific parameters. Post-production and continuity deal with emphasis on overload-protection and
reduction of loudness-problems. Studio and transmission will also adapt the average to peak.
Figure 7 typical production chain
2.5.4. Production studio
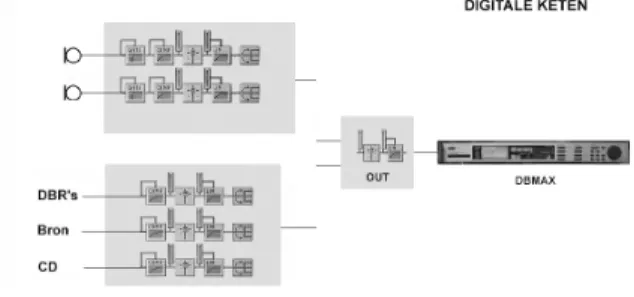
A TV-recording studio uses a processor in the output to guarantee an average to peak of 14dB. During a music production a second processor can be used to 'create' the sound of the orchestra (insert bus). Live microphones have their own single band compressor. Finally the music will be mixed with the microphones and will all go thru the finalizing processor.
Figure 8 setup digital studio
2.5.5. Master control room
The stereo signal of both programs has 3 broadcast processors: fm-mono, nicam-stereo and DVB-T 2.0. The average to peak ratio will be 10, 12 and 14dB. In order to get a mono compatible result from a stereo signal, a 90° mono summing with an additional -3dB reduction will be useful. This function makes even surround (LCRS or 4:2:4) coded signals compatible to mono. This amount of phase shifting gives the possibility to reproduce signals that get lost in a normal mono situation.
In every facility unit of VRT an average to peak ratio of 14dB is maintained. To get an average to peak of 12dB for nicam-stereo the multiband-limiting can be set to a threshold of -5dBFS. The multiband compressor can be set with a threshold around -19dBFS, a ratio of 1:1.25
and a make-up gain of +2dB. Brick wall is set to the overload limit of a digital transmission or 0dBFS with an integration time of 1 sample.
Figure 9 transmission
3. SETTINGS OF PROCESSORS
Next came the settings of the processing units. In the master plan the reduction in dynamics is described as a funnel, which gets gradually smaller throughout the production chain. So every department as post-production, TV- studio, outside broadcast, continuity, master control room and transmission gets its own settings. Those settings were determined with operators and program makers from each department.
3.1. Communication about settings
One of the topics is how to communicate with (non-technical) program makers on how it should sound... Not an easy task, but just try to think from a non-technical approach. With your monitoring set at reference level of 80 phon, give the director or program maker a sample of a presenter’s voice. Then without warning start the bumper or whatever jingle he wants and continue with the presenters voice. Ask him what the viewer’s reaction will be (turning the volume down or even worse zapping away). Communication about dynamics and filtering is even more difficult. Just try to talk about warmth, presence, colour or other visual items which are familiar to them.
3.2. How many settings
Keep the amount of standard presets as low as possible. The goal is to create a sound typical for VRT as broadcaster. This resulted in a total of eight settings for production and sixteen for transmission. Production could be restricted to standard, news, sports, quiz, talk show, music, 1:1 post, continuity. Transmission had a larger amount due to the different sources and broadcast
format. Three sources (continuity, auto, radio) and three formats (mono, nicam, DVB-T) in two programs means about 18 settings which are recalled by the on-air switcher.
4. RESULTS
4.1. Appreciation figures
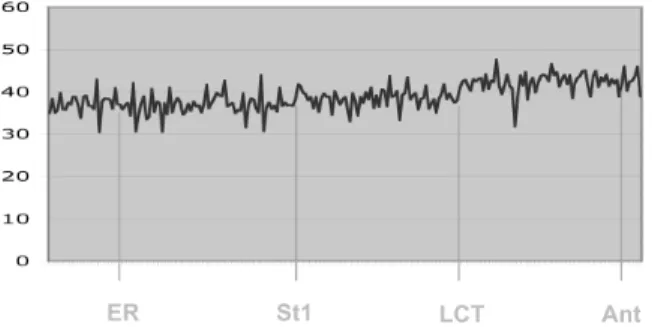
Next to the viewing figures, appreciation figures are used to review the performance of a broadcaster. In the next figure the evolution is shown for VRT’s news show during a period in which several parts of the production chain were adapted to the ‘Uniformity master plan’.
Figure 10 Appreciation figures news
Studio 1 is the news studio. With the introduction of uniformity in metering, reference monitoring, modulation rules and a dynamic processor, the first progress from 36 to 40 appeared. Next was the installation of processors in the master control room or LCT. This resulted in another positive raise to 45 average in appreciation from the viewers. Not only the benefits of cascading processing units were proofed, but also the uncontradictory connection between: metering, monitoring and modulation rules. Above figure was one of the key features to persuade management and program makers to continue the project.
4.2. Viewer complaints
We started this paper with viewer complaints. At Belgian National Broadcasters VRT, located in Brussels, about 75% of the complaints pro year were about sound. Since the implementation of the master plan there was a spectacular downfall between 2-5 %. This demonstrates again the efficiency of the master plan.
5. TRAPS OF THE DIGITAL AGE 5.1. Analogue and digital recording
A typical analogue recording results in an average to peak ratio of 14dB. -9dB PPM VRT (or EBU) = 0VU. Analogue recording on magnetically tape will be restricted to +6dB PPM, which is the result of a kind of limiting due to the hysteresis or saturation from the tape. It can't be compared to the digital distortion that occurs on overloads above 0dBFS.
In the digital domain an average to peak ratio of 18dB can be easily obtained. -18dBFS = 0VU (EBU) and 0dBFS is the maximum undistorted level. By using this range and a to loud monitoring this results in a to large dynamic range for the home viewer (as you remember those with a problem). The result is a dynamic range in which the music and dialogues are to far apart and not in a ratio that the viewer experiences as pleasant.
5.2. Digital workstations
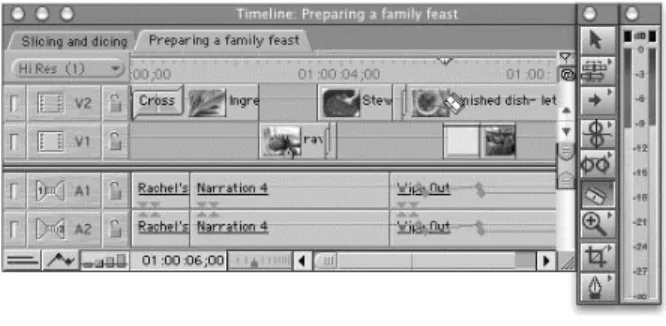
Figure 11 metering on workstation
Filling this category are audio software, digital workstations or DAW's and also VTR editing suites. ProTools and DAR for the audio world and AvidXpres and FinalCut Pro for video. Nowadays editing on hard disk is the usual workflow. A shift has taken place in the duties of the operator. One person has to fill in all the production aspects. People with perhaps a video or computer background have to complete an audio mix down. Also most of the video editing suites are not equipped with 'good' monitoring. The present learning curve is rather steep and it is one of the goals from this 'proposal for uniformity' to present some facts on how to judge loudness. An excess of only peak meters on computers, DAT-recorders and digital consoles don't give any clue on program loudness. The first thing operators have to be aware of is that the use of peak meters is to protect the medium from overloads. At the same time he has to know that average determines loudness. Meters on a computer screen suffer
frequently from latency or discontinuity (display stutters). Computer displays are cluttered with menus and buttons. The audiometer is often pushed into a corner and the integration time rarely meets the 10ms specification. At least one external meter (PPM 10ms) is an absolute necessity.
Together with reference monitoring, this external meter completes the sound engineers most important instruments, his ears.
5.2.1. Potential pitfalls
• Modulo meters with no correct integration time (1ms instead of 10) lead to a higher indication and as a result the engineer will reduce the level to stay at the nominal (VRT) level of 0dB PPM (-9dBFS).
• The reverse (20 instead of 10) results in a to low indication and in order to reach 0dB PPM (0dBFS) this will result in a to loud signal.
• In using digital scale meters with 0dBFS as a maximum, the engineer can attend to reach that 0dBFS while this should be -9dBFS. 0dB works like a red patch or a magnet. That’s why analogue scales are preferred with the DIN+5 or +10 scale.
• Due to the larger dynamic range of digital recording one can opt not to use compression in the microphone channels. This leads inevitably to unintelligible dialogues for the TV-audience.
• The use of a powerful broadcast processor creates the illusion to save on preceding compression. The mixing of live-microphones with already compressed dialogues from VTR (post-prod) results in louder VTR dialogues. An individual dynamic processing of live-microphones is necessary.
• It' still not done to mix jingles, opening scores, trailers, ... to 0dB PPM 10ms. Mix on loudness. The human voice from the anchor is the reference to which the rest is related.
• Those who use the limiter to stay around 0dB PPM get a pumping effect for free. Use the compressor to stay around 0dB. Limiting is to protect the medium.
• Try to process the dynamics from live-microphones as early as possible (compressor mic.input or in bus).
• Don't exaggerate adjusting the parameters from the broadcast processor. Do use frequently the 'bypass' function. Parameter changes of 0.5 to 1dB are common (a bit more warmth in the bass guitar, a fraction more presence on a voice).
• While using the bypass pay attention that both signals sounds even loud. Otherwise the loudest will be taken at first as the better (which is a false)
• Use your ears; meters come on the second place.
6. MAINTAINING THE MASTER PLAN
How to maintain this master plan is another topic. The viewer complaints have reduced dramatically. With this the indication of the weak points are gone. An alertness to prevent problems is necessary. Changes in equipment, workflow or transmission format are the logical target areas. One subject is the non-linear server system. The source tape is loaded into the system and ready for editing, re-editing and stays most of the time in the system till its ready for play-out. How audio is monitored is often neglected from the manufacturer. All metering is digital full scale and operators are often not skilled for audio mixing. Proposals and solutions keep surfacing in this ever-changing environment.
7. CONCLUSIONS
At VRT, viewer complaints have been taken as a guide to look for solutions to get rid of the loudness problem. This seemed to be a good approach with positive results. Hopefully broadcasters will consider this point of view as an asset for a more general solution and try to ameliorate the present situation by:
• Installation of a broadcast processor in every facility unit.
• To adapt typical modulation rules with emphasis to deliver the most entertaining and effective content rather than to be the loudest.
• Setting of a reference monitoring level of 80 phon in all units.
• Usage of meters who come up to VRT expectations of which the 10ms integration time is the most important.
With leveling of the voices around 0dB nominal level, the results were spectacular. Instantly the average to peak went down from 18 to 14dB. Dialogues became more intelligible and the jingles and music less loud due to the fact that the sound engineer was compressing the microphones, listening with the same (average) home
level and did not level the music out at 0dB but 2-6dB lower compared to speech.
These measurements create the possibility for a better control on the viewer’s playback circumstances. One thing should be kept in mind. A TV-recording studio with all the trims and shine make it sometimes easy to forget the following fact: a viewer does not take in account signal peaks nor signal to noise ratio but observes and judges the loudness on a longer period. The final goal consists to deliver an informative and relaxing experience to the viewer without him adjusting the volume.
Inserting just one peace of equipment right before transmission can’t solve this. A processor, which solves all of the problems according to the ads. It must be clear for now there is more to it. But no initial hesitation is necessary. Most of the requirements, advices, specifications and norms already exist for some years. They have been more or less neglected and perhaps with the advent of digital audio disappeared somewhat on the background. The primary goal of this paper is to be guidance. To conclude this proposal it has to be clear that while mixing the sound engineer should use his ears as primary controlling instruments.
8. ACKNOWLEDGEMENTS
The author would like to thank his colleagues for their contributions to this work. He would also like to thank the Audio Engineering Society for permission to publish this paper.
9. REFERENCES
[1] Roland Desmet ‘modulometers’,
‘modulatievoorscriften radio’ (VRT intern doc) [2] Bob Katz ‘Level practices in digital audio’, ‘How
to make better recordings in the 21st century’ (doc’s available on www.digido.com)
[3] IRT Instituut für Rundfunktechnik GmbH ‘Pflichtenheft Nr.3/6 Austuerungsmesser’
[4] J.Paul Moerman VRT ‘Voorstel tot Uniformisering van het TV-geluid’ (VRT intern doc)