FOREIGN INVESTORS, STOCK PRICE INFORMATIVENESS, AND MULTINATIONAL CORPORATIONS
Syungjin Han
A dissertation submitted to the faculty of the University of North Carolina at Chapel Hill in partial fulfillment of the requirements for the degree of Doctor of Philosophy in the Department of Finance in the Kenan-Flagler Business School.
Chapel Hill 2015
Approved by:
Christian T. Lundblad Chotibhak (Pab) Jotikasthira Anh Le
ii
© 2015 Syungjin Han
iii
ABSTRACT
Syungjin Han: Foreign Investors, Stock Price Informativeness, and Multinational Corporations (Under the direction of Christian T. Lundblad)
iv
v
ACKNOWLEDGEMENTS
vi
TABLE OF CONTENTS
LIST OF TABLES ... viii
LIST OF FIGURES ... ix
LIST OF ABBREVIATIONS ...x
FOREIGN INVESTORS, STOCK PRICE INFORMATIVENESS, AND MULITINATIONAL CORPORATIONS...1
1 Introduction ...1
2 Prior Literature and Hypothesis Development ...6
3 Data ...7
3.1 Sample Selection ...7
3.2 Stock Return Volatility ...8
3.3 Institutional Ownership ...9
3.4 Foreign Operations...10
3.5 Firm Characteristics ...11
4 Foreign Institutional Ownership and Stock Return Volatility ...12
4.1 Panel Regression Tests ...13
4.2 Type of Information ...15
5 Additional Analysis ...16
5.1 Alternative Stock Price Informativeness Measure ...16
5.2 Empirical Tests and Results ...19
vii
viii
LIST OF TABLES
Table 1: Sample of Firms and Summary Statistics by Country ...26 Table 2: Summary Statistics ...28 Table 3: Correlation Coefficients...29 Table 4: The Effect of Foreign Sales on the Relation between Foreign Institutional
Ownership and Volatility ...30 Table 5: The Determinants of the Relation between Foreign Institutional
Ownership and Volatility ...31 Table 6: Summary Statistics and Correlation Coefficients of Variables in the
Analysis of the Future Earnings Response Coefficients ...32 Table 7: Regressions of Current Returns on Future Earnings from Foreign
Operations and Interactions with Foreign Institutional Ownership ...33 Table 8: Regressions of Current Returns on Future Earnings from Foreign
Operations and Interactions with Foreign Institutional Ownership and
ix
LIST OF FIGURES
x
LIST OF ABBREVIATIONS
MNC Multinational Corporation
1
FOREIGN INVESTORS, STOCK PRICE INFORMATIVENESS, AND MULITINATIONAL CORPORATIONS
1 Introduction
There has been considerable controversy over the informational role of foreign investors
in the international finance literature. According to the literature on equity home bias, foreign investors are less informed relative to domestic investors (Karolyi and Stulz (2003), and Hau (2001)) because they are geographically distant. Their trading behaviors such as positive feedback trading and herding (Choe et al. (1999)) may destabilize stock prices moving away from fundamental values. On the other hand, much empirical evidence shows that foreign investors are sophisticated informed investors (Grinblatt and Keloharju (2000), and Karolyi (2002)). Consequently, their trades facilitate the incorporation of information moving stock prices in the direction to fundamental values (Bae et al. (2012), Gul et al. (2010), and He et al. (2013)).
2
Hyundai (a Korean motor company) relative to Korean investors since they know better about its reputation, customer satisfaction and competition with other firms in the U.S. automotive market. Thus, by trading of U.S. investors in the Korea stock exchange, Hyundai’s stock prices
incorporate such information.
To investigate the impact of foreign investors on stock price informativeness, I examine the relation between foreign institutional ownership and stock return volatility. If foreign investors are less informed, their positive feedback trading and herding can push prices away from fundamental values and increase volatility (LONG et al. (1990)). In contrast, if foreign investors are informed investors, they bet against noise-driven price movements and so dampen them (Freidman (1953)). In the literature on noise trading and market efficiency, informed rational speculators are traders to move prices in the direction to fundamental values by trading against noise traders, even if risk aversion keeps them from taking large positions to eliminate noise trader risk (De Long et al. (1990), and Campbell and Kyle (1993)).
The sample includes 24,089 firms in 44 countries during the period from 2001 to 2012. I run regressions of stock return volatility on foreign institutional ownership, controlling for the firm characteristics known as the determinants of volatility and including country, industry and year fixed effects. I find a positive association between foreign institutional ownership and volatility, whereas I find a negative association between domestic institutional ownership and volatility. These results imply that foreign institutional investors destabilize prices, whereas domestic institutional investors play a stabilizing role in stock markets.
To test the main hypothesis that foreign investors facilitate the incorporation of
3
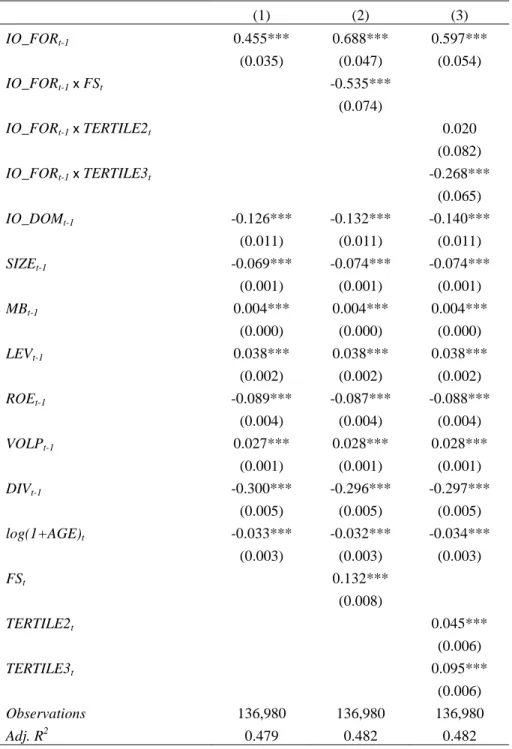
foreign countries. I find a negative interaction between foreign institutional ownership and the ratio of foreign sales to total sales. The destabilizing effect of foreign investors is attenuated as firms have a larger proportion of foreign operations. Compared to firms in the lowest foreign sales tertile, the coefficient for foreign institutional ownership is reduced almost half in firms in the highest foreign sales tertile. A 10% increase in foreign institutional ownership is associated with a 5.97% increase in volatility for firms in the lowest foreign sales tertile and a 3.29% increase in volatility for firms in the highest foreign sales tertile. This implies that foreign investors have an informational advantage about foreign operations and have a stabilizing effect on stock prices of MNCs.
Furthermore, I look into what type of information foreign investors gather and interpret. I examine whether the information is about the demand for a firm’s products or about its
technology. Investors may have better access to local market and industry information. It
4
geographic proximity not to the location of their foreign subsidiaries but to the location of their product markets.
To provide more direct evidence, I investigate whether current stock prices contain more information about future earnings generated from foreign operations of MNCs as foreign
institutional ownership increases. I modify the future earnings response coefficient (FERC) model, which I borrow from the accounting literature (Collins et al. (1994), and Orpurt and Zang (2009)). I decompose earnings into earnings generated from foreign and domestic operations so that I can examine stock price informativeness by location of operations. I find that current stock returns are more strongly positively associated with future earnings from foreign operations with higher foreign institutional ownership. The positive relation between foreign institutional
ownership and the FERC is robust after controlling for the firm characteristics known to affect the FERC. The result suggests that foreign investors facilitate the incorporation of information about future earnings from foreign operations of MNCs.
This paper contributes to the literature which documents that distance is an important factor to the quality of information. An informational advantage of local investors is one of the factors to explain the home bias (Karolyi and Stulz (2003)). Even in the U.S. market, Coval and Moskowitz (1999) and Coval and Moskowitz (2001) show that U.S. mutual funds exhibit strong preference for stocks of the firms whose corporate headquarters are geographically more
proximate and have better performance with such local stocks. While those studies are focused on the performance and holdings of investors, this paper looks into an impact on stock prices. It suggests that the geographic location of investors has a significant effect on price efficiency.
5
global market information and the speed of incorporation of global market information into stock prices increases with the greater accessibility of foreign investors in emerging markets. Other studies related to this paper are Gul et al. (2010) and He et al. (2013). They find that stock prices have become more informative with the presence of foreign investors using firm-specific return variation as a stock price informativeness measure. This study complements the literature by proposing a specific mechanism through which foreign investors improve price informativeness of local stock markets. It suggests that the geographic proximity of foreign investors to foreign operations of firms facilitates the improvement of the price efficiency of MNCs’ stocks. This effect is significant under prominent corporate investment globalization.
Last, this paper contributes to the accounting literature on the future earnings response coefficient (FERC) model. A long strand of research follows after Collins et al. (1994) first proposed the FERC, which gauges the sensitivity of current stock returns to changes in expected future earnings as a measure of stock price informativeness. This paper is the first paper to decompose earnings by their origin and study stock price informativeness of firms by location of their operations.
6
The remainder of the paper is organized as follows. Section 2 develops the central hypothesis. Section 3 describes the data. Section 4 discusses the empirical results of the main regression analysis. Section 5 discusses additional analysis with an alternative stock price informativeness measure. Section 6 concludes.
2 Prior Literature and Hypothesis Development
The equity home bias literature suggests that informational disadvantage of investors about foreign stocks is one of the indirect barriers to international investment. It proposes geographic distance as a factor to explain why investors know less about foreign stocks than about domestic stocks (Karolyi and Stulz (2003)). Many studies find that the distance between the location of investors and firms matters with respect to asymmetric distribution of information among agents. Hau (2001) uses geographic trader locations as proxies for information
asymmetry in the German stock market and finds that traders outside Germany show lower proprietary trading profits. Of U.S. evidence, Coval and Moskowitz (1999) and Coval and Moskowitz (2001) show that the holdings of a U.S. stock by U.S. mutual funds are negatively correlated with the distance between the location of the funds and the corporate headquarters of the firms and funds have better performance with the stocks located more closely to where the funds are located.
On the other hand, there is some conflicting evidence with the argument that foreign investors are less informed than domestic investors. Grinblatt and Keloharju (2000) show that the portfolios of foreign investors outperform the portfolios of households in Finland. Karolyi (2002) documents that foreign investors in Japan equities outperformed Japanese individuals and
7
better because most of foreign investors are institutions and, therefore, they have the expertise, experience, and resources to conduct the firm research.
Reconciling two conflicting views about foreign investors, I conjecture that foreign investors have an advantage in gathering and interpreting information about the prospects for foreign operations of firms due to their geographic proximity. While foreign investors are located geographically distant from the location of domestic operations, they are close to the location of foreign operations. Foreign investors would trade and capitalize on such information which would be incorporated into stock prices of the firms in local stock markets. Following the
argument, I construct the main hypothesis that foreign investors have an advantage in processing information about foreign operations of MNCs and their informed trading enhances stock price informativeness of the MNCs.
3 Data
In this section, I describe the sample selection procedure, the measurement of the main variables and the summary statistics of variables for the sample firms.
3.1 Sample Selection
To construct the sample, I use three main sources of the data in the analysis. The first databases are Compustat Global and Compustat North America, from which I collect stock market data such as total return prices,1 market capitalization and most of accounting data. The second database is Datastream/Worldscope, where I obtain local market index returns and
1
I adjust stock prices to account for stock splits and dividend payments. The total return prices are calculated using the following formula:
, where TRCi,d = total return price,
PRCCDi,d = daily closing price, TRFDi,d= daily total return factor, and AJEXDIi,d= daily adjustment
8
segment accounting data such as foreign sales, foreign assets and foreign income. I restrict the sample to firms which report foreign sales. The third database is FactSet/LionShares, where I draw institutional holdings data. The final sample contains 23 developed markets and 21
emerging markets and consists of 24,089 unique firms with 136,980 firm-year observations over the sample period from 2001 to 2012.
3.2 Stock Return Volatility
Shiller (1981) claims that stock prices are too volatile to be justified by news about future dividends in the simple present value model. De Long et al. (1990) and Campbell and Kyle (1993) attribute such excessive volatility to noise trading. In their models, sophisticated informed investors take arbitrage positions against noise traders. It prevents prices from moving away from fundamental values. However, since arbitragers are likely to be risk averse, their
willingness to bet against noise traders is limited. As a result, noise trading can destabilize stock prices. Their models predict that if sophisticated informed investors increase relative to noise traders in stock markets, stock prices would be stabilized by their informed arbitrage trading.
On the other hand, when positive feedback traders form a herd their trading can have a destabilizing impact on stock prices (Choe et al. (1999)). Positive feedback traders can push prices higher (lower) by buying (selling) following price increases (decreases). If their trading is not based on information about fundamentals, it moves prices away from fundamental values. Rational speculators have the limits of arbitrage dedicated to exploiting positive feedback traders’ misperceptions (De Long et al. (1990)) and can even take advantage of their behaviors
contributing to the destabilizing effect (LONG et al. (1990)).
9
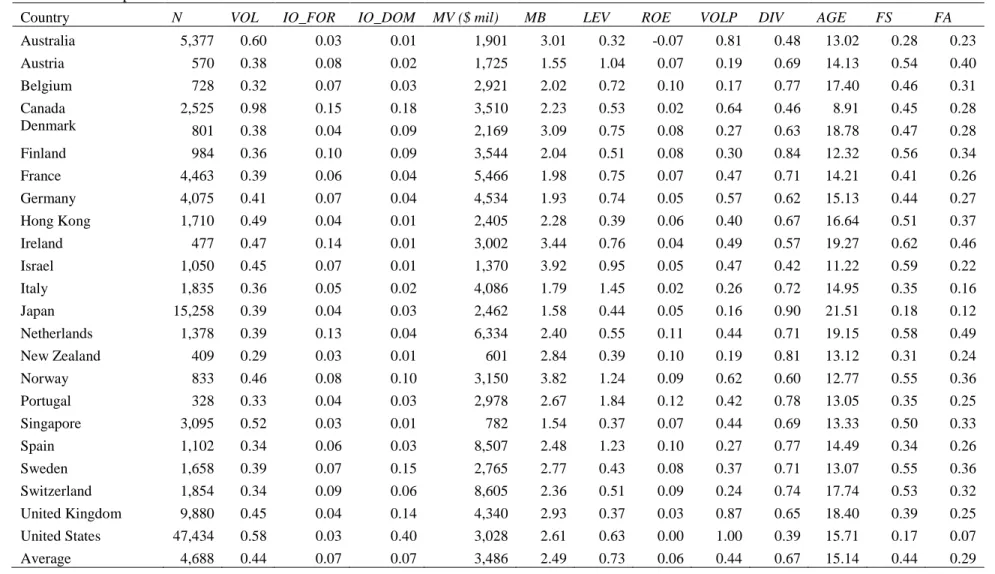
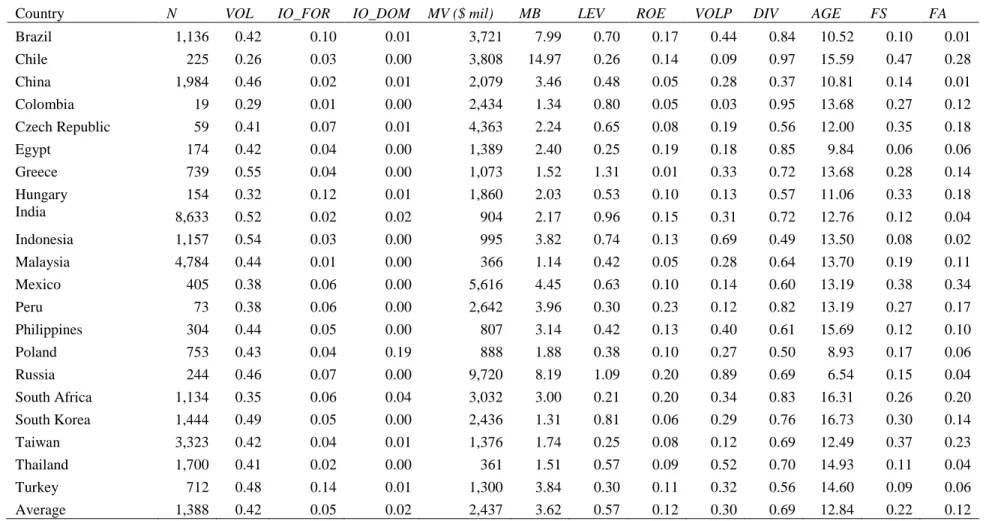
returns2 in a given year and annualize it with multiplying by . The firm-year observations are included in the sample if they have return data for at least 40 weeks. There is a large variation of volatility across countries. Table 1 shows that, on average, countries with the highest volatility are Canada (98%), Australia (60%), and Unites States (58%) and. Countries with the lowest volatility are Chile (26%), New Zealand (29%), and Colombia (30%). This calls for including country fixed effects in the regression analysis.
3.3 Institutional Ownership
I use institutional ownership during the period 2000 to 2011 because I study the effect of institutional ownership (one-year lagged) on the future level of stock return volatility from 2001 to 2012. The institutional holdings data are drawn from the FactSect/LionShares database, a leading information source for global institutional ownership. The database covers institutions defined as professional money managers with discretionary control over assets such as mutual funds, pension funds, bank trusts, and insurance companies (see Ferreira and Matos (2008) for more details).
IO_FOR is defined as the sum of the holdings of all institutions domiciled in a different country from the origin country of the firm, expressed as a percentage of the firm’s market capitalization at the end of the calendar years. IO_DOM is the sum of the holdings of all
institutions domiciled in the same country as the origin country of the firm as a percentage of the firm’s market capitalization at the end of the calendar years. To deal with the different reporting frequency of institutions, the latest holdings update at each year end is used to calculate
10
institutional ownership annually. Following Ferreira and Matos (2008), I set institutional ownership variables to zero if a stock is not held by any institution in FactSet/LionShares.
Table 1 shows that, on average, countries with the highest foreign institutional ownership are Canada (15%), Turkey (15%) and Ireland (14%), while countries with the lowest foreign institutional ownership are Colombia (1%), Malaysia (1%), and China (2%). In the U.S., domestic institutional ownership (40%) dominates foreign institutional ownership (3%). But in most countries, foreign institutional ownership exceeds domestic institutional ownership except in Canada, Denmark, Norway, Poland, Sweden, and United Kingdom.
3.4 Foreign Operations
I use foreign sales scaled by total sales and foreign assets scaled by total assets to measure the extent of a firm’s foreign operations. Foreign sales, foreign assets, total sales, and total assets are obtained from Datastream/Worldscope database. Foreign sales are defined as sales generated from goods produced and sold abroad and foreign assets represent assets of foreign operations. The limitation of the data is that foreign sales and foreign assets are not reported by country-level segment. Because of that constraint, I could not match sales and assets with institutional ownership by country-level. But I expect that inclusion of investors from different countries when calculating institutional ownership biases against finding support for my hypothesis.
11
resulted from the effort of EU to achieve a single market fosters corporate investment within the local region.
On average, firms in developed markets have higher foreign operations (44% foreign sales, and 29% foreign assets) than firms in emerging markets (22% foreign sales, and 12% foreign assets) as you see Table 1. Figure 2 shows that in both developed and emerging markets, foreign sales have increased gradually while foreign assets have not changed much over the sample period from 2001 to 2012. Corporate operations have globalized around the world with respect to sales over the sample period.
3.5 Firm Characteristics
In principle, firm characteristics should be included in the analysis as control variables to correct the omitted variable bias problem if they affect foreign institutional ownership and also stock return volatility. I include a comprehensive list of firm characteristics based on the related prior study (Rubin and Smith (2009)). I obtain the data from Datastream, Compustat Global, Compustat North America to measure the firm characteristics.
Small firms are more focused, specializing in limited operations than large firms which are more diversified and, therefore, small firms tend to react more to idiosyncratic shocks (Rubin and Smith (2009)). To control for the size of the firms, I use the log of market value of the equity (SIZE).
Pastor and Pierto (2003) documented that MB increases with uncertainty about
12
have more information asymmetry with more uncertain prospects and consequently have more volatile returns than dividend paying firms. I include a dummy variable, DIV, which indicates whether a firm pays dividends during the year.
The use of debt amplifies variability of profitability due to the leverage effect and, as a result, is likely to increase stock return volatility. To control for the leverage effect, I use the long-term debt divided by the market value of equity. Wei and Zhang (2006) argue that the upward trend of stock return volatility is accounted for by the downward trend of the return-on-equity and the upward trend of volatility of the return-on-return-on-equity. To control for the accounting profitability effect, I include ROE, which is defined as net income before extraordinary items divided by the book value of equity, and its volatility. I estimate the standard deviation of annual
ROE measures using the previous 6 years to measure volatility of profitability (VOLP). I include the firm-year observations that have at least 4 years of ROE in the sample.
I winsorize variables such as VOL, SIZE, MB, LEV, ROE and VOLP at the upper and lower 1%.
4 Foreign Institutional Ownership and Stock Return Volatility
In this section, I examine whether foreign investors promote the incorporation of information about foreign operations of MNCs in local stock markets using panel regressions with stock return volatility as the dependent variable. I test the hypothesis by investigating the impact of the extent to which firms engage in foreign operations on the foreign institutional ownership-volatility relation. Furthermore, I study whether the information that foreign investors have is about the sales prospects for foreign operations in product markets or about their
13
operations and assets being invested in foreign countries on the foreign institutional ownership-volatility relation.
4.1 Panel Regression Tests
The main prediction of this study is that since foreign investors know better about the prospects for foreign operations of firms, the stock prices become more informative with the presence of foreign investors as firms engage more in foreign operations. To test this prediction, I examine the effect of the extent of foreign operations on the relation between foreign
institutional ownership and stock return volatility. I use foreign sales scaled by total sales to measure the extent to which firms have foreign operations. I expect that there is a negative impact of foreign sales on the foreign institutional ownership-volatility relation since if foreign investors are informed about foreign operation of MNCs, they will take arbitrage positions against noise traders, which reduces the volatility of MNCs.
In the tests, all the independent variables except the log of one plus age, foreign sales and the tertile membership of foreign sales are lagged by one year to examine the effects of current explanatory variables on future stock return volatility. That is, stock return volatility is for period
14
to account for serial correlation at the firm level (i.e., I assume that observations are independent across firms, but not within firm).
Column (1) of Table 4 shows that a 10% increase in foreign institutional ownership is associated with a subsequent increase in volatility by 4.55% and a 10% increase in domestic institutional ownership is associated with a subsequent decrease in volatility by 1.26%. Foreign institutional investors have a destabilizing role, while domestic institutional investors have a stabilizing role in stock markets. This result is consistent with the view that foreign investors are less-informed than domestic investors because of geographic separation. All the regression results in Table 4 show that small, high-growth, highly leveraged firms, firms with low accounting profitability, high volatility of profitability, non-dividend paying, and young firms exhibit high stock return volatility.
To test the main hypothesis, I investigate the interaction term between foreign
15
4.2 Type of Information
I investigate what type of information foreign investors have an advantage to gather and interpret. The information could be about the demand for a firm’s products or about its
technology. Investors may have better access to local market and industry information. It
provides them with an informational advantage about the firm’s reputation, customer satisfaction, and competition with other firms in the local product markets. On the other hand, investors may have better ability to gain information about the technology used by a firm since they can talk to its managers, employees and suppliers of the local firm. For example, U.S. investors have lower costs to gather information about the U.S. automotive market and, therefore, have better ability to obtain and interpret information about the U.S. customer demand for Hyundai (a Korean motor company) vehicles. Alternatively, U.S. investors are geographically proximate to the headquarter and manufacturing facilities of Hyundai’s U.S. operations and so have better access to local managers, employees and suppliers to obtain information about the technology of its U.S. subsidiary.
To distinguish these explanations, I examine whether the stabilizing effect of foreign investors increases as a firm has a larger proportion of foreign sales or foreign assets. If the information that foreign investors have is about the demand for a firm’s products, their stabilizing effect is likely to be higher as the extent of sales generated from foreign countries increases. On the other hand, if the information is about the technology of the firm, the effect is likely to be higher as the firm has a larger percentage of assets being invested in foreign
countries.
16
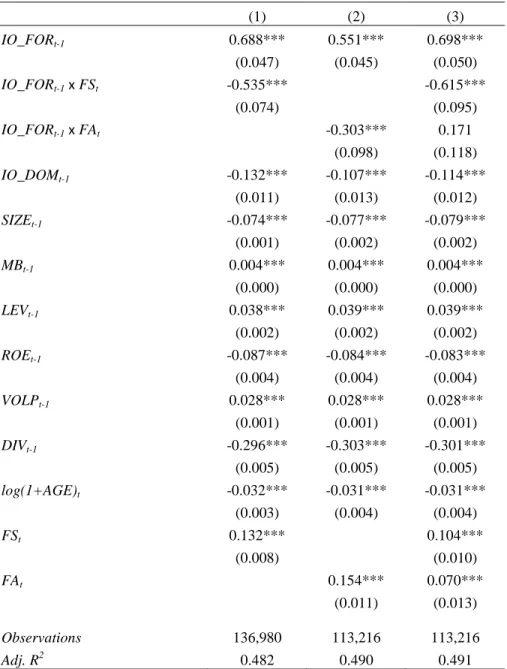
whereas the interaction term between foreign institutional ownership and foreign assets is positive and statistically insignificant. This result is consistent with the hypothesis that foreign investors have an informational advantage about the sales prospects for MNCs rather than about their operating efficiency. This implies that the informational advantage of foreign investors stems from geographic proximity to the location of their product markets not to the location of their foreign subsidiaries.
5 Additional Analysis
In this section, I provide more direct tests whether foreign investors facilitate the incorporation of information about foreign operations of MNCs in local stock markets using an alternative stock price informativeness measure. I examine the impact of foreign institutional ownership on the extent of information reflected in stock prices about future earnings generated from foreign operations by modifying the future earnings coefficient (FERC) model.
5.1 Alternative Stock Price Informativeness Measure
17
The current stock return can be characterized as the sum of three components:
unexpected current earnings, the cumulative change in expectations about future earnings and noise as follows:
, (1) where Rt is the annual stock return in year t, UXt is the unexpected earnings in year t defined as the annual earnings less the prior period’s expectation (Et-1(Xt)), and ΔEt(Xt+i) is the change in expectations between time t-1 and t about future earnings in year t+i (Et-1(Xt+i) - Et(Xt+i)).
Following Lundholm and Myers (2002), I proxy for UXt using the level of Xt-1 and Xt. The earnings process is modeled in general specification allowing for random walk, white noise process, and AR (1) process. Regarding ΔEt(Xt+i), I proxy for Et(Xt+i) using realized future earnings and the prior expectation for future earnings (Et-1(Xt+i)) is captured by Xt-1. However, realized future earnings have expected and unexpected components. To control for the
unexpected component of future earnings which is measurement error, future returns (Rt+i) are included. The time span of future earnings is limited to three years since investors revise their expectations over a relatively short horizon and adding more time periods increases little explanatory power of the model (Collins et al. (1994)). Then I have the following regression which is a condensed version of Lundholm and Myers (2002):
(2) where Rt is the buy-and-hold return for year t over the 12-month period ending three months after the year t fiscal year-end, Xt-1 is income available to common shareholders before
extraordinary items in year t-1 scaled by market value of equity three months after the year t-1
fiscal year-end (i.e. at the beginning of current return measurement), Xtis income available to
18
months after the year t-1 fiscal year-end, X3t is the sum of income available to common
shareholders before extraordinary items for three years following year t scaled by market value of equity three months after the year t-1 fiscal year-end, and R3t is the buy-and-hold return for the three-year period following year t starting three months after the year t fiscal year-end.
I modify this price-earnings relation to allow for separate measurement of ability of current returns to reflect earnings from foreign operations and domestic operations. I decompose earnings into earnings from foreign operations and domestic operations. I estimate the following regression:
, (3)
where Rt is the buy-and-hold return for year t over the 12-month period ending three months after the year t fiscal year-end, X_FORt-1 (X_DOMt-1) is income available to common
shareholders before extraordinary items generated from operations in foreign countries (in home country) in year t-1 scaled by market value of equity three months after the year t-1 fiscal year-end (i.e. at the beginning of current return measurement), X_FORt (X_DOMt) is income available
to common shareholders before extraordinary items generated from operations in foreign
countries (in home country) in year t scaled by market value of equity three months after the year
t-1 fiscal year-end, X3_FORt (X3_DOMt) is the sum of income available to common
shareholders before extraordinary items for three years following year t generated from
19
To measure income available to common shareholders before extraordinary items by its origin, I obtain total operating income, foreign operating income and net interest income data from Datastream database. Domestic operating income is calculated as total operating income less foreign operating income. I allocate net interest income on the basis of the proportion of sales from foreign and domestic operations, respectively. Then I subtract the allotted net interest income from operating income to compute income available to common shareholders before extraordinary items for foreign and domestic operations.
5.2 Empirical Tests and Results
The main hypothesis predicts that since foreign investors know better about foreign operations of firms, more information about future earnings generated from their foreign operations is incorporated into stock prices with higher foreign institutional ownership. To test this cross-sectional prediction, this study evaluates the interaction term between foreign
institutional ownership and realized future earnings from foreign operations in the decomposed FERC model.
If investors obtain information relevant to future earnings of firms, the information will be revealed at least partially into the stock prices by their trading activity and the coefficient on realized future earnings will be positive. On the other hand, if no information is revealed in current stock prices through investors, the coefficient on realized future earnings will be closer to zero. This implies that there is a positive interaction effect between foreign institutional
ownership and future earnings from foreign operations under the informed investor hypothesis. I test the hypothesis with the following regression:
20
(4)
where IO_FORt-1 is the number of shares held by foreign institutions divided by total number of shares outstanding at the end of year t-1, Rt is the buy-and-hold return for year t over the
12-month period ending three 12-months after the year t fiscal year-end. X_FORt-1 (X_DOMt-1) is income available to common shareholders before extraordinary items generated from operations in foreign countries (in home country) in year t-1 scaled by market value of equity three months after the year t-1 fiscal year-end (i.e. at the beginning of current return measurement), X_FORt
(X_DOMt) is income available to common shareholders before extraordinary items generated
from operations in foreign countries (in home country) in year t scaled by market value of equity three months after the year t-1 fiscal year-end, X3_FORt (X3_DOMt) is the sum of income available to common shareholders before extraordinary items for three years following year t
generated from operations in foreign countries (in home country) scaled by market value of equity three months after the year t-1 fiscal year-end, and R3t is the buy-and-hold return for the
three-year period following year t starting three months after the year t fiscal year-end.
21
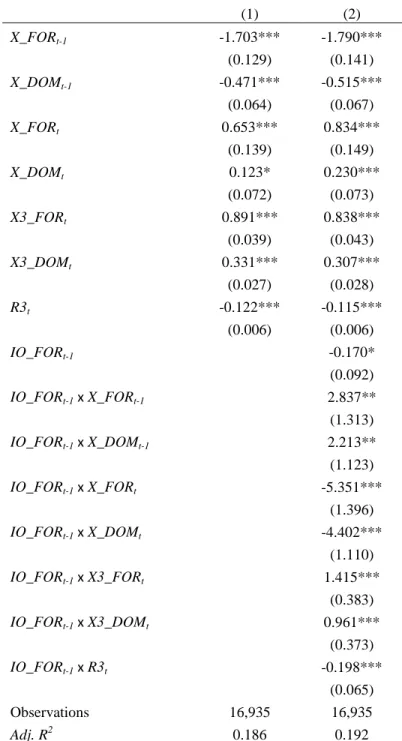
Column (1) of Table 7 shows that current returns are significantly positively associated with future earnings generated from foreign and domestic operations and significantly negatively associated with future returns. The positive coefficients on both future earnings indicate that information about future earnings from foreign and domestic operations is incorporated in stock prices. The negative coefficient on future returns demonstrates that it removes measurement errors in both of realized future earnings.
Column (2) of Table 7 shows that foreign institutional ownership significantly affects the relation between current returns and future earnings from foreign operations. IO_FORt-1 x
X3_FORt is significantly positive, which indicates that current returns are more strongly associated with future earnings from foreign operations as foreign institutional ownership increases. This implies that foreign institutional investors facilitate the incorporation of information in current stock prices about future earnings from foreign operations.
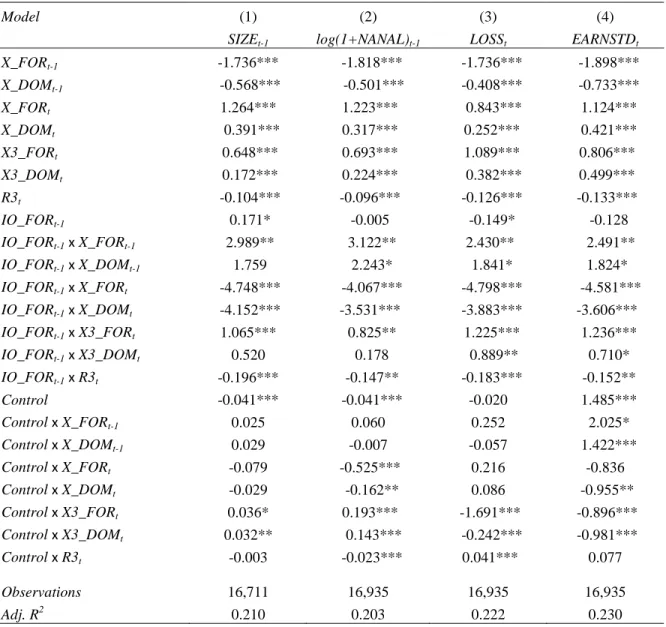
Following Orpurt and Zang (2009), I add various firm-level control variables individually to the regression. To control for differences in information environment, SIZE and the number of analysts following a firm (NANAL) are used. Large and high analyst-following firms tend to have richer information environment. Since negative future earnings are more difficult to predict than positive future earnings which are normal and persistent, I include an indicator variable LOSS, which is set to 1 if X3_FORtis negative otherwise 0. Lastly, I include a proxy for volatility of
future earnings (EARNSTD) since volatile earnings are more difficult to predict. EARNSTD is defined as the standard deviation of future earnings from foreign operations for year t+1 through
t+3.
22
information about future earnings from foreign operations of firms in current stock prices, even after controlling for the determinants of the FERCs which are documented in the accounting literature. Interestingly, the coefficients on IO_FORt-1 x X3_DOMt are not significant when controlling for SIZE and NANAL, which implies that foreign institutional investors do not have an informational advantage on domestic operations of firms controlling for information
environment of firms.
6 Conclusion
This paper proposes a specific channel through which foreign shareholding improves stock price informativeness in local stock markets. I find that foreign investors facilitate the incorporation of information about foreign operations of MNCs into local stock prices since they have an informational advantage to gather and interpret such information due to their geographic proximity. The study suggests an informational benefit of financial liberalization contributing to the international finance literature about financial market integration.
23
24
Figure 1: Foreign Sales and Foreign Assets by Geographic Region
This figure shows foreign sales and foreign assets by geographic region in 2012. Foreign sales are defined as sales generated from operations in foreign countries scaled by total sales. Foreign assets are defined as assets of operations in foreign countries scaled by total assets. The countries that comprise each region are provided in Appendix B.
0% 10% 20% 30% 40% 50% 60%
Europe Asia Pacific North America Middle East &
Africa
South America Foreign Sales
0% 5% 10% 15% 20% 25% 30% 35% 40%
Europe Asia Pacific North America Middle East &
Africa
25
Figure 2: Foreign Sales and Foreign Assets by Year
This figure shows foreign sales and foreign assets for developed and emerging markets over the period from 2001 to 2012. Foreign sales are defined as sales generated from operations in foreign countries scaled by total sales. Foreign assets are defined as assets of operations in foreign countries scaled by total assets. The countries that comprise developed and emerging markets are provided in Table 1.
0% 5% 10% 15% 20% 25% 30% 35% 40% 45% 50%
2001 2002 2003 2004 2005 2006 2007 2008 2009 2010 2011 2012
Foreign Sales
Developed Emerging
0% 5% 10% 15% 20% 25% 30% 35%
2001 2002 2003 2004 2005 2006 2007 2008 2009 2010 2011 2012
Foreign Assets
Table 1: Sample of Firms and Summary Statistics by Country
This table provides summary statistics for firms in the sample. I report the number of observations and the average values of firm characteristics by country. Panel A reports the number of observations and the average values of firm characteristics for developed markets. Panel B reports the number of observations and the average values of firm characteristics for emerging markets. The sample period is from 2001 to 2012. Refer to Appendix A for variable definitions.
Panel A: Developed Markets
Country N VOL IO_FOR IO_DOM MV ($ mil) MB LEV ROE VOLP DIV AGE FS FA
Australia 5,377 0.60 0.03 0.01 1,901 3.01 0.32 -0.07 0.81 0.48 13.02 0.28 0.23
Austria 570 0.38 0.08 0.02 1,725 1.55 1.04 0.07 0.19 0.69 14.13 0.54 0.40
Belgium 728 0.32 0.07 0.03 2,921 2.02 0.72 0.10 0.17 0.77 17.40 0.46 0.31
Canada 2,525 0.98 0.15 0.18 3,510 2.23 0.53 0.02 0.64 0.46 8.91 0.45 0.28
Denmark 801 0.38 0.04 0.09 2,169 3.09 0.75 0.08 0.27 0.63 18.78 0.47 0.28
Finland 984 0.36 0.10 0.09 3,544 2.04 0.51 0.08 0.30 0.84 12.32 0.56 0.34
France 4,463 0.39 0.06 0.04 5,466 1.98 0.75 0.07 0.47 0.71 14.21 0.41 0.26
Germany 4,075 0.41 0.07 0.04 4,534 1.93 0.74 0.05 0.57 0.62 15.13 0.44 0.27
Hong Kong 1,710 0.49 0.04 0.01 2,405 2.28 0.39 0.06 0.40 0.67 16.64 0.51 0.37
Ireland 477 0.47 0.14 0.01 3,002 3.44 0.76 0.04 0.49 0.57 19.27 0.62 0.46
Israel 1,050 0.45 0.07 0.01 1,370 3.92 0.95 0.05 0.47 0.42 11.22 0.59 0.22
Italy 1,835 0.36 0.05 0.02 4,086 1.79 1.45 0.02 0.26 0.72 14.95 0.35 0.16
Japan 15,258 0.39 0.04 0.03 2,462 1.58 0.44 0.05 0.16 0.90 21.51 0.18 0.12
Netherlands 1,378 0.39 0.13 0.04 6,334 2.40 0.55 0.11 0.44 0.71 19.15 0.58 0.49
New Zealand 409 0.29 0.03 0.01 601 2.84 0.39 0.10 0.19 0.81 13.12 0.31 0.24
Norway 833 0.46 0.08 0.10 3,150 3.82 1.24 0.09 0.62 0.60 12.77 0.55 0.36
Portugal 328 0.33 0.04 0.03 2,978 2.67 1.84 0.12 0.42 0.78 13.05 0.35 0.25
Singapore 3,095 0.52 0.03 0.01 782 1.54 0.37 0.07 0.44 0.69 13.33 0.50 0.33
Spain 1,102 0.34 0.06 0.03 8,507 2.48 1.23 0.10 0.27 0.77 14.49 0.34 0.26
Sweden 1,658 0.39 0.07 0.15 2,765 2.77 0.43 0.08 0.37 0.71 13.07 0.55 0.36
Switzerland 1,854 0.34 0.09 0.06 8,605 2.36 0.51 0.09 0.24 0.74 17.74 0.53 0.32
United Kingdom 9,880 0.45 0.04 0.14 4,340 2.93 0.37 0.03 0.87 0.65 18.40 0.39 0.25
United States 47,434 0.58 0.03 0.40 3,028 2.61 0.63 0.00 1.00 0.39 15.71 0.17 0.07
Average 4,688 0.44 0.07 0.07 3,486 2.49 0.73 0.06 0.44 0.67 15.14 0.44 0.29
Table 1: Continued
Panel B: Emerging Markets
Country N VOL IO_FOR IO_DOM MV ($ mil) MB LEV ROE VOLP DIV AGE FS FA
Brazil 1,136 0.42 0.10 0.01 3,721 7.99 0.70 0.17 0.44 0.84 10.52 0.10 0.01
Chile 225 0.26 0.03 0.00 3,808 14.97 0.26 0.14 0.09 0.97 15.59 0.47 0.28
China 1,984 0.46 0.02 0.01 2,079 3.46 0.48 0.05 0.28 0.37 10.81 0.14 0.01
Colombia 19 0.29 0.01 0.00 2,434 1.34 0.80 0.05 0.03 0.95 13.68 0.27 0.12
Czech Republic 59 0.41 0.07 0.01 4,363 2.24 0.65 0.08 0.19 0.56 12.00 0.35 0.18
Egypt 174 0.42 0.04 0.00 1,389 2.40 0.25 0.19 0.18 0.85 9.84 0.06 0.06
Greece 739 0.55 0.04 0.00 1,073 1.52 1.31 0.01 0.33 0.72 13.68 0.28 0.14
Hungary 154 0.32 0.12 0.01 1,860 2.03 0.53 0.10 0.13 0.57 11.06 0.33 0.18
India 8,633 0.52 0.02 0.02 904 2.17 0.96 0.15 0.31 0.72 12.76 0.12 0.04
Indonesia 1,157 0.54 0.03 0.00 995 3.82 0.74 0.13 0.69 0.49 13.50 0.08 0.02
Malaysia 4,784 0.44 0.01 0.00 366 1.14 0.42 0.05 0.28 0.64 13.70 0.19 0.11
Mexico 405 0.38 0.06 0.00 5,616 4.45 0.63 0.10 0.14 0.60 13.19 0.38 0.34
Peru 73 0.38 0.06 0.00 2,642 3.96 0.30 0.23 0.12 0.82 13.19 0.27 0.17
Philippines 304 0.44 0.05 0.00 807 3.14 0.42 0.13 0.40 0.61 15.69 0.12 0.10
Poland 753 0.43 0.04 0.19 888 1.88 0.38 0.10 0.27 0.50 8.93 0.17 0.06
Russia 244 0.46 0.07 0.00 9,720 8.19 1.09 0.20 0.89 0.69 6.54 0.15 0.04
South Africa 1,134 0.35 0.06 0.04 3,032 3.00 0.21 0.20 0.34 0.83 16.31 0.26 0.20
South Korea 1,444 0.49 0.05 0.00 2,436 1.31 0.81 0.06 0.29 0.76 16.73 0.30 0.14
Taiwan 3,323 0.42 0.04 0.01 1,376 1.74 0.25 0.08 0.12 0.69 12.49 0.37 0.23
Thailand 1,700 0.41 0.02 0.00 361 1.51 0.57 0.09 0.52 0.70 14.93 0.11 0.04
Turkey 712 0.48 0.14 0.01 1,300 3.84 0.30 0.11 0.32 0.56 14.60 0.09 0.06
Average 1,388 0.42 0.05 0.02 2,437 3.62 0.57 0.12 0.30 0.69 12.84 0.22 0.12
2
28
Table 2: Summary Statistics
This table reports summary statistics of firm characteristics for all firms in the sample. The sample period is from 2001 to 2012. Refer to Appendix A for variable definitions.
Variables N Mean Std. Dev. Min. Q1 Median Q3 Max.
Dependent Variable
log(VOL)t 136,980 -0.875 0.575 -2.174 -1.272 -0.916 -0.523 0.824
Ownership Variables
IO_FORt-1 136,980 0.040 0.087 0.000 0.000 0.006 0.042 1.000
IO_DOMt-1 136,980 0.167 0.272 0.000 0.000 0.023 0.196 1.000
Control Variables
SIZEt-1 136,980 5.478 2.217 0.255 3.930 5.412 6.970 10.572
MBt-1 136,980 2.430 4.453 -6.121 0.789 1.404 2.527 34.381
LEVt-1 136,980 0.597 1.404 0.000 0.005 0.145 0.523 9.927
ROEt-1 136,980 0.044 0.477 -2.665 -0.001 0.083 0.176 2.002
VOLPt-1 136,980 0.619 2.133 0.008 0.050 0.108 0.266 17.208
DIVt-1 136,980 0.588 0.492 0.000 0.000 1.000 1.000 1.000
log(1+AGE)t 136,980 2.621 0.642 0.000 2.197 2.639 3.091 3.892
Interacting Variables
FSt 136,980 0.259 0.315 0.000 0.000 0.106 0.476 1.000
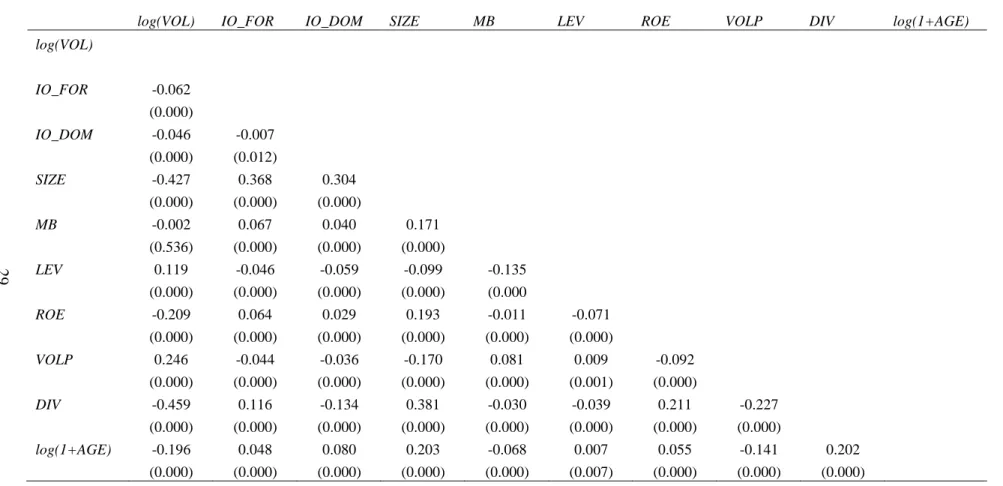
Table 3: Correlation Coefficients
This table shows correlation coefficients of key variables. The sample period is from 2001 to 2012. The variable definitions are provided in Appendix A. The p-values are reported in parentheses.
log(VOL) IO_FOR IO_DOM SIZE MB LEV ROE VOLP DIV log(1+AGE)
log(VOL)
IO_FOR -0.062
(0.000)
IO_DOM -0.046 -0.007
(0.000) (0.012)
SIZE -0.427 0.368 0.304
(0.000) (0.000) (0.000)
MB -0.002 0.067 0.040 0.171
(0.536) (0.000) (0.000) (0.000)
LEV 0.119 -0.046 -0.059 -0.099 -0.135
(0.000) (0.000) (0.000) (0.000) (0.000
ROE -0.209 0.064 0.029 0.193 -0.011 -0.071
(0.000) (0.000) (0.000) (0.000) (0.000) (0.000)
VOLP 0.246 -0.044 -0.036 -0.170 0.081 0.009 -0.092
(0.000) (0.000) (0.000) (0.000) (0.000) (0.001) (0.000)
DIV -0.459 0.116 -0.134 0.381 -0.030 -0.039 0.211 -0.227
(0.000) (0.000) (0.000) (0.000) (0.000) (0.000) (0.000) (0.000)
log(1+AGE) -0.196 0.048 0.080 0.203 -0.068 0.007 0.055 -0.141 0.202
(0.000) (0.000) (0.000) (0.000) (0.000) (0.007) (0.000) (0.000) (0.000)
30
Table 4: The Effect of Foreign Sales on the Relation between Foreign Institutional Ownership and Volatility
This table shows results of panel regressions of the log of volatility on foreign institutional ownership conditional on foreign sales and the tertile membership of foreign sales. The sample period is from 2001 to 2012. I run fixed effect regressions including country, industry and year dummies. The standard errors are corrected for firm-level clustering. The explanatory variables are all lagged by one period except the log of one plus age, foreign sales and the tertile membership of foreign sales. The definitions of all variables are provided in Appendix A. The standard errors are reported in parentheses. *,**,*** indicate significance at the 10%, 5% and 1% level.
(1) (2) (3)
IO_FORt-1 0.455*** 0.688*** 0.597***
(0.035) (0.047) (0.054)
IO_FORt-1x FSt -0.535***
(0.074)
IO_FORt-1x TERTILE2t 0.020
(0.082)
IO_FORt-1x TERTILE3t -0.268***
(0.065)
IO_DOMt-1 -0.126*** -0.132*** -0.140***
(0.011) (0.011) (0.011)
SIZEt-1 -0.069*** -0.074*** -0.074***
(0.001) (0.001) (0.001)
MBt-1 0.004*** 0.004*** 0.004***
(0.000) (0.000) (0.000)
LEVt-1 0.038*** 0.038*** 0.038***
(0.002) (0.002) (0.002)
ROEt-1 -0.089*** -0.087*** -0.088***
(0.004) (0.004) (0.004)
VOLPt-1 0.027*** 0.028*** 0.028***
(0.001) (0.001) (0.001)
DIVt-1 -0.300*** -0.296*** -0.297***
(0.005) (0.005) (0.005)
log(1+AGE)t -0.033*** -0.032*** -0.034***
(0.003) (0.003) (0.003)
FSt 0.132***
(0.008)
TERTILE2t 0.045***
(0.006)
TERTILE3t 0.095***
(0.006)
Observations 136,980 136,980 136,980
31
Table 5: The Determinants of the Relation between Foreign Institutional Ownership and Volatility
This table shows results of panel regressions of the log of volatility on foreign institutional ownership conditional on foreign sales and foreign assets. The sample period is from 2001 to 2012. I run fixed effect regressions including country, industry and year dummies. The standard errors are corrected for firm-level clustering. The explanatory variables are all lagged by one period except the log of one plus age, foreign sales and foreign assets. The definitions of all variables are provided in Appendix A. The standard errors are reported in parentheses. *,**,*** indicate significance at the 10%, 5% and 1% level.
(1) (2) (3)
IO_FORt-1 0.688*** 0.551*** 0.698***
(0.047) (0.045) (0.050)
IO_FORt-1x FSt -0.535*** -0.615***
(0.074) (0.095)
IO_FORt-1x FAt -0.303*** 0.171
(0.098) (0.118)
IO_DOMt-1 -0.132*** -0.107*** -0.114***
(0.011) (0.013) (0.012)
SIZEt-1 -0.074*** -0.077*** -0.079***
(0.001) (0.002) (0.002)
MBt-1 0.004*** 0.004*** 0.004***
(0.000) (0.000) (0.000)
LEVt-1 0.038*** 0.039*** 0.039***
(0.002) (0.002) (0.002)
ROEt-1 -0.087*** -0.084*** -0.083***
(0.004) (0.004) (0.004)
VOLPt-1 0.028*** 0.028*** 0.028***
(0.001) (0.001) (0.001)
DIVt-1 -0.296*** -0.303*** -0.301***
(0.005) (0.005) (0.005)
log(1+AGE)t -0.032*** -0.031*** -0.031***
(0.003) (0.004) (0.004)
FSt 0.132*** 0.104***
(0.008) (0.010)
FAt 0.154*** 0.070***
(0.011) (0.013)
Observations 136,980 113,216 113,216
32
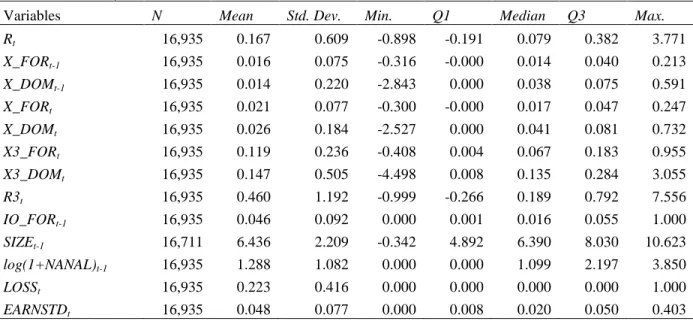
Table 6: Summary Statistics and Correlation Coefficients of Variables in the Analysis of the Future Earnings Response Coefficients
This table provides summary statistics and correlation coefficients of variables used in the analysis of the future earnings response coefficients. Panel A reports summary statistics for all firms in the sample. Panel B reports correlation coefficients for all firms in the sample. The sample period is from 2001 to 2010. Refer to Appendix A for variable definitions.
Panel A: Summary Statistics
Variables N Mean Std. Dev. Min. Q1 Median Q3 Max.
Rt 16,935 0.167 0.609 -0.898 -0.191 0.079 0.382 3.771
X_FORt-1 16,935 0.016 0.075 -0.316 -0.000 0.014 0.040 0.213
X_DOMt-1 16,935 0.014 0.220 -2.843 0.000 0.038 0.075 0.591
X_FORt 16,935 0.021 0.077 -0.300 -0.000 0.017 0.047 0.247
X_DOMt 16,935 0.026 0.184 -2.527 0.000 0.041 0.081 0.732
X3_FORt 16,935 0.119 0.236 -0.408 0.004 0.067 0.183 0.955
X3_DOMt 16,935 0.147 0.505 -4.498 0.008 0.135 0.284 3.055
R3t 16,935 0.460 1.192 -0.999 -0.266 0.189 0.792 7.556
IO_FORt-1 16,935 0.046 0.092 0.000 0.001 0.016 0.055 1.000
SIZEt-1 16,711 6.436 2.209 -0.342 4.892 6.390 8.030 10.623
log(1+NANAL)t-1 16,935 1.288 1.082 0.000 0.000 1.099 2.197 3.850
LOSSt 16,935 0.223 0.416 0.000 0.000 0.000 0.000 1.000
EARNSTDt 16,935 0.048 0.077 0.000 0.008 0.020 0.050 0.403
Panel B: Correlation Coefficients
Rt X_FORt-1 X_DOMt-1 X_FORt X_DOMt X3_FORt X3_DOMt R3t
Rt
X_FORt-1 -0.047
(0.000)
X_DOMt-1 -0.044 0.010
(0.000) (0.215)
X_FORt 0.125 0.520 0.096
(0.000) (0.000) (0.000)
X_DOMt 0.058 0.088 0.529 -0.080
(0.000) (0.000) (0.000) (0.000)
X3_FORt 0.251 0.315 0.010 0.465 0.027
(0.000) (0.000) (0.197) (0.000) (0.001)
X3_DOMt 0.174 0.020 0.323 0.026 0.448 -0.032
(0.000) (0.010) (0.000) (0.001) (0.000) (0.000)
R3t -0.090 -0.014 -0.036 -0.012 -0.014 0.243 0.207
33
Table 7: Regressions of Current Returns on Future Earnings from Foreign Operations and Interactions with Foreign Institutional Ownership
This table shows results of Ordinary Least Squares regression estimation results. The sample period is from 2001 to 2010. Column (1) reports the estimates of the following regression:
Column (2) reports the estimates of the above regression including interactions with foreign institutional
ownership. Foreign institutional ownership is lagged by one period. The definitions of all variables are provided in Appendix A. The standard errors corrected for firm-level clustering are reported in
parentheses. *,**,*** indicate significance at the 10%, 5% and 1% level.
(1) (2)
X_FORt-1 -1.703*** -1.790***
(0.129) (0.141)
X_DOMt-1 -0.471*** -0.515***
(0.064) (0.067)
X_FORt 0.653*** 0.834***
(0.139) (0.149)
X_DOMt 0.123* 0.230***
(0.072) (0.073)
X3_FORt 0.891*** 0.838***
(0.039) (0.043)
X3_DOMt 0.331*** 0.307***
(0.027) (0.028)
R3t -0.122*** -0.115***
(0.006) (0.006)
IO_FORt-1 -0.170*
(0.092)
IO_FORt-1x X_FORt-1 2.837**
(1.313)
IO_FORt-1x X_DOMt-1 2.213**
(1.123)
IO_FORt-1x X_FORt -5.351***
(1.396)
IO_FORt-1x X_DOMt -4.402***
(1.110)
IO_FORt-1x X3_FORt 1.415***
(0.383)
IO_FORt-1x X3_DOMt 0.961***
(0.373)
IO_FORt-1x R3t -0.198***
(0.065)
Observations 16,935 16,935
34
Table 8: Regressions of Current Returns on Future Earnings from Foreign Operations and Interactions with Foreign Institutional Ownership and Controls for the Determinants of the Future Earnings Response Coefficients
This table shows results of Ordinary Least Squares regression estimation results. The sample period is from 2001 to 2010. The columns report the estimates of the following regression including interactions with foreign institutional ownership and 4 different control variables:
Foreign institutional ownership, size and the log of one plus the number of analysts are lagged by one
period. The definitions of all variables are provided in Appendix A. The standard errors are corrected for firm-level clustering. *,**,*** indicate significance at the 10%, 5% and 1% level.
Model (1) (2) (3) (4)
SIZEt-1 log(1+NANAL)t-1 LOSSt EARNSTDt
X_FORt-1 -1.736*** -1.818*** -1.736*** -1.898***
X_DOMt-1 -0.568*** -0.501*** -0.408*** -0.733***
X_FORt 1.264*** 1.223*** 0.843*** 1.124***
X_DOMt 0.391*** 0.317*** 0.252*** 0.421***
X3_FORt 0.648*** 0.693*** 1.089*** 0.806***
X3_DOMt 0.172*** 0.224*** 0.382*** 0.499***
R3t -0.104*** -0.096*** -0.126*** -0.133***
IO_FORt-1 0.171* -0.005 -0.149* -0.128
IO_FORt-1x X_FORt-1 2.989** 3.122** 2.430** 2.491**
IO_FORt-1x X_DOMt-1 1.759 2.243* 1.841* 1.824*
IO_FORt-1x X_FORt -4.748*** -4.067*** -4.798*** -4.581***
IO_FORt-1x X_DOMt -4.152*** -3.531*** -3.883*** -3.606***
IO_FORt-1x X3_FORt 1.065*** 0.825** 1.225*** 1.236***
IO_FORt-1x X3_DOMt 0.520 0.178 0.889** 0.710*
IO_FORt-1x R3t -0.196*** -0.147** -0.183*** -0.152**
Control -0.041*** -0.041*** -0.020 1.485***
Control x X_FORt-1 0.025 0.060 0.252 2.025*
Control x X_DOMt-1 0.029 -0.007 -0.057 1.422***
Control x X_FORt -0.079 -0.525*** 0.216 -0.836
Control x X_DOMt -0.029 -0.162** 0.086 -0.955**
Control x X3_FORt 0.036* 0.193*** -1.691*** -0.896***
Control x X3_DOMt 0.032** 0.143*** -0.242*** -0.981***
Control x R3t -0.003 -0.023*** 0.041*** 0.077
Observations 16,711 16,935 16,935 16,935
35
APPENDIX A: VARIABLE DEFINITIONS
Variable Name Description Dependent Variables
VOLt standard deviation of weekly returns multiplied by in year t
log(VOL)t log of standard deviation of weekly returns multiplied by in year t
Ownership Variables
IO_FORt-1 number of shares held by foreign institutions divided by total number of shares
outstanding at the end of year t-1
IO_DOMt-1 number of shares held by domestic institutions divided by total number of
shares outstanding at the end of year t-1
Control Variables
MVt-1 market value of equity ($ mil) at the end of year t-1
SIZEt-1 log of market value of equity ($ mil) at the end of year t-1
MBt-1 market value of equity divided by book value of equity in year t-1
LEVt-1 long-term debt divided by market value of equity in year t-1
ROEt-1 net income before extraordinary items in year t-1 divided by book value of equity at the end of year t-2
VOLPt-1 standard deviation of ROEs using the previous 6 years of data for year t-1
DIVt-1 indicator variable set to 1 if the firm pays dividends and 0 if the firm does not pay dividends in year t-1
AGEt number of years since firms appear on Datastream in year t
log(1+AGE)t log of one plus the number of years since firms appear on Datastream in year t
Interacting Variables
FSt foreign sales divided by total sales in year t
FAt foreign assets divided by total assets in year t
Variables in the Future Earnings Response Coefficient Regressions
Rt buy-and-hold return for year t over the 12-month period ending three months after the year t fiscal year-end
R3t buy-and-hold return for the three-year period following year t starting three months after the year t fiscal year-end
X_FORt-1 foreign operating income less net interest expense allocated to foreign
operations in year t-1 scaled by market value of equity three months after the year t-1 fiscal year-end
X_FORt foreign operating income less net interest expense allocated to foreign
operations in year t scaled by market value of equity three months after the year t-1 fiscal year-end
X3_FORt sum of foreign operating income less net interest expense allocated to foreign
operations for 3-year period from year t+1 to year t+3 scaled by market value of equity three months after the year t-1 fiscal year-end
X_DOMt-1 domestic operating income less net interest expense allocated to domestic
36
APPENDIX A (CONTINUED)
X_DOMt domestic operating income less net interest expense allocated to domestic
operations in year t scaled by market value of equity three months after the year t-1 fiscal year-end
X3_DOMt sum of domestic operating income less net interest expense allocated to
domestic operations for 3-year period from year t+1 to year t+3 scaled by market value of equity three months after the year t-1 fiscal year-end
NANALt-1 number of analysts following the firm at the end of year t-1
log(1+NANAL)t-1 log of one plus the number of analysts following the firm at the end of year t-1
LOSSt variable set to1 if X3_FORt is negative, and 0 otherwise
37
APPENDIX B: THE LIST OF COUNTRIES BY GEOGRAPHIC REGION
Europe
Austria, Belgium, Czech Republic, Denmark, Finland, France, Germany, Greece, Hungary, Ireland, Italy, Netherlands, Norway, Poland, Portugal, Russia, Spain, Sweden, Switzerland, United Kingdom
Middle East & Africa
Egypt, Israel, South Africa, Turkey
Asia Pacific
Australia, China, Hong Kong, India, Indonesia, Japan, Malaysia, New Zealand, Philippines, Singapore, South Korea, Taiwan, Thailand
North America
Canada, Mexico, United States
South America
38
REFERENCES
Bae, K.-H., A. Ozoguz, H. Tan, and T. S. Wirjanto (2012). Do foreigners facilitate information transmission in emerging markets? Journal of Financial Economics 105 (1), 209-227. Campbell, J. Y. and A. S. Kyle (1993). Smart money, noise trading and stock price behaviour.
The Review of Economic Studies 60 (1), 1-34.
Campbell, J. Y., M. Lettau, B. G. Malkiel, and Y. Xu (2001). Have individual stocks become more volatile? An empirical exploration of idiosyncratic risk. The Journal of Finance 56
(1), 1-43.
Chen, Q., I. Goldstein, and W. Jiang (2007). Price informativeness and investment sensitivity to stock price. Review of Financial Studies 20 (3), 619-650.
Choe, H., B.-C. Kho, and R. M. Stulz (1999). Do foreign investors destabilize stock markets? The Korean experience in 1997. Journal of Financial Economics 54 (2), 227-264. Collins, D. W., S. Kothari, J. Shanken, and R. G. Sloan (1994). Lack of timeliness and noise as
explanations for the low contemporaneous return-earnings association. Journal of Accounting and Economics 18 (3), 289-324.
Coval, J. D. and T. J. Moskowitz (1999). Home bias at home: Local equity preference in domestic portfolios. The Journal of Finance 54 (6), 2045-2073.
Coval, J. D. and T. J. Moskowitz (2001). The geography of investment: Informed trading and asset prices. Journal of Political Economy 109 (4), 811-841.
De Long, J. B., A. Shleifer, L. H. Summers, and R. J. Waldmann (1990). Noise trader risk in financial markets. Journal of political Economy, 703-738.
Ferreira, M. A. and P. Matos (2008). The colors of investors’ money: The role of institutional investors around the world. Journal of Financial Economics 88 (3), 499-533.
Friedman, M. (1953). The case for flexible exchange rates. University of Chicago Press. Grinblatt, M. and M. Keloharju (2000). The investment behavior and performance of various
investor types: a study of Finland’s unique data set. Journal of Financial Economics55
(1), 43-67.
39
Hau, H. (2001). Location matters: An examination of trading profits. The Journal of Finance 56 (5), 1959-1983.
He, W., D. Li, J. Shen, and B. Zhang (2013). Large foreign ownership and stock price
informativeness around the world. Journal of International Money and Finance 36, 211- 230.
Karolyi, G. A. (2002). Did the Asian financial crisis scare foreign investors out of Japan?
Pacific-Basin Finance Journal 10 (4), 411-442.
Karolyi, G. A. and R. M. Stulz (2003). Are financial assets priced locally or globally? Handbook of the Economics of Finance 1, 975-1020.
Levine, R. (1997). Financial development and economic growth: views and agenda. Journal of Economic Literature, 688-726.
LONG, J. B., A. Shleifer, L. H. Summers, and R. J. Waldmann (1990). Positive feedback investment strategies and destabilizing rational speculation. The Journal of Finance 45
(2), 379-395.
Lundholm, R. and L. A. Myers (2002). Bringing the future forward: The effect of disclosure on the returns-earnings relation. Journal of Accounting Research 40 (3), 809-839.
Orpurt, S. F. and Y. Zang (2009). Do direct cash flow disclosures help predict future operating cash flows and earnings? The Accounting Review 84 (3), 893-935.
Pastor, L. and V. Pietro (2003). Stock valuation and learning about profitability. The Journal of Finance 58 (5), 1749-1790.
Rubin, A. and D. R. Smith (2009). Institutional ownership, volatility and dividends. Journal of Banking & Finance 33 (4), 627-639.
Shiller, R. J. (1981). Do stock prices move too much to be justified by subsequent changes in dividends? The American Economic Review 71 (3), 421-436.