PROBING THE EARLY UNIVERSE USING DARK MATTER MINIHALOS
M. Sten Delos
A dissertation submitted to the faculty at the University of North Carolina at Chapel Hill in partial fulfillment of the requirements for the degree of Doctor of Philosophy in the Department of Physics
and Astronomy.
Chapel Hill 2020
Approved by:
Adrienne L. Erickcek
Joaquín E. Drut
Charles R. Evans
Fabian Heitsch
c
2020 M. Sten Delos
ABSTRACT
M. Sten Delos: Probing the Early Universe Using Dark Matter Minihalos (Under the direction of Adrienne L. Erickcek)
Through their observable properties, the first and smallest dark matter halos represent a rare
probe of subkiloparsec-scale variations in the density of the early Universe. These density variations
could hold clues to the nature of inflation, the postinflationary cosmic history, and the identity
of dark matter. However, the dynamical complexity of these minihalos hinders their usage as
cosmological probes. A theoretical understanding of the minihalo-cosmology connection demands
numerical simulation, but minihalos are too small and dense to simulate up to the present day
in full cosmological context. This dissertation meets this challenge by using controlled numerical
simulations to develop (semi)analytic models of dark matter structure. These models describe the
formation of the first halos and their subsequent evolution as they accrete onto larger systems, both
through tidal forces and encounters with other objects. I also explore two observational applications
of the minihalo-cosmology connection: breaking a degeneracy between the properties of thermal-relic
dark matter and the postinflationary history, and probing inflation’s late stages via the small-scale
ACKNOWLEDGEMENTS
I wish to thank my advisor, Adrienne Erickcek, for her invaluable mentorship and guidance. I also
thank my other collaborators Tim Linden, Dan Hooper, Marcelo Alvarez, Margie Bruff, Avery Bailey,
and Carlos Blanco. Special thanks to Annika Peter for discussions and professional guidance. I am
especially grateful to my wife, Sara Delos, for ever inspiring me to aim higher. Finally, I thank my
parents and my sister Marcy for their support and interest in this endeavor. I gratefully acknowledge
funding support from the Graduate School at the University of North Carolina at Chapel Hill, which
funded my last year in graduate school through the Dissertation Completion Fellowship, and the
Kenan Trust at the University of North Carolina at Chapel Hill, which supplied a Graduate Student
Research Grant. My research was also supported by the following sources. The research described
in Chapter 2 was partially supported by NSF Grant No. PHY-1417446 (PI A. Erickcek) and by
the Bahnson Fund at the University of North Carolina at Chapel Hill. The research described in
Chapters 3 and 4 was partially supported by NSF Grant No. PHY-1752752 (PI A. Erickcek). The
research described in Chapters 5 and 7 was funded by NASA through Fermi Guest Investigator
Cycle 10 Award No. 80NSSC17K0751 (PI A. Erickcek). Finally, the research described in Chapter 6
was funded by a Graduate Research Fellowship from the North Carolina Space Grant Consortium.
My research made extensive use of the Killdevil, Dogwood, and Longleaf computing clusters at the
TABLE OF CONTENTS
LIST OF FIGURES . . . xii
LIST OF TABLES . . . xvii
LIST OF ABBREVIATIONS AND SYMBOLS . . . xviii
CHAPTER 1: INTRODUCTION . . . 1
1.1 Cosmic history . . . 1
1.2 Dark matter minihalos as cosmological probes . . . 7
1.2.1 Ultracompact minihalos and probing inflation . . . 8
1.2.2 Halo formation prior to matter domination, and probing hidden sectors . . . 10
1.2.3 Predicting the structures of dark matter halos . . . 10
1.2.4 Breaking a degeneracy between dark matter and the early Universe . . . 12
CHAPTER 2: DENSITY PROFILES OF ULTRACOMPACT MINIHALOS: IMPLICATIONS FOR CONSTRAINING THE PRIMORDIAL POWER SPECTRUM . . . 14
2.1 Introduction . . . 14
2.1.1 Theρ∝r−9/4 density profile . . . 15
2.1.2 Modeling halo populations to probe the primordial power spectrum . . . 16
2.2 Simulation preparation . . . 17
2.2.1 Power spectrum . . . 17
2.2.2 Simulation setup . . . 18
2.2.3 N-body code . . . 20
2.3 Simulation results . . . 21
2.3.1 Density profiles . . . 22
2.3.2 Mass accretion . . . 26
2.3.4 Other minihalos . . . 28
2.3.5 Power spectrum with step . . . 30
2.4 Conditions for theρ∝r−9/4 density profile . . . 31
2.5 Constraining the power spectrum . . . 33
2.5.1 Halo luminosity . . . 35
2.5.2 Halo abundance . . . 37
2.5.3 The power spectrum . . . 39
2.5.4 Discussion . . . 42
2.6 Conclusion . . . 46
CHAPTER 3: FORMATION OF MINIHALOS BEFORE THE MATTER-DOMINATED EPOCH . . . 49
3.1 Introduction . . . 49
3.2 Analytic growth and collapse . . . 51
3.3 Numerical simulations . . . 53
3.3.1 Simulation methods . . . 53
3.3.2 Simulating collapse during radiation domination . . . 54
3.4 Conclusion . . . 58
CHAPTER 4: PREDICTING THE DENSITY PROFILES OF THE FIRST HALOS . . . 59
4.1 Introduction . . . 59
4.2 Simulations . . . 62
4.3 Density profile at small radii . . . 68
4.3.1 Spherical collapse . . . 69
4.3.2 Ellipsoidal collapse . . . 72
4.4 Density profile at large radii . . . 73
4.4.1 Turnaround . . . 74
4.4.2 Contraction . . . 77
4.4.3 Virialization . . . 81
4.5 Predicting halo populations . . . 86
4.5.1 Population comparisons . . . 86
4.5.2 Halo mergers . . . 91
4.6 Conclusion . . . 91
CHAPTER 5: TIDAL EVOLUTION OF DARK MATTER ANNIHILATION RATES IN SUBHALOS . . . 95
5.1 Introduction . . . 95
5.2 Simulations . . . 98
5.3 Trends in the tidal evolution . . . 102
5.3.1 Trends in the simulations . . . 103
5.3.2 Physical interpretation . . . 105
5.4 Modeling the tidal evolution . . . 108
5.4.1 Parameterb: The initialJ-factor decay rate . . . 110
5.4.2 Parametera: TheJ-factor normalization . . . 114
5.4.3 Parameterc: The loss of tidal efficiency . . . 115
5.5 Model summary and discussion . . . 118
5.6 Comparison to previous work . . . 121
5.6.1 Comparison to a tidal heating model . . . 122
5.6.2 Comparison to a tidal stripping model . . . 124
5.7 Conclusion . . . 126
CHAPTER 6: EVOLUTION OF DARK MATTER MICROHALOS THROUGH STELLAR ENCOUNTERS . . . 128
6.1 Introduction . . . 128
6.2 Simulations . . . 130
6.3 Parametrization of encounters . . . 134
6.4 Impact of distant encounters . . . 135
6.4.1 Successive encounters . . . 136
6.4.2 First encounter . . . 139
6.5 Penetrative encounters . . . 141
6.7 Conclusion . . . 149
CHAPTER 7: BREAKING A DARK DEGENERACY: THE GAMMA-RAY SIGNATURE OF EARLY MATTER DOMINATION . . . 151
7.1 Introduction . . . 151
7.2 Early matter domination . . . 153
7.2.1 Relic density of dark matter . . . 154
7.2.2 Growth of density perturbations . . . 155
7.3 Microhalos and their properties . . . 158
7.3.1 Modeling the microhalo population . . . 159
7.3.2 Annihilation within microhalos . . . 160
7.3.3 Microhalo density profiles . . . 164
7.4 Isotropic gamma-ray background . . . 166
7.4.1 Limits on annihilation . . . 167
7.4.2 Tidal suppression . . . 168
7.5 Gamma rays from the Draco dwarf . . . 172
7.5.1 Suppression of annihilation rates . . . 174
7.5.2 Gamma-ray emission . . . 178
7.5.3 Limits on annihilation . . . 180
7.6 Conclusion . . . 184
CHAPTER 8: CONCLUSION . . . 186
APPENDIX A: TECHNICAL DETAILS ON SIMULATIONS OF ULTRA-COMPACT MINIHALOS AND CONSTRAINING THE PRIMORDIAL POWER SPECTRUM . . . 189
A.1 Simulations prior to the matter-dominated era . . . 189
A.2 Convergence testing and simulation parameters . . . 191
A.2.1 Simulation parameters . . . 191
A.2.2 Procedure, results, and discussion . . . 193
A.2.3 The smallest resolved radius . . . 198
A.2.4 Summary of simulation choices . . . 199
A.4 Constraining the power spectrum using the statistics of peaks . . . 201
A.5 The UCMH constraint on a spiked power spectrum . . . 204
APPENDIX B: THE COLLAPSE THRESHOLD δc DURING RADIATION DOMINATION . . . 206
APPENDIX C: TECHNICAL DETAILS ON PREDICTING THE DENSITY PROFILES OF THE FIRST HALOS . . . 208
C.1 Collecting halo data . . . 208
C.2 Collecting peak parameters . . . 209
C.3 Predicting the halo population from the power spectrum . . . 210
C.3.1 Number density of peaks . . . 211
C.3.2 AsymptoteA . . . 212
C.3.3 Outer profile: rmax and M(rmax) . . . 213
APPENDIX D: TECHNICAL DETAILS ON SIMULATING AND MODELING THE TIDAL EVOLUTION OF SUBHALOS . . . 217
D.1 Simulation details . . . 217
D.1.1 High- and low-resolution particles . . . 217
D.1.2 Density profiles andJ factors . . . 217
D.1.3 Numerical convergence . . . 220
D.2 Subhalo size . . . 220
D.3 Computational details . . . 221
D.3.1 Computingx=|Eb|/∆Eimp . . . 222
D.3.2 Computingy= ¯R/Rs . . . 223
D.3.3 Computingz=ra/rt . . . 224
D.3.4 ComputingT . . . 225
D.4 Comparison to the DASH library . . . 225
D.5 The broader density profile . . . 226
D.5.1 Relations between structural parameters . . . 227
D.5.2 Time evolution of structural parameters . . . 228
STELLAR ENCOUNTERS ON MICROHALO DENSITY PROFILES . . . 232
E.1 Accuracy of the impulse approximation . . . 232
E.2 Encounters in close succession . . . 233
E.3 Impact of encounters on the phase-space distribution . . . 234
APPENDIX F: TECHNICAL DETAILS AND FURTHER MODEL DEVELOP-MENT FOR PREDICTING THE GAMMA-RAY SIGNATURE OF EARLY MATTER DOMINATION . . . 236
F.1 Baryonic suppression of small-scale dark matter density fluctuations . . . 236
F.2 Aggregate tidal suppression of subhalo annihilation rates . . . 238
F.3 J-factor oscillations during subhalo orbits . . . 240
F.4 Combined impact of tidal forces and stellar encounters . . . 242
F.5 Draco’s outer density profile . . . 247
LIST OF FIGURES
1.1 The cosmic expansion history. . . 2
1.2 Evolution of the energy density of the Universe. . . 2
1.3 A schematic cosmic history. . . 3
1.4 Observational constraints on primordial density variations. . . 4
1.5 Density evolution that gives rise to an EMDE . . . 6
1.6 Growth of density perturbations during an EMDE. . . 6
1.7 A depiction of dark matter freeze-out. . . 9
2.1 The dimensionless primordial power spectrum used in our UCMH simulations. . . 18
2.2 A slice of the initial density field for our UCMH simulation. . . 20
2.3 Evolution of the density field in our UCMH simulation. . . 22
2.4 Final density field in our UCMH simulation. . . 23
2.5 The density profile of a simulated UCMH. . . 24
2.6 The density profiles of nine different simulated UCMHs. . . 25
2.7 Mass evolution of UCMHs. . . 26
2.8 A UCMH merger event. . . 27
2.9 Density profiles of later-forming halos. . . 29
2.10 UCMH arising from a step-amplified power spectrum. . . 30
2.11 The density profile of a halo that formed from a uniformly dense ellipsoid. . . 33
2.12 Dark matter density as a function of distance from Earth. . . 39
2.13 Minihalo-derived upper bound on primordial power. . . 42
2.14 Minihalo-derived upper bound on the matter power spectrum. . . 45
2.15 Projected impact of halo mergers on primordial power bounds. . . 48
3.1 Growth of density contrasts after an EMDE in linear and spherical collapse theory. . 52
3.2 Demonstration of GADGET-2 EMDE modifications. . . 54
3.3 How a halo forms during radiation domination. . . 55
3.4 Dependence of the collapsed structure during radiation domination on properties of the initial peak. . . 56
4.1 The matter power spectra used for our simulations. . . 63
4.2 Initial and final density fields in our simulations. . . 66
4.3 Example peak in the primordial density field. . . 69
4.4 Evolution of a halo’s density profile immediately after collapse. . . 70
4.5 Density profile asymptotic coefficient A: model prediction versus simulation. . . 70
4.6 Model scatter inA. . . 72
4.7 Turnaround model predictions compared to simulation results. . . 76
4.8 Corrected turnaround model predictions compared to simulation results. . . 77
4.9 Scatter inrmax and Mmaxrelative to model predictions. . . 78
4.10 Density profiles contributed to a halo by different initial mass shells. . . 79
4.11 Contraction model predictions compared to simulation results. . . 80
4.12 Virialization model predictions compared to simulation results. . . 82
4.13 Comparison between predicted mass profiles and simulations. . . 85
4.14 Comparison between predicted and simulated halo populations as distributed in the asymptotic coefficientA. . . 88
4.15 Comparison between predicted and simulated halo populations as distributed in rmax. 89 4.16 Impact of halo mergers on their density profiles. . . 92
5.1 A simulated microhalo orbiting a galactic halo. . . 101
5.2 Density profile evolution of a microhalo orbiting a galactic halo. . . 102
5.3 Trajectories of a subhalo’s J factor for different systems with the samex˜= Rcρs RsPs andη.103 5.4 Trajectories of a subhalo’sJ factor for different orbital shapes. . . 105
5.5 Impact of orbit shape on a subhalo’sJ factor trajectory. . . 106
5.6 Impact of the orbital radius on theJ-factor trajectory. . . 107
5.7 Summary of the tidal evolution simulations. . . 109
5.8 Demonstration of the fitting procedure for J-factor trajectories. . . 110
5.9 The dependence of the trajectory parameterbon system parameters in the self-similar regime. . . 111
5.10 The dependence of the trajectory parameter bon the system parameters x andy. . . 113
5.11 The dependence of the trajectory parameter aon the orbital radius parameter y. . . 115
5.13 The dependence of the trajectory parameter con the system parameter z. . . 118
5.14 Comparison between our tidal evolution model and a tidal heating model. . . 123
5.15 Comparison between our tidal evolution model and a tidal stripping model. . . 125
6.1 Picture of a microhalo subjected to a stellar encounter. . . 132
6.2 Density profile evolution of a microhalo subjected to a stellar encounter. . . 133
6.3 Distribution of the stellar encounter simulations. . . 135
6.4 Demonstration of the universality of the postencounter density profile. . . 136
6.5 The change in a microhalo’s scale radius in response to encounters with different energy parametersq. . . 137
6.6 The change in a microhalo’s scale density in response to different impulsive encounter.138 6.7 Evolution of initially NFW microhalos through stellar encounters. . . 140
6.8 Comparison between an NFW profile and the “equivalent” postencounter profile. . . 141
6.9 A test of model predictions for penetrative encounters. . . 142
6.10 The impact of nonlinear terms in the encounter-induced velocity injections. . . 143
6.11 The density profiles of microhalos whose central cusps are disrupted by penetrative stellar encounters. . . 144
6.12 Comparing model predictions to simulations for a microhalo traversing a field of stars.146 6.13 Equivalence of the postencounter density profile to the NFW density profile, for the purpose of further stellar encounters. . . 147
6.14 Mass evolution for microhalos crossing the solar neighborhood, as predicted using our model. . . 148
7.1 Influence of early matter domination on thermal-relic dark matter properties. . . 154
7.2 Influence of reheat temperature on thermal-relic dark matter properties. . . 156
7.3 Influence of early matter domination on dark matter density variations. . . 157
7.4 Mass profiles of example halos sampled using the model in Chapter 4. . . 161
7.5 The global annihilation boost factor due to various EMDE scenarios. . . 163
7.6 Distribution of microhalo properties in an EMDE scenario. . . 165
7.7 Mass function of halos arising from an EMDE scenario: comparison between the Chapter 4 and Press-Schechter models. . . 166
7.8 Impact of EMDE parameters on microhalo properties. . . 167
7.10 Suppression of the dark matter annihilation rate within microhalos due to subhalo evolution. . . 171
7.11 Suppression of the dark matter annihilation rate within microhalos inside the Galactic halo due to tidal effects. . . 173
7.12 Suppression of dark matter annihilation rates within the Draco dwarf galaxy due to tidal effects and stellar encounters. . . 175
7.13 Impact of encounters between microhalos on the dark matter annihilation rate inside Draco. . . 177
7.14 Influence of tidal evolution and stellar encounters on the flux profile from dark matter annihilation within microhalos inside Draco. . . 179
7.15 Signatures of dark matter annihilation within microhalos inside Draco as a function of EMDE scenario. . . 180
7.16 Influence of the assumed annihilation signal morphology on the observational bound on total flux from Draco. . . 182
7.17 Constraints on thermal-relic dark matter in early matter-dominated cosmologies using the Draco dwarf galaxy. . . 183
A.1 Growth of fluctuations in the Gadget-2 simulation code modified to include radiation.191
A.2 Evolution of the density field in the Gadget-2 simulation code modified to include radiation. . . 191
A.3 Convergence of the UCMH density profile with respect to simulation parameters. . . 194
A.4 Convergence of the UCMH density profile with respect to force softening. . . 196
A.5 Demonstration that transient, localized fluctuations in the UCMH density profile are a simulation artifact. . . 197
A.6 Artificial fragmentation in our UCMH simulation. . . 198
A.7 Noninfluence of the use of vacuum boundary conditions on our UCMH simulation. . 199
A.8 The differential peak height distribution. . . 203
B.1 The linear collapse threshold δc during radiation domination. . . 207
C.1 Density profiles of three random halos from each simulation. . . 209
C.2 Density profiles of three random peaks in the initial density field of each simulation. 211
D.1 Absence of artificial relaxation effects associated with the use of different particle masses. . . 218
D.2 Simulations of the same tidal evolution scenario carried out with different simulation parameters. . . 220
D.3 Influence of a subhalo’s size on its tidal evolution. . . 221
D.4 A resolution comparison between our simulations and those of the DASH library. . . 223
D.5 A test of our tidal evolution model against the DASH simulations. . . 224
D.6 The relationship between a subhalo’s structural properties and its bound mass. . . . 227
D.7 The relationship between a subhalo’s J factor and its structural parameters. . . 228 D.8 Parameters br andbv of a subhalo’s structural evolution plotted against host-subhalo
system parameters. . . 229
D.9 Parameters ar andav of a subhalo’s structural evolution plotted against host-subhalo system parameters. . . 230
D.10 Parameters cr andcv of a subhalo’s structural evolution plotted against host-subhalo system parameters. . . 231
E.1 A test of the impulse approximation. . . 233
E.2 The impact of two encounters separated by a short time interval. . . 234
E.3 Phase-space density of a microhalo before and after different stellar encounters. . . . 235
F.1 Oscillations in subhaloJ-factors due to periodic compression and expansion. . . 240 F.2 Validation and tuning of a model describing the periodic oscillations in a subhalo’s
J-factor. . . 241
F.3 Impact of stellar encounters at different times on a subhalo also undergoing tidal evolution. . . 242
F.4 Impact of stellar encounters with different orientations on a subhalo also undergoing tidal evolution. . . 243
F.5 Validation and tuning of a model describing the combined impact of tidal evolution and stellar encounters. . . 244
F.6 Demonstration that for subhalos orbiting the Draco dwarf, disruption due to stellar encounters tends to occur closer to orbital pericenter than apocenter. . . 245
F.7 Density profile of a Draco-like subhalo after 7 Gyr of tidal evolution. . . 247
LIST OF TABLES
4.1 Simulation list with basic parameters. . . 65
4.2 Halo and density-peak counts for each simulation. . . 67
4.3 Summary of predictive models with their simulation-tuned coefficients. . . 83
4.4 Comparison between predicted and simulated aggregate halo signals. . . 90
A.1 Simulation parameters for convergence-testing runs. . . 192
A.2 Summary of UCMH simulation parameters. . . 200
LIST OF ABBREVIATIONS AND SYMBOLS
a Scale factor
A Asymptotic coefficient of the inner density profile
ac Scale factor of collapse
aeq Scale factor at matter-radiation equality
aRH Scale factor at reheating
As Primordial spectral amplitude
BBN Big Bang nucleosynthesis
c Halo concentration
CDM Cold dark matter
CMB Cosmic microwave background
d Distance
D(a) Linear growth function
dSph Dwarf spheroidal galaxy
e Euler’s number
e Ellipticity
E Energy
EMDE Early matter-dominated era
erf Error function
F Force
G Newton’s gravitational constant
g∗ Effective number of relativistic degrees of freedom
GeV Gigaelectronvolt
H Hubble rate
H0 Hubble rate today
h Hubble parameter
IGRB Isotropic gamma-ray background
J Geometric factor in the dark matter annihilation rate
k Comoving wavenumber
kcut Wavenumber associated with the free-streaming cutoff
kdom Wavenumber entering the horizon at the onset of early matter domination
kRH Wavenumber entering the horizon at reheating
keV Kiloelectronvolt
kpc Kiloparsec
L Luminosity
m Mass
Mmax Mass enclosed within the radius of maximum circular velocity
Mvir Virial mass
mχ Mass of the dark matter particle
M∗ Mass of a star
MD Matter domination
MeV Megaelectronvolt
Mpc Megaparsec
LAT Large Area Telescope (of the Fermi satellite)
n Number density or number of orbits
N Number of simulation particles
ns Primordial spectral index
NFW Navarro-Frenk-White
p Prolateness
P Probability
P(k) Dimensionless power spectrum
Pζ(k) Dimensionless primordial curvature power spectrum
PBH Primordial black hole
pc Parsec
q Comoving radius or distance
QCD Quantum chromodynamics
r Radius
rc Circular orbit radius
rmax Radius of maximum circular velocity
rs Scale radius
RD Radiation domination
sr Steradian
t Time
T Temperature or orbital period
TRH Temperature at reheating
Tdom Temperature at the onset of early matter domination
UCMH Ultracompact minihalo
v Velocity
V Volume or velocity
vmax Maximum circular velocity
WDM Warm dark matter
WIMP Weakly interacting massive particle
z Redshift
Z0 Hidden-sector mediator particle
δ Fractional density contrast or Dirac delta function
δc Critical linear density contrast for collapse
δec Critical linear density contrast, in ellipsoidal collapse theory
δsc Critical linear density contrast, in spherical collapse theory
δv Critical linear density contrast for virialization
δt Critical linear density contrast for turnaround
Force-softening length or the power-law index of ∆with respect to enclosed mass
η Orbital circularity
θ Angle
ρ Mass density
¯
ρ Spatially averaged density
¯
ρ0 Cosmologically averaged dark matter density today
ρcrit Critical density today
ρs Scale density
σ Standard deviation
hσvi Velocity-averaged velocity-weighted dark matter annihilation cross section
χ Dark matter particle
Ω Solid angle
Ωm Matter density today in units of the critical density
CHAPTER 1: INTRODUCTION
1.1 Cosmic history
The Universe as we know it is believed to have begun with a period of accelerated expansion
called inflation [1–3]. During inflation, tiny quantum fluctuations in the energy density rapidly
expanded beyond the cosmological horizon, becoming frozen due to lack of causal contact. Through
this process, initially minor variations in the density of the Universe were seeded [4]. After inflation,
the Universe became dominated by relativistic particles—radiation—which gradually cooled as
the Universe continued to expand. After about 52 000 years [5], the radiation cooled enough that
its energy density fell below that of nonrelativistic particles, and the Universe entered a period
of matter domination. Subsequently, the density variations that inflation seeded grew through
gravitational attraction, as regions with excess density attracted surrounding matter to grow still
denser; this process eventually produced the vast network of galaxies that characterize the Universe
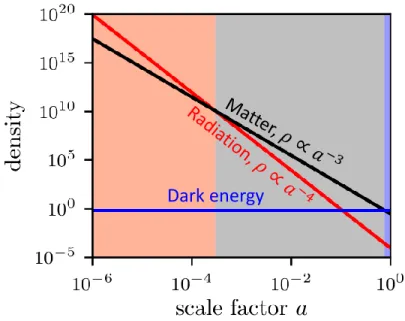
today. Figures 1.1 and 1.2 plot, respectively, the cosmic expansion history and the evolution of the
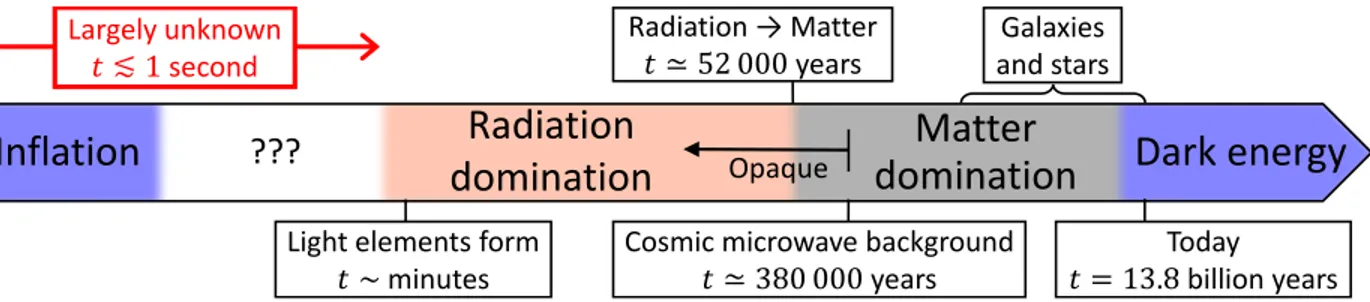
energy density of the Universe. Figure 1.3 shows a timeline of major cosmic events.
While this broad picture is consistent with observations, its details remain uncertain. The
Universe was opaque during the first 380 000 years [5], concealing this period from direct view.
Our earliest definitive constraints on cosmic evolution come from the decoupling of neutrinos from
the thermal plasma, a process that occurred at a time of about 1 second. The details of neutrino
decoupling influence Big Bang nucleosynthesis (BBN)—the process that created the first nuclei
heavier than hydrogen—and the evolution of cosmic density variations. Consequently, observationally
inferred light-element abundances [6–9] and density variations [10, 11] demand that the Universe
was radiation dominated as early as a time of about 0.1 seconds (corresponding to a temperature of
3 MeV).
The preceding inflationary epoch is invoked to solve the horizon and flatness problems [1–3] and
Toda
y
𝑎 = 1
Radiation
domination
Matter
domination
𝑎 ∝ 𝑒
𝐻𝑡Figure 1.1: The known cosmic expansion history. The scale factora—the size of the Universe relative to its size today—is plotted against time, starting at 1 second. When radiation dominates (red), the Universe grows with timet as a∝t1/2, while when matter dominates (gray),a∝t2/3. Dark energy is just beginning to dominate (blue) today; during both dark energy domination and inflation (not pictured), the scale factor grows exponentially in time.
Dark energy
Figure 1.2: Evolution of the energy densityρ of the Universe, relative to the density today, as a function of the scale factora(see Fig. 1.1). The density of (nonrelativistic) matter drops asρ∝a−3
Inflation
???
Matter
domination
Dark energy
Light elements form
𝑡 ∼minutes
Today
𝑡 = 13.8billion years Cosmic microwave background
𝑡 ≃ 380 000years
Radiation → Matter 𝑡 ≃ 52 000years
Opaque
Galaxies and stars
Largely unknown
𝑡 ≲ 1second
Radiation
domination
Figure 1.3: A schematic cosmic history. The Universe was opaque during the first 380 000 years, concealing this period from direct view, but indirect evidence, such as the observed abundances of the light elements deuterium, helium, and lithium, still constrains cosmic evolution during this time. However, the first second is largely unprobed (red arrows).
little observational guidance as to inflation’s physical details, and the primordial density variations
represent one of its few lasting imprints. Primordial fluctuations are observed to obey Gaussian
statistics [12], allowing them to be solely described by a power spectrum P(k) quantifying the power contained in these fluctuations as a function of scale wavenumber1 k. Fluctuations manifest themselves in the cosmic microwave background (CMB), light that last scattered the moment the
Universe became transparent, so CMB has been employed to precisely measure the primordial power
spectrum at scales above about 10 Mpc (e.g., Ref. [13]). Galaxy surveys largely confirm these
measurements (e.g., Ref. [14]). P(k)has also been measured down to Mpc-scale wavelengths using the Lyman-α forest (e.g., Ref. [15]), the absorption lines in light from distant sources that, due to cosmological redshifting, mark the locations of hydrogen clouds. All of these observations are
consistent with a weak power lawP(k)∝kns−1 withn
s= 0.9667±0.0040[16]; see Fig. 1.4. This nearly scale-invariant spectrum is consistent with the predictions of the simplest models of inflation.
However, the scales 10−4 Mpc−1 .k.3 Mpc−1 that current observations measure correspond to only a small fraction of inflation’s full dynamical trajectory. At smaller scales, which correspond
to the later stages of inflation, Fig. 1.4 shows that only upper bounds on P(k)are accessible. Many inflationary models yield primordial curvature spectra that depart from scale invariance at small
scales. Spectral features can arise through features in the potential of the inflaton field [27–37]—the
field driving inflation—or through multiple episodes of inflation [38–40]. Features can also arise
through interactions between the inflaton and other fields [41–48], such as energy transfer [49–52]
1k
10−4 10−2 100 102 104 106 108 1010 1012 1014 k(Mpc−1)
10−10 10−8 10−6 10−4 10−2 100
Pζ
(
k
)
CMBa Lyαb
CMB spectral distortionsc
CMBSD forecast
c
Hed
primordial black holesf
stochastic GWse GW forecast e GWforecast e 21cmg
21cm forecasth
lensed quasarsj ??? lensed starsk ??? pulsar timingi DM annihilationl
aPlanck Collaboration 2018 bBird, Peiris, Viel, Verde 2011 cChluba, Erickcek, Ben-Dayan 2012 dJeong et al. 2014
eByrnes, Cole, Patil 2019 fKalaja et al. 2019
gYoshiura, Takahashi, Takahashi 2019 hMuñoz, Dvorkin, Cyr-Racine 2019
iDror, Ramani, Trickle, Zurek 2019
jKarami, Afshordi, Zavala 2018
kDai & Miralda-Escudé 2019
lDelos et al. 2018
perturbative structure nonlinear structure (not minihalos) forecasted constraints from future experiment dark matter minihalos prospective minihalo-based constraints
and nontrivial inflaton field trajectories [53–68], and from particular inflationary models such as
axion-driven inflation [69, 70], running-mass inflation [71, 72], waterfall inflation [73–76], and others
[77–83]. Additionally, alternatives to the inflationary picture have been widely considered [84–112],
including cyclic-Universe models [113–135], and these theories leave their own imprints on the power
spectrum of primordial fluctuations.
After inflation, relativistic Standard Model particles eventually come to dominate the energy
density of the Universe. However, the energy scale associated with inflation could be as high as
1016 GeV [136, 137], and the absence of evidence from the Large Hadron Collider for physics beyond
the Standard Model of particle physics (e.g., Refs. [138–144]) suggests that inflation’s energy scale at
least lies well beyond the 13-TeV energy scale that this particle collider probes. These energies are far
higher than the highest temperature—3 MeV—at which radiation dominance has been observationally
confirmed [6–11], and the Universe’s evolution as it cooled through the vast temperature range
between inflation and MeV scales remains completely unprobed. There is little reason to assume the
Universe was radiation dominated during this full period (see Ref. [145] for a review of proposed
dynamics). Since the energy density of radiation decreases more rapidly than that of nonrelativistic
particles, any heavy field left over from the inflationary epoch would naturally come to dominate
the energy density of the Universe, leading to an early matter-dominated era (EMDE). The early
matter field is only observationally required to decay into radiation before the onset of neutrino
decoupling at a time of about 0.1 seconds. Figure 1.5 depicts the density evolution in this scenario.
Well motivated examples of such heavy fields include hidden-sector particles [146–158], moduli fields
in string theory [159–166], and certain spectator fields invoked to generate primordial curvature
variations during inflation [167–170]. After inflation ends, the inflaton itself can also behave as a
pressureless fluid before its decay [171–180].
Like many of the aforementioned inflationary models, early matter domination also leaves a
characteristic imprint on small-scale density variations. During an EMDE, the gravitational clustering
of the dominant heavy particles boosts the growth rate of density perturbations that are inside the
cosmological horizon, as shown in Fig. 1.6. Consequently, an EMDE can greatly amplify small-scale
density variations [181–183]. Aside from early matter domination, another possibility—domination
Radiation
domination
EMDE
MD
Figure 1.5: Density evolution that gives rise to an early matter-dominated era. An early matter species (green curve) dominates at early times (green shading), but it is unstable and decays into radiation (orange line). Radiation quickly comes to dominate (orange shading) and is eventually supplanted by stable matter (black; c.f. Fig. 1.2).
Radiation
domination
EMDE
MD
1.2 Dark matter minihalos as cosmological probes
In these ways, small-scale density variations could hold the answers to key questions about the
early Universe and represent a promising probe of physics beyond the Standard Model of particle
physics. In order to exploit this probe, we must extend our view of the primordial mass distribution
to subgalactic scales. Variations in the density of ordinary (“baryonic”) matter were washed out at
these scales by complex processes, such as the diffusion of photons while the Universe was opaque
and energetic feedback from stars during structure formation. However, it has been well established
that ordinary matter accounts for only a small fraction of the Universe’s matter content (e.g.,
Refs. [16, 192, 193]). The rest of the matter is “dark”: it does not interact with light, so it is exposed
to fewer physical processes. Fluctuations that were erased in the ordinary matter are expected to
persist in this dark matter. While dark matter is difficult to directly observe, dark matter density
variations still manifest in detectable ways. Regions with excess density collapse to form highly
dense, gravitationally bound clouds of dark matter, or halos (see Ref. [194] for a review). Galaxies
lie at the centers of the largest halos, but sufficiently extreme small-scale density excesses could
formminihalos2 long before galaxies appear. Since they form during a much denser epoch, these
minihalos could be extraordinarily dense.
Despite dark matter’s invisibility, the high density within minihalos leads to observational
prospects. Dark matter is widely expected to have some interaction with ordinary (Standard Model)
particles in order for it to be produced in the first place (see Refs. [195–199] for reviews of dark
matter models). One of the best motivated explanations for dark matter’s observed abundance is
that it originated in matter-antimatter pairs within the early-Universe radiation bath. This pair
production would have originally been in equilibrium with dark matter annihilation—the reverse
process—but as the Universe expanded and cooled, both processes would have come to a halt and left
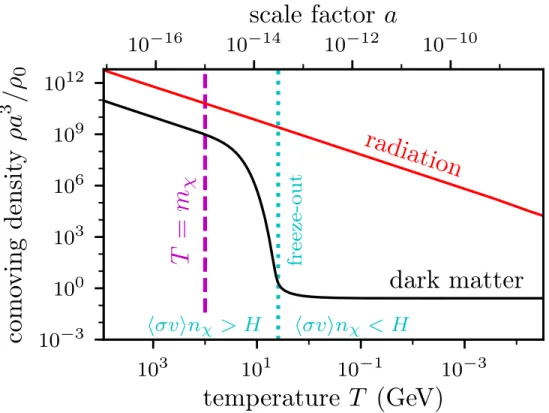
a relic abundance of dark matter. Figure 1.7 describes thisfreeze-out process in detail, but the key
consequence is that under this scenario, the dark matter would annihilate into detectable radiation
today at a rate that is drastically boosted by the high density inside minihalos. Independently of
the dark matter model, dense halos can also be detected through their gravitational signatures. For
example, while minihalos are too small to be detectable as gravitational lenses on their own, they can
produce detectable distortions within systems—distant quasars [23] or stars [24]—that are already
strongly lensed. Minihalos can also be detected by their transient gravitational influence on the
observed periods of pulsars [25], whether by passing near either the pulsar or the Earth (producing
a Doppler shift) or by crossing the line of sight to the pulsar (producing a Shapiro time delay).
Minihalos may also be detectable by their dynamical influence on cold astrophysical systems, such
as stellar streams [200, 201].
Through detection efforts, minihalos can therefore serve as messengers from the early Universe.
However, to employ them thus, we must establish the connection between minihalos’ observable
characteristics and properties of the small-scale density variations that preceded them, which
are set by the early-Universe cosmology. This doctoral dissertation represents a study of this
minihalo-cosmology connection and is organized as follows.
1.2.1 Ultracompact minihalos and probing inflation
Many previous works have used minihalos to place observational constraints on primordial
curvature variations, but my research described in Chapter 2 challenges prior results. It has been
commonly assumed, beginning with Ref. [202], that halos that form by the redshift3 z= 1000—when the Universe was 430 000 years old and 1/1000 its present size—develop the unusually steep density profile predicted by the analytic theory of Ref. [203]. This profile’s densityρ scales with radius r
asρ∝r−9/4, and its compactness greatly boosts observational signals and has led to considerable interest in these objects. Observational limits on the abundance of these so-called ultracompact
minihalos yielded the most stringent bounds on small-scale primordial density variations, which
in turn led to powerful and unrivaled constraints on inflationary models [204]. However, using
numerical simulations, Chapter 2 demonstrates exhaustively that theρ∝r−9/4 profile does not arise from a realistic formation scenario. Instead, the first halos universally develop shallowerρ ∝r−3/2
density profiles at small radii. This profile is still steeper than theρ∝r−1 profile that arises within later-forming halos, such as those that surround galaxies [205].
This discovery significantly reduces the expected detectability of each minihalo, potentially
3z
10
−310
−110
110
3temperature
T
(GeV)
10
−310
010
310
610
910
12como
ving
densit
y
ρa
3
/ρ
0
radiation
dark matter
T
=
m
χfreeze-out
h
σv
i
n
χ> H
h
σv
i
n
χ< H
10
−1610
−1410
−1210
−10scale factor
a
Figure 1.7: A depiction of dark matter freeze-out for a dark matter particle with massmχ= 100GeV. I plot the comoving energy density—that is,ρa3, the density per expanding volume of space—of radiation (red) and dark matter (black) as a function of “time”. Here, time is parametrized by the decreasing temperature of the radiation bath (bottom axis) or the increasing scale factor (top axis;
impairing the capacity of these objects to constrain primordial density variations. On the other hand,
it becomes no longer necessary to restrict an analysis to halos forming within the first 430 000 years,
so the pool of halos that can contribute to constraints grows dramatically. By using
simulation-tuned scaling arguments to relate minihalos to their precursor density excesses, Chapter 2 derives
new bounds on primordial density variations that account for all minihalos. I find that, rather
than being relaxed, constraints on density variations are tightened. The inclusion of all minihalos
compensates for the reduction in signal from each one. This unexpected finding represents a new set
of observational constraints that theories of inflation must satisfy.
1.2.2 Halo formation prior to matter domination, and probing hidden sectors
Sufficiently extreme density variations could collapse to form dark matter halos during the first
52 000 years, during which time the Universe was dominated by radiation instead of matter (see
Figure 1.3). For instance, in hidden-sector dark matter theories—where a heavy mediator particle
links dark matter to the Standard Model—the heavy mediator could drive an EMDE that amplifies
density variations in the dark matter dramatically [181–183]. Using numerical simulations that
account for the early presence of this short-lived heavy species, Chapter 3 studies halo formation
during the radiation-dominated epoch. Since radiation does not cluster like matter, radiation
dominance allows particles to drift freely without any net gravitational acceleration. Gravitationally
bound structures cannot form where radiation dominates. Nevertheless, Chapter 3 demonstrates that
localized regions can become matter dominated where freely drifting streams of dark matter converge.
Bound halos form within these regions long before radiation globally gives way to matter. Their early
formation would make these halos so dense—and hence so readily detectable—that observational
limits on their abundance severely constrain the hidden-sector theories that my collaborators and I
considered in Ref. [206].
1.2.3 Predicting the structures of dark matter halos
The observational constraints derived in Chapter 2 are based on simplifying approximations
regarding the relationship between a primordial mass distribution and the demographics of the halo
population that it forms. Motivated by the goal of precisely predicting minihalos’ observational
signals, Chapters 4–6 refine our understanding of this relationship. The small size and high internal
density of the smallest halos make it infeasible to simulate their full populations and lifetimes on
potentially 20 orders of magnitude in mass—is far too great to represent within a simulation’s
resolution.4 Consequently, these chapters are devoted to the development of simulation-tuned
mathematical models. In order to connect minihalo properties today to primordial density variations,
these models characterize both the formation of minihalos and their subsequent evolution through
cosmic time.
Formation of the first halos Chapter 4 builds a framework that relates the internal structures of the first halos to properties of the initial density variations that formed them. Compared to
other predictive models of halo populations, this framework is formulated more directly in terms
of physical principles (as opposed to simply fitting simulation results). Consequently, it is unique
in that its predictions are accurate across wildly disparate cosmological scenarios, so it spares the
need to simulate every possible cosmology. By exploiting the statistical properties of the primordial
mass distribution, this framework can rapidly characterize entire ensembles of minihalos, making it
a powerful tool for predicting their observational signals.
Evolution due to tidal forces After formation, the first generation of halos merge to create successively larger structures, and Chapter 5 develops a model that predicts the evolution of small
subhalos inside much larger host halos. It is impractical to simulate a galactic-scale host halo
together with a minihalo due to the vast difference in scales, so this chapter employs idealized
simulations ofN-body minihalos orbiting analytic hosts. Based on the results of these simulations, I develop a novel way to parametrize how a subhalo evolves due to a host halo’s tidal forces; this
parametrization reduces the entire complicated host-subhalo system to only three relevant physical
parameters. Using this parametrization, Chapter 5 presents a model that predicts a subhalo’s
evolution with unparalleled accuracy.
Evolution due to stellar encounters Minihalos inside galactic systems are also affected by encounters with individual stars. Chapter 6 uses numerical simulations to study how a halo responds
to such an encounter and finds that, under most circumstances, only a single physical parameter—the
energy that the encounter injects into halo particles—is relevant to the outcome. Using these
simulation results, I develop a model that can predict the structural evolution of a halo passing
4Except when objects of different scales are spatially segregated. That is, the smallest halos can be resolved only
through a stellar field with remarkable precision. Models of this sort are particularly valuable in
treating the impact of stellar encounters because of their random nature. A simulation of this
scenario would need to be repeated with different random stellar samples, at enormous computational
expense. In contrast, the model described in Chapter 6 can characterize with minimal cost how
stellar encounters affect whole ensembles of minihalos.
1.2.4 Breaking a degeneracy between dark matter and the early Universe
Finally, Chapter 7 applies these models to a problem that involves both the early Universe and the
nature of dark matter. If dark matter originated in matter-antimatter pairs, then its microphysical
properties are constrained by the requirement that it achieve its observed abundance. Under
the standard assumption that radiation dominated the Universe when dark matter’s production
concluded, dark matter’s (velocity-scaled, velocity-averaged) annihilation cross sectionhσvi must be close to the particular value 3×10⁻²⁶ cm3/s [208]. This cross section presents an attainable target for indirect-detection experiments that search for annihilation products, such as gamma rays,
sourced by nearby dark matter-rich dwarf galaxies [209–212]. However, a wide variety of dark matter
candidates would have been produced entirely during the first second, when there is no reason to
assume radiation was dominant. The possibility of an EMDE during this epoch vastly broadens
the range of viable dark matter candidates; almost any annihilation cross section smaller than
3×10⁻²⁶ cm3/s is allowed [213–223]. Consequently, there is a degeneracy between dark matter properties and the history of the early Universe; the former cannot be determined without knowledge
of the latter.
Fortunately, since early matter domination also amplifies small-scale density variations [181–183],
it leads to a population of highly dense dark matter minihalos, and the density within these objects
boosts the dark matter annihilation rate dramatically [206, 224, 225]. Chapter 7 uses the models
developed in Chapters 4–6 (with some new refinements) to characterize the gamma-ray signals
expected from the minihalo populations arising from this scenario. These minihalos are far too small
to resolve as individual gamma-ray sources and would instead register as a diffuse signal, and I
consider two complementary examples thereof:
(1) a background gamma-ray signal sourced by minihalos both within the Milky Way’s dark halo
and in the vast expanse outside our Galaxy;
Draco dwarf for its optimal combination of proximity and high mass.
Chapter 7 compares the predicted gamma-ray signals with observational data from the Fermi
Gamma-ray Space Telescope.
The signal from Draco (or any galactic system) is valuable because it can discriminate between
different cosmological scenarios. Minihalos inside Draco suffer gradual disruption due to tidal forces
and stellar encounters, and these effects suppress the annihilation signal near the system’s center.
The magnitude of this suppressive effect is sensitive to the detailed demographics of the minihalos,
so measurements of the shape of a gamma-ray flux from Draco could be employed to probe these
demographics. Through my models, this procedure would in turn probe primordial density variations
and hence the Universe’s first second. It would also distinguish minihalo-dominated dark matter
annihilation from the decay of dark matter particles; the two unrelated processes produce almost
identical signals that are differentiated only by minihalos’ aforementioned central suppression.
However, absent a positive detection of dark matter-sourced gamma rays, the background signal
offers significantly more constraining power than the signal from Draco due to the sheer volume
sourcing the background. The precise strength of the dark matter constraints that Chapter 7 derives
using the background signal depend on further details of dark matter’s interactions with ordinary
matter. Nevertheless, for plausible sets of parameters, its analysis rules out a broad range of dark
matter candidates that early matter domination could otherwise make viable. Chapter 7 represents
an important step toward constraints on dark matter that account for our ignorance of the Universe’s
CHAPTER 2:
DENSITY PROFILES OF ULTRACOMPACT MINIHALOS: IMPLICATIONS
FOR CONSTRAINING THE PRIMORDIAL POWER SPECTRUM1
2.1 Introduction
Ultracompact dark matter minihalos have emerged as a powerful probe of early-Universe physics.
Overdense regions withδ ≡δρ/ρ&10−3at horizon entry seed the formation of dark matter minihalos near the time of recombination (z '1000) [202], and such early formation yields highly compact structures potentially visible through dark matter annihilation [227–243] or by their gravitational
signatures [202, 244–246]. The nondetection of these structures thus constrains the amplitude of
primordial density fluctuations, making it a probe of the primordial power spectrum [232–236, 246–
249] and hence of inflationary models [204] and the thermal history of the Universe [250].
These ultracompact minihalos (UCMHs) provide access to perturbations on scales too small to be
directly observed. Cosmic microwave background (CMB) observations indicate that the primordial
power spectrum of curvature fluctuationsPζ(k) is consistent with a slightly red-tilted but otherwise featureless power law [251] with amplitudeAs= (2.142±0.049)×10−9 [16], and the Lyman-α forest tells a similar story [15]. However, these observations are only able to probe wavelengths longer than
2 Mpc, and numerous inflationary models predict an enhancement in small-scale power [27–31, 38–
40, 49, 51–53, 56, 69–81]. Certain nonstandard thermal histories, such as an early matter-dominated
era [181–183, 224] or an era dominated by a fast-rolling scalar field [191], also enhance small-scale
fluctuations. Thus, probing the small-scale power spectrum is key to understanding early-Universe
physics.
Unfortunately, at sub-Mpc scales, we only have upper bounds on density fluctuations, which are
1The content of this chapter was previously published in Physical Review D as Refs. [26, 226] and is copyright c
2018 American Physical Society. The original references are as follows: M. S. Delos, A. L. Erickcek, A. P. Bailey, and
M. A. Alvarez, Are ultracompact minihalos really ultracompact?, Physical Review D97, 041303(R) (2018); M. S.
obtained through the absence of secondary effects. Density contrasts of order0.3 at horizon entry would form primordial black holes, so constraints on their abundance constrain Pζ(k).3×10−2
over a wide range of scales [252]. An excess of integrated power would imprint distortions onto the
CMB blackbody spectrum, so their nonobservation constrainsPζ(k).2×10−5 for k.104 Mpc−1
[19]. However, UCMHs supply the strongest constraints. The nondetection of gamma rays from dark
matter annihilation in UCMHs constrains Pζ(k).3×10−7 for k.107 Mpc−1 [234].
2.1.1 The ρ∝r−9/4 density profile
With one recent exception [232], all constraints derived from UCMHs have been calculated
assuming they develop theρ∝r−9/4 density profile, which is drawn from analytic radial infall theory [203, 253] and taken to apply to halos forming atz&1000due to the small velocity dispersion at those times [202]. This profile has a much steeper inner form than is typically observed in simulations
(e.g., [194]), a property that enhances the observational signatures of UCMHs, but it is derived in an
idealized picture satisfying spherical symmetry, radial motion, and (after halo collapse) self-similarity,
or the absence of a scale length. It has been reproduced in N-body simulations from carefully constructed self-similar initial conditions [254, 255] but not from more realistic conditions [256–258].
In contrast, dark matter halos at galaxy scales form by hierarchical clustering, and simulations of
this scenario yield halo density profiles of the Navarro-Frenk-White (NFW) form [205, 259, 260],
ρ(r) = ρs
(r/rs)(1 +r/rs)2
, (2.1)
with a ρ∝r−1 inner profile. A slightly steeper profile arises in simulations with a free-streaming cutoff scale below which there are no fluctuations: halos at that scale form by steady accretion and
develop ρ∝r−3/2 inner profiles [261–266]. Neither of these pictures comes close to reproducing the UCMH density profile. However, previous numerical experiments did not explore the collapse
of an extreme density fluctuation at z'1000, and prior UCMH analyses have assumed that the combination of small velocity dispersion and isolation associated with a halo forming at such early
times will suffice to yield theρ∝r−9/4 profile.
Recent simulation work in Ref. [267] explicitly explored the UCMH formation scenario and called
resulting halos have NFW profiles. However, Ref. [267] failed to rule out UCMHs with theρ∝r−9/4 profile because it did not select for extreme density peaks, instead simulating a typical box whose
largest peak corresponded to a 4.3σ fluctuation (smoothed at the scale of the spike). Moreover, Ref. [267] claimed that the absence of ρ∝r−9/4 profiles owes to the lack of spherical symmetry and isolation in realistic conditions. Since Refs. [254, 255] observed (and we confirm) that spherical
symmetry is unnecessary for theρ∝r−9/4 profile, this claim suggests that halos forming from peaks rarer than4.3σ could be sufficiently isolated to develop it. Reference [234] used peaks as extreme as
6σ to derive observational constraints, above the 5σ level that Ref. [267] claimed based on idealized
simulations to not produce theρ∝r−9/4 profile.
Our approach differs in that we search millions of density fields to find a sufficiently extreme
peak. We simulate6.8σ peaks collapsing atz'1000in a more weakly boosted power spectrum than that of Ref. [267]. This level of statistical extremity corresponds to a UCMH mass fractionf '10−9
in the analysis of Ref. [234], which is well below constrained levels2, implying that our density peak
is rarer than any level hitherto assumed to suffice for development of the ρ∝r−9/4 profile. We also consider an alternative power spectrum amplification—a step instead of a spike—and show that
the density profile depends on the shape of the power spectrum. In particular, the spiked power
spectrum produces isolated halos with ρ ∝r−3/2 inner density profiles, while the step-enhanced spectrum produces halos by hierarchical assembly that develop NFW profiles. Lastly, we use idealized
simulations to argue that self-similarity is necessary to produce the ρ∝r−9/4 profile, which would definitively rule out its appearance in a Gaussian random field.
2.1.2 Modeling halo populations to probe the primordial power spectrum
We also introduce a new model for predicting, based on their formation times, the density profiles
of minihalos that form from spiked power spectra. Spectral spikes can arise from steps in the inflaton
potential [27–30] or from particle production during inflation [49, 51, 52]. Near the free-streaming
cutoff, the power spectrum imprinted by an early matter-dominated era is also similar to a spike
[181–183, 224]. Moreover, spiked power spectra are less well constrained than flatter power spectra
by CMB spectral distortions, which limit the power integrated over a broad range in k-space [19].
2While our power spectrum spike peaks above the generalized constraint in Ref. [234], it is not ruled out because it is
In this chapter, we begin an investigation of halos forming from spiked power spectra that we will
expand upon in Chapter 4.
Finally, we discuss the impact of our result on the capacity for minihalos to constrain the
primordial power spectrum. We use our model to calculate an upper bound on the amplitude of
spiked power spectra that incorporates the new shallower minihalo density profiles. This upper
bound is based on limits from Fermi-LAT [268] on gamma rays from dark matter annihilation.
Despite the reduced annihilation rate implied by the shallower profile, this constraint is stronger than
an equivalent UCMH constraint derived using the ρ∝r−9/4 density profile. Our model provides a stronger constraint because it accounts for all halos, whereas the old UCMH model only counted
halos forming at z&1000. Our calculation demonstrates the continued viability of minihalos as probes of the small-scale power spectrum, and we discuss future avenues for improvement.
2.2 Simulation preparation
We carry out simulations of halos forming at z'1000 from extreme peaks in the density field. This picture is intended to match the UCMH formation scenario [202], and we aim to show
conclusively that the ρ∝r−9/4 single-power-law density profile does not arise in halos forming due to an enhancement of the primordial power spectrum.
2.2.1 Power spectrum
In order to perform numerical experiments on such early-forming minihalos, we must start with
an enhanced power spectrum. Inflationary models supply a rich phenomenology in this respect. Steps,
kinks, or second-derivative jumps in the inflaton potential would imprint spikes, steps, or bends,
respectively, on the primordial power spectrum [27–31]. Particle production during inflation can
produce a spike in the power spectrum [49, 51, 52], while multifield inflation can imprint steps [38–40]
or oscillations [53, 56]. Inflation aside, an early matter-dominated era enhances perturbations that
enter the horizon prior to the onset of radiation domination [181–183, 224], and an era dominated
by a fast-rolling scalar field generates a similar enhancement [191].
For our simulations, we consider two examples from these possible power spectrum enhancements.
First, we consider a narrow spike in the power spectrum. This shape has possible inflationary
origins, as discussed above, and is also qualitatively similar to the enhancement generated by an
early matter-dominated era at scales close to the free-streaming cutoff. Next, we consider a step in
10−3 10−2 10−1 100 101 102 103 k (kpc−1)
10−9 10−8 10−7 10−6
Pζ
(
k
)
Figure 2.1: The dimensionless primordial power spectrum of curvature fluctuations used in our UCMH simulations. The solid line shows the spike modification, while the dotted line shows the step. The vertical dashed line indicates the smallest k(largest scale) accessible in the simulations.
over a broad range of scales. The two power spectra are plotted in Fig. 2.1. We superpose these
modifications on a conventional power spectrum with amplitude As= 2.142×10⁻⁹ and spectral index ns= 0.9667 [16]. The spike contains 90% of its added power inside 1 e-fold ink, while the step amplifies fluctuations over the full range of scales accessible to the simulation. We will focus on
the spiked power spectrum for most of Sec. 2.3 and return to the step in Sec. 2.3.5.
Halos forming from more extreme density contrasts are both more spherically symmetric [269]
and less affected by nearby structure. To best simulate the UCMH formation scenario, we tune our
power spectra so that halos forming byz= 1000are exceedingly rare. In particular, the spiked power spectrum is tuned so that a6.8σ fluctuation is necessary to seed such early collapse, and we generate a large number of random fields in order to obtain a handful of boxes to use as initial conditions for
our simulations. This procedure may be contrasted with that of Ref. [267], who simulated a typical
box whose most extreme peak was4.3σ. UCMHs forming from peaks as extreme as 6σ are employed to derive observational constraints [234], so we wish to exceed this amplitude to conclusively rule
out theρ∝r−9/4 profile.
2.2.2 Simulation setup
A matter power spectrum is calculated atz= 1000from the primordial power spectrum using the Boltzmann code Camb Sources [270, 271]. To match simulation behavior, this power spectrum is
evolved back to an earlier time using the Mészáros equation [272]
d2δ
dy2 +
2 + 3y 2y(y+ 1)
dδ dy −
3
which describes the subhorizon (Newtonian) evolution of dark matter density perturbations when
baryons and radiation fluctuations are neglected. Herey≡a/aeq, where aeq is the scale factor at matter-radiation equality. The physical solution to this equation is obtained by matching its general
solution to the asymptotic behavior δ∝ln(0.44a/aH) during radiation domination, whereaH is the scale factor when the perturbation mode enters the horizon. This physical solution is [273]
δ∝
ln
k 0.12h Mpc−1
−ln
√
1 +y+ 1 √
1 +y−1 y+ 2 3
+ 2p1 +y, (2.3)
which provides a convenient prescription for calculating the evolution of a density contrast δat linear order during mixed matter-radiation domination.
We choose to study fluctuations of order 0.2 kpc, so the spectral spike of Fig. 2.1 is centered
at wavenumber ks= 6.8 kpc−1. The starting redshift is chosen to be z= 8×10⁶ so that a density contrast that collapses atz'1000 is initially of order 0.1. We do not expect our results to depend significantly on either of these choices. We fix a comoving box size of 7.4 kpc and search periodic
Gaussian random fields generated at the initial redshift for candidate peaks to collapse nearz= 1000. Our search proceeds by first generating a Gaussian random field on a grid at the initial redshift using
our spiked power spectrum. We then linearly evolve that field toz= 1000and check whether the evolved density field has a peak3 withδ >1.686, the linear threshold for collapse. If so, we use that grid, and if not, we generate a new one. Once we have a suitable density field, we use the Zel’dovich
approximation to perturb a particle grid into a corresponding initial particle distribution. Since
our simulations begin while the Universe is radiation-dominated, initial velocities are computed by
differentiating Eq. (2.3); see Appendix A.1 for details.
For the spiked power spectrum shown in Fig. 2.1, we generate 2.3 million random density fields.
Nine of them meet the collapse criterion, so we use these as the initial density fields and simulate
them toz= 50. We also pick out one such density field, which we label the primary, to simulate at higher resolution and perform convergence tests; a slice of its initial density field is shown in Fig. 2.2.
Notice how extreme the most overdense region is compared to its surroundings: this is indeed a rare
3For simplicity, we requireδ >1.686in one grid-cell in our5123-cell density field, which corresponds to a smoothing
Figure 2.2: A slice of the 7.4 kpc density field used as initial conditions for the primary simulation run. Lighter regions are denser. The circle indicates the spherical region for a high-particle-density simulation.
event.
We also resimulate each of these density fields with increased simulation-particle density by
resampling the initial field at higher resolution and including only a sphere of radius 0.93 kpc (with
vacuum boundary conditions) around the most overdense point. This cut-out region is drawn in
Fig. 2.2. This procedure allows us to probe smaller scales, and in Appendix A.2, we demonstrate
that it does not change the density profile of the UCMH in the primary density field atz= 100. This convergence does not hold for the UCMHs in all nine fields: some of them begin to be influenced
by structure outside the sphere as early as z∼200. Consequently, we only carry out these cut-out simulations up toz= 400for the other eight density fields.
2.2.3 N-body code
We use the cosmological simulation code Gadget-2 [274, 275] for our numerical experiments.
Gadget-2 is a hybrid N-body code that computes short-range forces using a tree method and
long-range forces using Fourier techniques on a mesh. A discussion on our choices of simulation
parameters can be found in Appendix A.2, along with convergence studies. We also model all matter
In order to accurately simulate a halo collapse at z'1000, our experiments must begin during radiation domination, so our N-body code must account for radiation. However, fluctuations in the
radiation density field decay rapidly after horizon entry (see e.g. [276]), so it is only necessary to
model the effect of a smooth radiation component on the expansion rate. We modified the publicly
available release of Gadget-2 to include such a radiation component. Tests of the accuracy of this
code can be found in Appendix A.1.
2.3 Simulation results
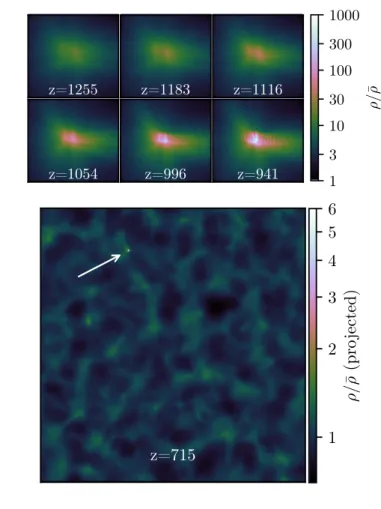
A visual inspection of the primary simulation box yields some key insights. First, we note that
our criterion for early collapse, that the linear density contrast beδ >1.686byz= 1000, has worked as expected. Figure 2.3 shows a slice of the density field evolving fromz= 1255 toz= 941at the location of the extreme density peak where we expect the UCMH to form, and we see that the
density at the central point grows astronomically aroundz = 1000, an indication of collapse. To emphasize the rarity of this event, we also show the density field at z= 715: the UCMH is still the only halo to have collapsed by this redshift.
Next, we look at the density field at a much later redshift. Figure 2.4 shows the density field at
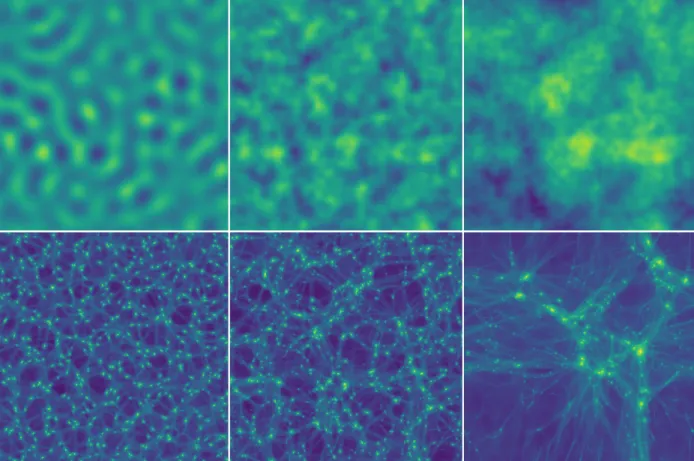
z= 100 projected along one axis. The imprint of the spike in the power spectrum is evident, for
we see an almost uniform distribution of halos with no large-scale structure. This is quite unlike
a hierarchical growth picture (cf. Fig. 2.10). There is also minimal small-scale structure: these
halos appear generally isolated and are only linked by filaments. These points are emphasized in
the enhanced pictures of the main halo, where we see more clearly the lack of small-scale structure.
We also see the beginning of fragmentation of the filaments into halos, but this fragmentation is a
numerical artifact; see Appendix A.2.
According to the Rockstar halo finder [277], there are 530 halos with masses above1.5M
at z= 100, and these halos contain 24% of the total mass of the simulation box within their virial radii. Such an abundance of halos is clearly expected in any picture that can produce a halo that
collapses byz'1000, but later halos have been neglected in prior UCMH treatments because they are expected to be less compact. We will explore in Sec. 2.3.4 whether younger halos have the same
z=1255 z=1183 z=1116
z=1054 z=996 z=941 13
10 30 100 300 1000
ρ/
¯
ρ
z=715 1
2 3 4 5 6
ρ/
¯
ρ
(pro
je
cted)
Figure 2.3: The density field for the primary run at different redshifts. Top: A(0.24 kpc)2×0.06 kpc
slice showing the collapse of the UCMH nearz= 1000. The color scale is logarithmic in units of the background matter density. Bottom: The full(7.4 kpc)3 projected density field at z= 715. There is still only one halo, a testament to its rarity.
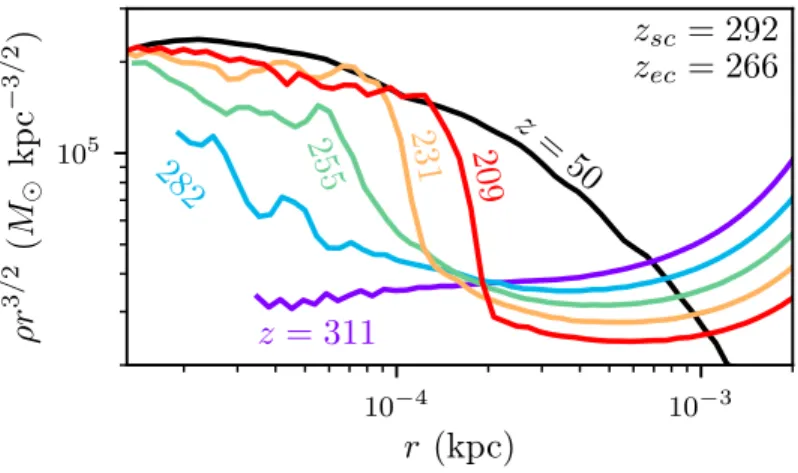
2.3.1 Density profiles
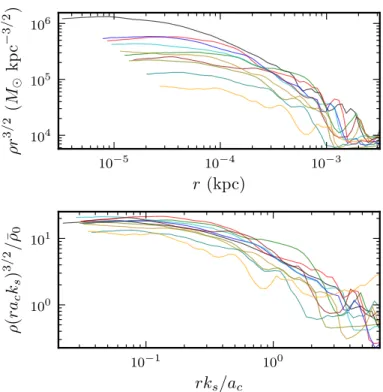
We now study the spherically averaged density profiles of the UCMHs. We simulated the UCMH
in the primary simulation box at the highest particle density (see Appendix A.2 for details), so we
first focus our study on that halo. This halo has massM = 31M atz= 100, and Fig. 2.5 shows its density profile at z = 50, z = 100, z = 200, and z = 400 plotted in physical (not comoving) coordinates. We first note that this halo clearly does not follow aρ∝r−9/4or similar single-power-law form, contradicting the assumption made in prior UCMH treatments. We have conducted extensive
convergence testing to confirm the validity of this result, as described in Appendix A.2. The actual
density profile is shallower, which will substantially reduce the observational signals of these halos,
UCMH