MATERNAL EXPOSURE TO CRITERIA AIR POLLUTANTS DURING EARLY PREGNANCY AND CONGENITAL HEART DEFECTS IN OFFPSRING
Jeanette Anne Stingone
A dissertation submitted to the faculty of the University of North Carolina at Chapel Hill in partial fulfillment of the requirements for the degree of Doctor of Philosophy in the Department of
Epidemiology.
Chapel Hill 2013
ii © 2013
iii ABSTRACT
JEANETTE ANNE STINGONE: Maternal exposure to criteria air pollutants during pregnancy and congenital heart defects in offspring
(Under the direction of Andrew F. Olshan, PhD)
Toxicological and epidemiological literature suggests that maternal exposure to air pollutants during pregnancy has the potential to disrupt fetal development, resulting in adverse pregnancy outcomes in offspring. The goal of this dissertation was to explore the relationship between maternal exposure to carbon dioxide, nitrogen dioxide, ozone, coarse and fine particulate matter and sulfur dioxide during the window of fetal cardiac development, weeks 2 through 8 of pregnancy, and congenital heart defects (CHDs) in offspring within the context of the National Birth Defects Prevention Study (NBDPS), a large population-based case-control study. Specific Aim 1 sought to explore the relationships between pollutants and individual CHDs in a novel way, by assessing individual weeks of exposure in addition to a seven-week summary measure and utilizing hierarchical regression models to address the issue of multiple inference. These relationships were also explored in a multipollutant context by using principal components analysis to construct source-factor models. Positive associations were observed for several pollutants and CHDs in both single-pollutant and source-factor analyses. Assessing individual weeks of fine particulate matter exposure
iv
v
ACKNOWLEDGEMENTS
vi
TABLE OF CONTENTS
LIST OF TABLES ... xi
LIST OF FIGURES ...xiii
LIST OF ABBREVIATIONS ... xiv
1. INTRODUCTION AND SPECIFIC AIMS ... 1
2. BACKGROUND ... 4
2.1 Ambient Air Pollution ... 4
2.1.1 Criteria Air Pollutants ... 6
2.1.1.1 Carbon Monoxide (CO) ... 6
2.1.1.2 Nitrogen Dioxides (NO2) ... 7
2.1.1.3 Ozone (O3) ... 8
2.1.1.4 Particulate Matter (PM) ... 9
2.1.1.5 Sulfur Dioxide (SO2) ... 11
2.1.1.6 Toxicity Specific to the Pre-and Perinatal Time Period ... 12
2.1.2 Methods of Exposure Assessment ... 13
2.1.2.1 Proximity-based ... 14
2.1.2.2 Emissions Inventories ... 14
2.1.2.3 Measurements at Centralized Ambient Air Monitors ... 16
2.1.2.4 Geostatistical Models using Monitoring Data ... 18
2.1.2.5 Land Use Regression Models ... 18
2.1.2.6 Deterministic Prediction Models ... 19
vii
2.2 Congenital heart defects ... 21
2.2.1 Definition and Diagnosis ... 21
2.2.2 Prevalence, Morbidity and Mortality ... 21
2.2.3 Cardiac Development and Relevant Time Periods of Exposure ... 24
2.2.4 Classification and Description of CHDs ... 25
2.2.4.1 Ventricular Septal Defects ... 26
2.2.4.2 Atrial Septal Defects ... 27
2.2.4.3 Atrioventricular Septal Defects ... 28
2.2.4.4 Conotruncal Defects ... 28
2.2.4.5 Right Ventricle Outflow Tract Obstructions (RVOTO) ... 29
2.2.4.6 Left Ventricle Outflow Tract Obstructions (LVOTO) ... 29
2.2.4.7 Ebstein’s ... 30
2.2.4.8 Patent Ductus Arteriousus... 31
2.2.4.9 Cardiac Looping ... 31
2.2.4.10 Heterotaxy ... 32
2.2.4.11 Abnormal Cell-growth Defects ... 32
2.2.4.12 Cardiomyopathy ... 32
2.2.5 Risk Factors ... 33
2.2.6 Potential Biological Pathways for Air Pollutants to Contribute to CHDs ... 35
2.3 Previous Epidemiological Research on Ambient Air Pollutants and CHDs ... 36
2.3.1 Summary of Study Characteristics and Findings ... 36
2.3.2 Methodological Limitations of Previous Studies ... 43
3. METHODOLOGY ... 46
3.1 Study Overview ... 46
viii
3.2.1 Study Population, the National Birth Defects Prevention Study ... 46
3.2.1.2 Residential History and Geocoding within the NBDPS ... 48
3.2.1.3 CHDs within the NBDPS: Exclusion Criteria and Classification ... 49
3.2.2 Sources of Air Pollution Data from the Environmental Protection Agency ... 51
3.2.2.1 Ambient Air Monitoring Data ... 51
3.2.2.2 Downscaler Community Multiscale Air Quality Model ... 52
3.2.3 Supplemental Sources for Covariate Information ... 54
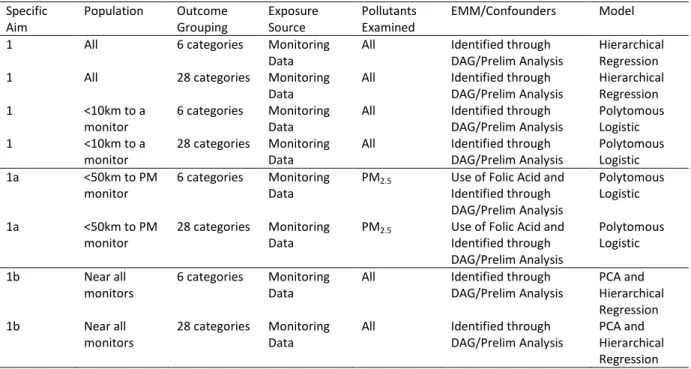
3.3 Methodology for Specific Aim 1 ... 54
3.3.1 Study Population ... 55
3.3.2 Outcome Assessment ... 56
3.3.3 Exposure Assessment ... 56
3.3.3.1 Constructing source-factors for Specific Aim 1b ... 57
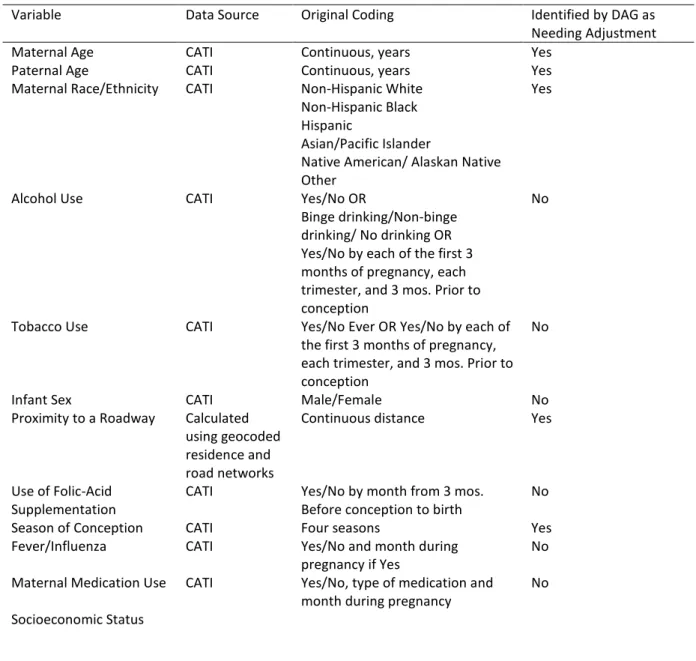
3.3.4 Covariate Selection ... 58
3.3.5 Data Exploration and Coding ... 61
3.3.6 Modeling Strategy ... 63
3.3.6.1 Polytomous Logistic Regression ... 63
3.3.6.2 Hierarchical Model ... 65
3.3.7 Minimum Effect Size Analysis ... 66
3.4 Methodology for Specific Aim 2 ... 67
3.4.1 Study Population ... 68
3.4.2 Outcome Assessment ... 68
3.4.3 Exposure Assessment ... 68
3.4.4 Covariate Assessment ... 69
3.4.5 Data Exploration and Coding ... 69
ix
4. MATERNAL EXPOSURE TO CRITERIA AIR POLLUTANTS DURING EARLY PREGNANCY AND CONGENITAL HEART DEFECTS IN OFFSPRING: RESULTS FROM THE NATIONAL
BIRTH DEFECTS PREVENTION STUDY... 70
4.1 Introduction ... 70
4.2 Methodology ... 71
4.2.1 Study Population ... 71
4.2.2 Exposure Assignment and Covariates ... 72
4.2.3 Statistical Analysis ... 74
4.3 Results ... 76
4.3.1 Exposure assigned as a single 7-week average of daily maximums or 24-hour measurements ... 76
4.3.2 Exposure assigned as one-week average of daily maximums or 24-hour measurements ... 77
4.3.3 Principal Component Analysis ... 78
4.4 Discussion ... 88
5. COMPARING THE IMPACT OF MONITOR-BASED VERSUS MODEL-BASED ESTIMATES OF POLLUTANT EXPOSURE ON THE RELATIONSHIP BETWEEN MATERNAL EXPOSURE TO PM2.5 AND OZONE URING PREGNANCY AND CONGENITAL HEART DEFECTS IN OFFSPRING ... 93
5.1 Introduction ... 93
5.2 Methodology ... 95
5.2.1 Study Population ... 95
5.2.2 Exposure Assignment and Confounder Selection ... 96
5.2.3 Statistical Analysis ... 99
5.3 Results ... 100
5.4 Discussion ... 110
6. INVESTIGATING THE IMPACT OF FOLIC-ACID SUPPLEMENT USE ON THE RELATIONSHIP BETWEEN EXPOSURE TO PM2.5 DURING PREGNANCY AND CONGENITAL HEART DEFECTS ... 114
6.1 Introduction ... 114
x
6.3 Results ... 117
6.3.1 Main Effects ... 117
6.3.2 Effect Measure Modification ... 118
6.4 Discussion ... 121
7. CONCLUSIONS ... 124
7.1 Summary of Findings ... 124
7.2 Strengths and Limitations ... 127
7.3 Public Health Impact and Avenues for Further Research ... 129
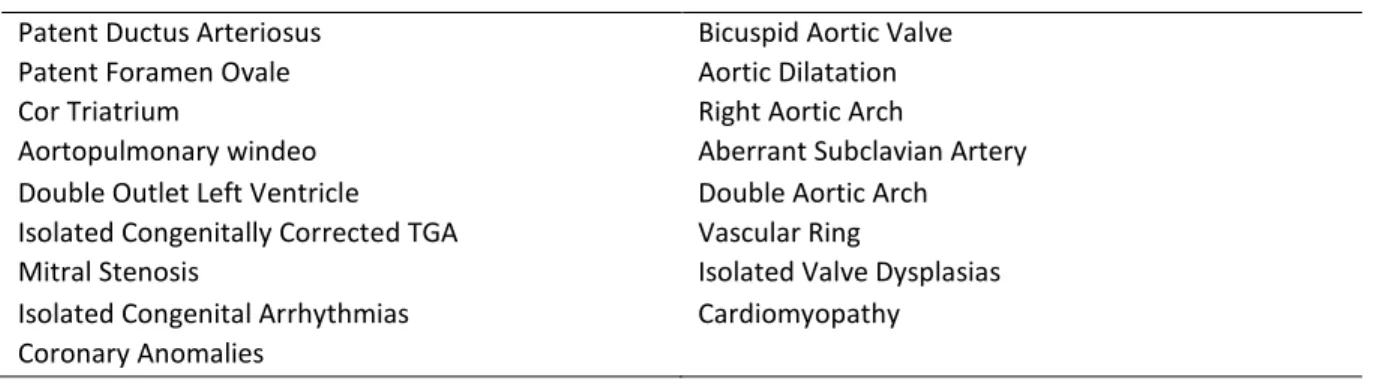
Appendix 1. LIST OF CONGENITAL HEART DEFECT CLASSIFICATIONS IN NATIONAL BIRTH DEFECTS PREVENTION STUDY ... 131
Appendix 2. SUPPLEMENTARY TABLES FOR CHAPTER 4 ... 134
Appendix 3. SUPPLEMENTARY TABLES FOR CHAPTER 5 ... 165
xi LIST OF TABLES
Table 2.1: Current National Ambient Air Quality Standards for the Criteria Air Pollutants ... 5
Table 2.2: Typical fetal cardiac development by week of pregnancy, measured from conception .... 23
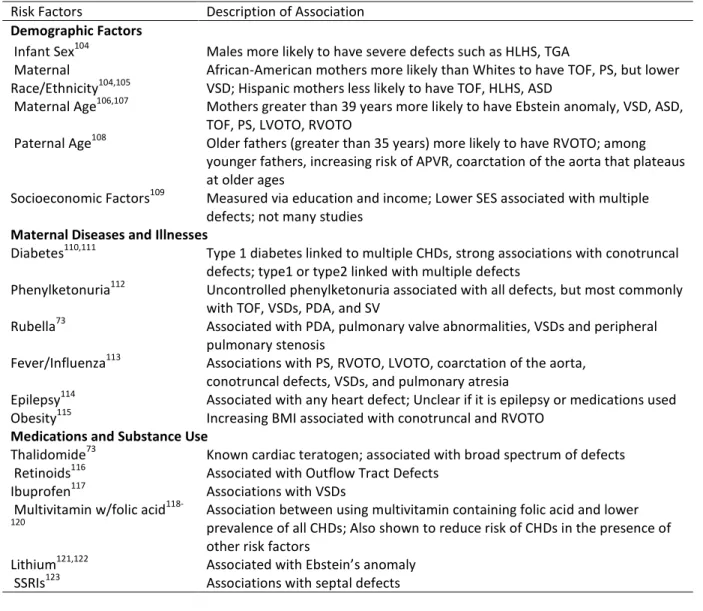
Table 2.3: Summary of Potential Risk Factors for Congenital Heart Defects ... 34
Table 2.4: Summary of Previous Epidemiological Research on Exposure to Air Pollutants and Congenital Heart Defects ... 39
Table 3.1: Congenital heart defects excluded from the National Birth Defects Prevention Study ... 50
Table 3.2: Classification of Congenital Heart Defects, using 2-level of Aggregations and Corresponding Sample Size within the NBDPS most recent analytic database ... 51
Table 3.3: Summary of Analyses to Address Specific Aim 1 ... 55
Table 3.4: Summary of Potential Confounders and Effect Measure Modifiers for Specific Aim 1 ... 60
Table 3.5: Minimum Effect Size Analysis for Different Congenital Heart Defects ... 67
Table 4.1: Demographic comparison of NBDPS congenital heart cases and controls, 1997-2006, for full study and each pollutant examined ... 80
Table 4.2: Estimated adjusted odds ratios and 95% confidence intervals between pollutant factors identified through principal components analysis and cardiac birth defects within NBDPS 1999-2006 ... 86
Table 5.1: Case phenotypes, demographic and behavioral characteristics of NBDPS participants with single, isolated congenital heart defects and controls with estimated dates of delivery from 2001-2006... 105
Table 6.1: Demographic characteristics of NBDPS study population living within 50km of a PM2.5 monitor ... 119
Table 6.2: Adjusted main effects of folic-acid supplement use and dietary folate on congenital heart defects... 120
Table 6.3: Adjusted odds ratios and 95% confidence intervals of PM 2.5 and selected CHDs, by folic acid supplement use ... 120
xii
Table A2.1: Odds Ratios and 95% Confidence Intervals between CHDs and 7-week average exposure to air pollutants ... 135 Table A2.2: Adjusted Odds Ratios and 95% Confidence Intervals between Cardiac
Birth Defects and 7-week average exposure to nitrogen dioxide and
PM10, by distance to major road ... 141 Table A2.3: Adjusted Odds Ratios and 95% Confidence Intervals between cardiac
defect-groupings and weekly exposure to criteria air pollutants from
hierarchical models ... 143 Table A2.4: Odds Ratios and 95% Confidence Intervals between individual cardiac
birth defects and weekly exposure to criteria air pollutants from
hierarchical models ... 150 Table A2.5: Adjusted Odds Ratios and 95% Confidence Intervals between Cardiac
Birth Defects and 7-week average exposure to criteria air pollutants
among participants who lived within 10 km of a stationary air monitor ... 164 Table A3.1: Adjusted odds ratios and 95% confidence intervals for CHDs and 7-week
average exposure to PM2.5 and ozone ... 166 Table A3.2: Adjusted odds ratios and 95% confidence intervals between CHDs and
7-week average exposure to PM2.5 and Ozone using constant numeric cutoffs ... 169 Table A3.3: Odds Ratios and 95% confidence intervals resulting from hierarchical
analysis between cardiac birth defects and weekly exposure to PM2.5 ... 172 Table A3.4: Odds Ratios and 95% Confidence Intervals resulting from hierarchical
xiii LIST OF FIGURES
Figure 2.1: Fetal Heart Circulation ... 24
Figure 2.2: Ventricular Septal Defect ... 26
Figure 2.3: Atrial Septal Defects ... 27
Figure 2.4: Complete Atrioventricular Septal Defect ... 28
Figure 2.5: Tetralogy of Fallot... 29
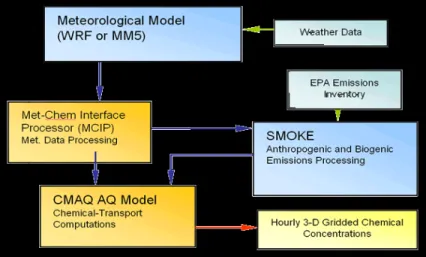
Figure 3.1: Data Inputs into the Community Multiscale Air Quality (CMAQ) Model ... 52
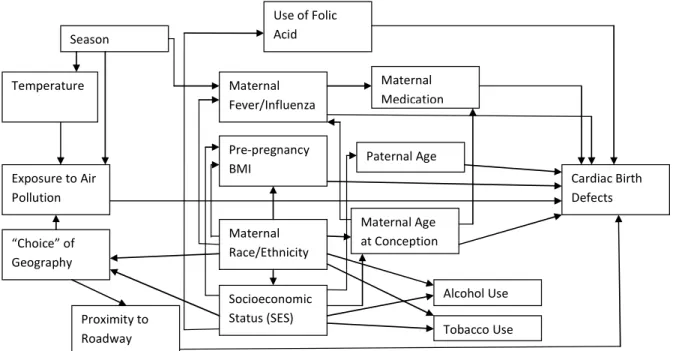
Figure 3.2: Directed Acyclic Graph (DAG) of the relationship between Exposure to Air Pollutants and Congenital Heart Defects ... 59
Figure 4.1: Estimated adjusted odds ratios and 95% confidence intervals between congenital heart defects and 7-week average of daily maximums/24 hour measures of criteria air pollutants, NBDPS 1997-2006 ... 84
Figure 4.2: Estimated adjusted odds ratios and 95% confidence intervals of pulmonary valve stenosis (PVS) for categorical measures of one-week averages of daily maximums/24 hour measures of criteria air pollutants, plotted for weeks 2 through 8 of pregnancy NBDPS 1997-2006. ... 85
Figure 5.1: Population distribution of 7-week average of 24-hr measurements or 8 hour maximums, by source of exposure metric ... 107
Figure 5.2: Adjusted odds ratios and 95% confidence intervals for the relationship between maternal exposure to PM2.5 and congenital heart defects, by source of exposure metric ... 108
xiv
LIST OF ABBREVIATIONS
APVR: anomalous pulmonary venous return AQS: air quality system
ASD: atrial septal defect
ATSDR: Agency for Toxic Substances and Disease Registry AVSD: atrioventricular septal defect
CATI: computer assisted telephone interview CDC: Centers of Disease Control
CHD: congenital heart defect CI: confidence interval
CMAQ: community multiscale air quality CO: carbon monoxide
COA: coarctation of the aorta DAG: directed acyclic graph DFE: dietary folate equivalents DORV: double outlet right ventricle
d-TGA: d-Transposition of the Great Arteries EDD: estimated date of delivery
EMM: effect measure modification EPA: Environmental Protection Agency HLHS: hypoplastic left heart syndrome IAA: interrupted aortic arch
xv LUR: land use regression model
LVOTO: left ventricular outflow tract obstructions NBDPS: National Birth Defects Prevention Study NO: nitrogen oxide
NO2: nitrogen dioxide OR: odds ratio
PAH: polycyclic aromatic hydrocarbon PCA: principal component analysis
PM2.5: particulate matter 2.5 micrometers or less in diameter PM 10: particulate matter 10 micrometers or less in diameter PVS: pulmonary valve stenosis
RVOTO: right ventricular outflow tract obstructions SLAMS: state and local air monitoring systems
SMOKE: sparse matrix operator kernel emissions model SO2: sulfur dioxide
STS: Society of Thoracic Surgeons
TAPVR: total anomalous pulmonary venous return TOF: tetralogy of Fallot
UV: ultra-violet
CHAPTER 1
1. INTRODUCTION AND SPECIFIC AIMS
Over the past few decades, the availability of ambient air pollutant monitoring data has led to extensive research investigating the health effects of exposure to air pollution on adults and children.1,2 In the last decade, a growing number of studies have examined prenatal exposure to air pollutants and a variety of adverse birth outcomes.3-27 The pollutants most often examined are the criteria air pollutants identified by the Clean Air Act: carbon monoxide (CO), nitrogen dioxide (NO2), particulate matter less than 10 µm in aerodynamic diameter (PM10) and less than 2.5 µm in
diameter (PM2.5), ozone (O3), and sulfur dioxide (SO2).
2
Misclassification can also arise from assigning exposure using residence at delivery, instead of complete residential histories.29,30 Important associations may be masked when individual CHDs are aggregated into etiologically heterogeneous groupings, when pollutants are examined individually, without adjusting for other copollutants, or by residual confounding from the incomplete or inaccurate information on confounders contained in administrative data sources used for many studies.31,32 Additionally, analytic methods often do not easily allow for exploring multiple windows of exposure through the course of pregnancy, nor do they account for the underlying spatial and temporal correlation in the data which can impact precision of estimates.33
Although mechanisms behind the associations between air pollutants and birth defects are not well elucidated, Baccarelli et al has shown exposure to particulate air pollution was associated with decreased DNA methylation.34 Considered in conjunction with previous research which found associations between measures of maternal DNA methylation during pregnancy and birth defects, there may be potential for altered DNA methylation mechanisms to play a role in the association between particulate matter and CHDs.35 Because folate acts as a methyl donor that is necessary to initiate and regulate DNA methylation processes, it is possible that a woman’s folate status during pregnancy may modify impacts from particulate matter, and that women with low folate levels may be especially vulnerable to the impacts of air pollutants.36 To date, no studies have examined the role of folate as a potential modifier in the relationship between particulate matter and birth defects, as most studies utilizing administrative databases lack detailed nutrition information.
The goal of this dissertation is to utilize the National Birth Defects Prevention Study (NBDPS), a large population-based national case-control study of birth defects with detailed
3
Specific Aim 1: To determine whether exposure during pregnancy to individual criteria air pollutants, assessed using measurements from stationary air monitors, is associated with CHDs
Subaim 1a: To determine if the relationship between exposure to PM2.5 and CHDs is modified by use of folic-acid supplements early in pregnancy
Subaim 1b: To explore the effect of multiple pollutants on CHDs using principal components analysis (PCA)
Specific Aim 2: To utilize the greater spatial and temporal resolution of exposure estimates derived from deterministic pollutant simulation models to investigate the association between select criteria air pollutants and CHDs
Subaim 2a: To compare effect estimates and model fit when using monitoring data and output from a statistical model which combines the two in order to assign women’s exposure during pregnancy
Subaim 2b: To determine if the addition of rural populations, who are often excluded from studies due to large distance from monitoring sites, affects the observed relationship between exposure to criteria air pollutants and CHDs
CHAPTER 2
2. BACKGROUND
2.1 Ambient Air Pollution
Ambient air pollutants are any solid, liquid, or gaseous substance found in the outdoor air, resulting from either natural or man-made processes. For centuries, there has been concern over the impact of contaminants in the air on the health of exposed populations. As far back as the 18th century, Bernardo Ramazzini discussed in his treatise De Morbis Artificum the case of a
manufacturing plant in a small town outside of Modena where “fumes given off by the vitriol which so tainted the air nearby that it was rendered unhealthy and dangerous for the lungs”.37 In 1931, the New York Academy of Medicine published its first report on the effect of air pollution on health, concluding that the air pollution problem in New York City and other cities was a “serious menace to health”.38 Two decades later, following the Great Smog of London in 1952, the U.S. federal
government began to address the issue by passing the Air Pollution Control Act of 1955, which provided federal monies for air pollution research.39 In 1963, the first Clean Air Act was passed, which provided funds and authorization for federal research into air pollution monitoring and control. A few years later, the Air Quality Act of 1967 expanded monitoring studies and began to regulate interstate air pollution transport. However, it was the Clean Air Act of 1970 that created specific federal and state regulations designed to limit pollutant emissions and to expand
5
known as the criteria air pollutants are: carbon monoxide (CO), lead, nitrogen oxides (NOx) with a particular focus on nitrogen dioxide (NO2), ozone (O3), particulate matter (PM) of different sizes, and sulfur dioxide (SO2). The National Ambient Air Quality Standards (NAAQS) for these pollutants are provided in Table 1.40
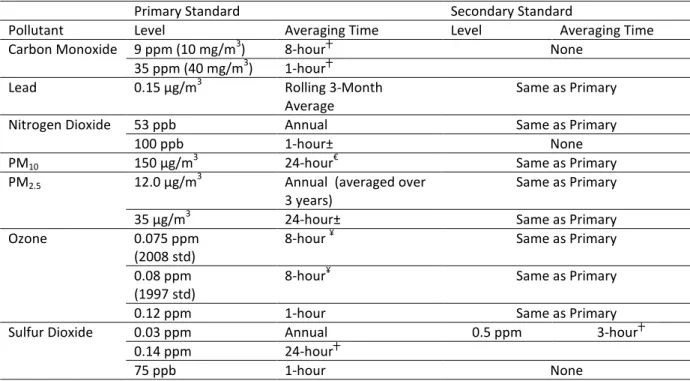
Table 2.1: Current National Ambient Air Quality Standards for the Criteria Air Pollutants
Primary Standard Secondary Standard
Pollutant Level Averaging Time Level Averaging Time
Carbon Monoxide 9 ppm (10 mg/m3) 8-hour┼ None
35 ppm (40 mg/m3) 1-hour┼
Lead 0.15 µg/m3 Rolling 3-Month
Average
Same as Primary
Nitrogen Dioxide 53 ppb Annual Same as Primary
100 ppb 1-hour± None
PM10 150 µg/m
3
24-hour€ Same as Primary
PM2.5 12.0 µg/m
3
Annual (averaged over 3 years)
Same as Primary
35 µg/m3 24-hour± Same as Primary
Ozone 0.075 ppm
(2008 std)
8-hour ¥ Same as Primary
0.08 ppm (1997 std)
8-hour¥ Same as Primary
0.12 ppm 1-hour Same as Primary
Sulfur Dioxide 0.03 ppm Annual 0.5 ppm 3-hour┼
0.14 ppm 24-hour┼
75 ppb 1-hour None
*reproduced from http://www.epa.gov/air/criteria.html; primary standards are defined as limits to protect public health, while secondary standards set limits to protect public welfare, which includes protecting damage to animals, crops, vegetation, and buildings
┼ cannot be exceeded more than once per year
±the 3-year average of the 98th percentile at each monitor within an area cannot exceed the limit €
cannot be exceeded on average more than once per year over a 3 –year period ¥3-year average of the fourth-highest daily maximum 8-hour average
6
below current regulatory levels, particularly among vulnerable populations such as the elderly, children, asthmatics, people with preexisting heart conditions, pregnant women and developing fetuses.42,43 The extensive monitoring system begun to oversee compliance with the Clean Air Act provides a valuable resource for air pollution epidemiology and public health research, as the availability of exposure estimates for the entire United States greatly facilitates human health studies into the effects of the criteria air pollutants.
2.1.1 Criteria Air Pollutants
As a result of the Clean Air Act and changes in motor vehicle and industrial technologies, the ambient air concentration of all of the criteria air pollutants has decreased. However, since the reduction and eventual removal of lead from gasoline, the concentration of lead in the air has dropped more than any other pollutant. From 1980-2009, the amount of lead found in ambient air has dropped, on average, 93%.44 Subsequently, the primary route of exposure to lead is through dust and soils, and not inhalation of ambient air. Therefore, lead will not be included in this study of criteria air pollutants and birth outcomes. Below is a brief description of each of the criteria air pollutants, including
information about sources, variability, and general toxicity. More detailed information on potential mechanisms for their action on reproductive and birth outcomes are included in Section 2.1.1.6.
2.1.1.1 Carbon Monoxide (CO)
Description and Sources
7
motor vehicle traffic has been diminished. People are also exposed to CO through use of tobacco products and exposure to environmental tobacco smoke.
Temporal and geographic variability
CO is highest in late winter, when weather inversions trap ambient air pollutants closer to the earth’s surface. Daily patterns in CO levels follow the use of motor vehicles, with highest levels corresponding to morning and early evening rush hours. Ambient levels tend to be greater at higher altitude, and are also greater in urban areas, corresponding to greater amounts of motor vehicle use.45
Toxicity
CO primarily acts by displacing oxygen and binding with hemoglobin in the blood to form carboxyhemoglobin. This reduces the oxygen-carrying ability of the blood and the amount of oxygen transported to tissues and organs, with the degree dependent upon the amount of CO exposure. High exposures of CO can lead to severe tissue hypoxia. Exposures to CO from the ambient air and/or exposure to tobacco smoke are generally lower than the level associated with severe toxicity, but have been shown to cause more subtle hypoxic effects. Additionally, CO can bind with heme in proteins in other areas of the body, including myoglobin in muscle tissue, certain transcription factors, and in proteins involved in physiological regulatory processes that may utilize endogenous CO. It is hypothesized that exposure to exogenous CO may disrupt these regulatory processes, which include nitric oxide cell-signaling pathways, energy metabolism, and mitochondrial respiration.45
2.1.1.2 Nitrogen Dioxides (NO2)
Description and Sources
8
volatile organic compounds and hydrocarbons, NO2 is a precursor for ozone formation, as well as other air toxics including nitro-PAHs, which are formed either directly through combustion of fuels or in the atmosphere. NO2 also contributes to the acidification of particulate matter in the ambient air. While the relative contribution of sources can vary by local area, the primary sources of NO2 are motor vehicles and electricity generation.46
Temporal and Geographic Variability
Similar to other air pollutants, NO2 is higher in winter due to weather inversions and tends to fluctuate according to periods of high motor vehicle use. Ambient levels of NO2 often peak during morning rush hour and tends to be higher in urban areas, particularly in the Northeastern United States.46
Toxicity
NO2 is highly water soluble, and when inhaled, reacts with moisture in the airways to produce nitric acids, which irritate the airways. Further, NO2 can react with unsaturated fatty acids in the body, initiating the production of free radicals, which can cause protein oxidation, lipid peroxidation, and cell membrane damage. At high exposures, NO2 will displace oxygen and bind with hemoglobin in the blood stream to form methemoglobin, which can lead to hypoxia.46 2.1.1.3 Ozone (O3)
Description and Sources
9
Temporal and Geographic Variability
Because ozone forms as a result of photochemical reactions in the atmosphere, ambient levels tend to be higher in summer when sunlight is greater and in the mid-afternoon, when enough time as passed for the reactions to take place. In many areas of the United States, ozone isn’t monitored in the winter months. Similar to other pollutants, ambient ozone levels are higher in urban areas, but geographically tend to be greater in the warm areas of the West and Southwest, as opposed to the Northeast.47
Toxicity
Ozone is a highly reactive gas and, similar to NO2, its main method of action is through oxidation, particularly of unsaturated fatty acids in the extracellular lining fluid of the respiratory tract. Ozone-mediated oxidation reactions generate free radicals, which can then react to form cytotoxic nonradicals. The byproducts of these reactions may provide the mechanism for non-pulmonary health effects by initiating/propagating inflammatory effects or increasing oxidative stress.47
2.1.1.4 Particulate Matter (PM)
Description and Sources
Particulate matter (PM) refers to a heterogeneous mixture of solid and liquid particles that can vary in size, shape and composition based on their source. Classified by particle diameter, the most commonly monitored and investigated classes are PM10 and PM2.5. The subscript refers to the diameter size of the particles included in the grouping. Often PM10 is used to refer to PM10-2.5 which includes particles with diameters between 2.5 and 10 microns in diameter. This is often referred to as coarse PM. PM2.5 is referred to as fine PM, while
10
oxidation of pollutant gases. Coarse PM is more likely to consist of primary particulates. The predominant source of primary PM10 is road dust, while the predominant source of primary PM2.5 is wild fires, followed by road dust and electricity generation. The majority of PM2.5 is secondary particles, formed through processes such as coagulation, where two small particles combine to form one, condensation, when gases combine to form a single particle or through nucleation where gases react to form products with very low vapor pressure and then undergo a phase change to create an ultrafine particle. In addition to size, PM can be further classified by its primary chemical constituents. The primary chemical species of PM2.5 investigated are sulfate, nitrate, organic carbon, elemental carbon, total carbon, and water-soluble metals.48
Temporal and geographic variability
In general, PM peaks during cooler temperatures, although this varies based on geography and composition of the particles. Certain chemical species of PM2.5 exhibit more seasonality than others. For example, organic carbon particulates peak during the fall and winter in the western United States and between spring and fall in the southeastern United States, while elemental carbon is relatively stable. Concentrations of sulfate in particulates peak during warmer temperatures when more oxidation of SO2 occurs. In contrast, nitrate species peak during cooler temperatures when there is more temperature-driven partitioning and volatilization. Both PM10 and PM2.5 peak twice during the day, once in the morning,
corresponding to rush hour and the breakup of the overnight inversion layer and again starting during the evening rush hour and extending into the later evening hours corresponding to changes in atmospheric layers.
11
species of PM2.5. In the eastern United States, sulfate is the most common component followed by organic carbon, while in the western part of the country, organic carbon is most prevalent.48
Toxicity
Both its chemical composition and the surface characteristics of the particulate are thought to give PM oxidative potential, causing injury and inflammation within the respiratory cells. It is also suggested that exposure to PM can indirectly cause inflammation by triggering a release of reactive oxidative species from respiratory cells. These oxidative species can impact intracellular signaling pathway at low levels, while higher levels can lead to DNA damage and cellular toxicity. It is hypothesized that pulmonary inflammation can lead to systemic
inflammation through the release of cytokines, potentially explaining associations between PM and non-respiratory health effects.48 Additionally, previous research suggests that exposure to PM can change plasma viscosity and endothelial function.49 Recently, it has been hypothesized that PM may also play a role in promoting epigenetic changes, by reducing DNA methylation, which is involved in regulating cellular processes such as gene transcription, genomic imprinting, and chromosome stability.34
2.1.1.5 Sulfur Dioxide (SO2)
Description and sources
12
Temporal and Geographic Variability
There is no strong, seasonal trend for SO2 that is consistent across the United Dates. Levels are highly dependent upon prevailing winds. Oxidation of SO2 is greater at higher temperatures, sometimes causing lower measured levels in the warmer months. SO2 levels in the ambient air tend to peak mid-day, and reach their lowest levels overnight. SO2 levels are higher in the Eastern United States, particularly the Mid-Atlantic and Northeastern sections.50 Approximately 80% of SO2 emissions in the US come from the 31 states bordering or east of the Mississippi River.51
Toxicity
Highly water-soluble, SO2 is absorbed by moisture in the nasal and respiratory tracts and can be broken down into bisulfites and sulfites, which get distributed throughout the body via the bloodstream. Bisulfites can react with a number of biomolecules, including nucleic acids which can lead to mutational events. Additionally, through autoxidation, bisulfites can generate free radicals which can be distributed systemically and are hypothesized to contribute to observed associations between SO2 exposure and cardiac events.
52
2.1.1.6 Toxicity Specific to the Pre-and Perinatal Time Period
General toxicity of the individual criteria air pollutants was summarized above. The potential for developmental toxicity of these pollutants is not well characterized, but it is hypothesized that the developing organs and body systems of a fetus are particularly vulnerable to environmental insult.53 It is also possible that the relative dose received by the fetus may be different than what is received by maternal tissues following exposure. For example,
13
As described by Slama et al, air pollutants could directly impact the fetus, as they readily pass through the placenta, or the effects could be indirect, mediated by effects on the mother and/or the placenta.13 Some of these mechanisms include triggering epigenetic changes in the mother or the fetus, affecting maternal-fetal nutrient exchange through changes in plasma viscosity, endocrine disruption through alteration of the mother’s progesterone production (e.g. activation of the hypothalamic-pituitary-adrenal axis), direct disruption of organogenesis, and release of cytokines and induction of oxidative stress in the mother contributing to systemic inflammation in the fetus. There is also the possibility that air pollutants could impact the germ cells of either the mother or the father. Proposed biological mechanisms are further discussed in Section 2.2.6 and 2.3.5.
2.1.2 Methods of Exposure Assessment
14 2.1.2.1 Proximity-based
Proximity-based measures use the distance from an individual’s location to a source of exposure as a proxy for an individual’s exposure to air pollution. There is no direct
measurement or estimation of air pollutant concentrations in the ambient air. This method is often utilized in studies examining motor vehicle traffic, with exposure assessed as distance to a primary roadway. It has also been used in studies which examine fixed sources of pollutants such as industrial operations or power plants. This method is easy to implement, but is subject to high levels of misclassification.55 It is grounded in the assumption of isotropic dispersion, that pollutants will disperse from the emission source equally in all directions. This assumption often does not hold for air pollutants due to wind direction and atmospheric reactions between pollutants from different sources. While there are techniques to deal with incorporating
distance to multiple sources, they are often not complete, leaving the potential for unaccounted sources of exposure. Additionally, interpreting findings based on these proximity measures can be difficult since it is often unclear how much of each pollutant were emitted by the source.55
2.1.2.2 Emissions Inventories
Emissions inventories are source-specific, comprehensive listings of air pollutant emissions for a defined geographic area, during a specified period of time. In the United States, they are often compiled at the state and/or local level and then submitted to the Environmental Protection Agency for inclusion in the National Emissions Inventory database.56 Again, pollutant concentrations are not directly measured, but emissions of specific pollutants are reported for different pollution sources. Currently, the EPA mandates reporting the emissions of criteria air pollutants, while emissions of hazardous air pollutants and greenhouse gases can be submitted on a voluntary basis by the states and local agencies. The pollutant sources which are
15
Facility/point sources: large, fixed sources of pollutants that are mandated to report their emissions of individual pollutants directly to the state/local agencies. These often include large industrial facilities, power plants, etc.
Area/Non-point sources: smaller, fixed sources of pollutants that are either too numerous, too small, or to impractical to mandate individual reporting of emissions. Instead, emissions from these sources are reported in the aggregate. Non-point sources could include dry cleaners, commercial solvent use within a specified county, etc. Onroad/Non-road : motor vehicles and off-road vehicles, engines and equipment used for construction and other activities. The emissions from these sources are estimated, often at the county level by a local or state agency, and reported in aggregate.
Events: sudden or unexpected events that emit pollutants into the atmosphere. Examples would be wildfires, natural disasters, etc. These are reported as necessary by the state and local agencies.
Biogenic: naturally occurring emissions. These are not reported, but are directly estimated by the EPA and then included in the NEI.
16
2.1.2.3 Measurements at Centralized Ambient Air Monitors
This method directly measures concentrations of air pollutants in samples of the ambient air. Air monitors are often stationary as part of a fixed monitoring network, but they can be mobile or set up by an individual investigator or agency for a specific purpose. Because the Clean Air Act mandated that every state establish a network of air monitoring stations for criteria air pollutants, measurements from these centralized, stationary air monitors are often utilized in air pollution epidemiology. The monitors in this network are called the State and Local Air Monitoring Stations (SLAMS) and the data from these stations is reported to and compiled by EPA. There are other national air-monitoring networks including the National Air Monitoring Stations , the Special Purpose Monitors , and the Photochemical Assessment Monitoring Stations which supplement the SLAMS network.57 To ensure that measurements taken in different states and local areas are consistent across the United States, the EPA has published detailed reference and equivalent methods to measure the concentrations of specific air pollutants in the ambient air that must be used by the SLAMS.58 General descriptions of the most commonly used methods for each criteria pollutant are briefly described below:
Carbon Monoxide: A sample of ambient air is drawn into a chamber where it is exposed to a beam of infrared light while a chamber with no ambient air contains another beam of infrared light. Because CO absorbs infrared radiation, measuring the decrease in intensity of the beam exposed to the ambient air corresponds to the CO concentration of the sampled air.59
Nitrogen Dioxide: Nitric oxide (NO) reacts with ozone to produce light at wavelengths greater than 600nm. NO2 is measured by comparing the intensity of light produced when NO2 in ambient air is first converted into NO and then reacted with ozone to the intensity of light produced when ambient air is reacted with ozone, without converting the NO2 to NO.
17
Ozone: Ozone absorbs UV light at wavelengths of 254nm. Using this knowledge, a photometric method to measure ozone concentration is utilized by comparing the absorption of an ambient air sample to an ambient air sample where the ozone has been reduced to molecular oxygen.61
Particulate Matter: Air samplers draw ambient air into a specially-shaped inlet and through a particle size separator, after which particles of the specified size are deposited onto a filter. The filter is then weighed and the mass of the particles is the difference between that weight and the weight of the filter alone. The concentration is expressed as the measured mass of the particles divided by the total amount of air that was sampled. Special monitors with three separate filters are used to measure the different chemical species of PM2.5. The filters are sent to a centralized laboratory and particles on the Teflon filter are used to assess total mass and the presence of elements/metals. The nylon filter is analyzed using filter extraction and ion chromatography for anions (e.g. sulfate, nitrate) and cations (e.g. potassium, sodium), while the quartz filter is analyzed for organic and elemental carbon using a thermal optical transmittance method.62
Sulfur Dioxide: When SO2 reacts with ultraviolet (UV) energy, it emits light of a specific wavelength. SO2 in air is measured by passing a sample of ambient air into a chamber where it reacts with UV energy and the light emitted is measured and used to calculate the SO2 concentration.
63
18
factors that may influence air concentrations at the individual’s location, nor does it account for measurements taken at other monitors that may also be in close proximity or in a more relevant geographical position (i.e. upwind as opposed to downwind of an individual’s location).
2.1.2.4 Geostatistical Models using Monitoring Data
Using measurements taken at centralized air monitors, geostatistical models estimate ambient levels of pollutants at locations between monitors using interpolation techniques. The most common technique is called kriging and it examines spatial patterns in the measurements taken at multiple monitoring stations in order to model the variation and estimate pollutant levels, with corresponding standard errors, at other locations of interest. These models are most effective when there is a dense, evenly-distributed network of monitors, which is often not in the case in suburban and rural areas. Additionally, these methods may not reflect local sources of pollutants since they are dependent upon the available monitoring data at distant points. Similar to measurements taken at the closest monitor, exposure estimates obtained by kriging do not incorporate wind, topography, secondary atmospheric reactions, and other factors that could influence ambient levels of pollutants at an individual’s location.55,64
2.1.2.5 Land Use Regression Models
Land use regression models (LURs) utilize topography and land use characteristics in their estimation of ambient pollutant levels at non-measured locations. An LUR uses
measurements obtained from a network of air monitoring stations as a dependent variable and land use variables such as traffic counts, road networks, topography, meteorology, and
19
are often limited to studies of smaller geographic areas, due to the density of the air monitoring network and level of detailed information on other factors needed for its implementation. Additionally, the model often has limited generalizability and cannot be applied to areas with different land characteristics or pollutant sources, restricting its use to small areas very similar to where the model was originally developed.65
2.1.2.6 Deterministic Prediction Models
Rather than using measurements taken at centralized fixed monitors as the basis for interpolating or predicting ambient pollutant levels at non-monitored locations, deterministic prediction models utilize information on emissions, fate-transport of pollutants, atmospheric chemistry and production of secondary pollutants, and meteorology in order to predict a pollutant concentration surface for a specified geographic area. The simplest form of this model, a dispersion model, is based on Gaussian plume equations which are used to represent how pollutants are generated and transported in the ambient air.64 Integrated meteorological-emissions models, another deterministic numerical-based model, utilizes those same multiple sources of data but then mathematically simulates the dynamic processes that occur in the atmosphere in order to predict pollutant concentration surfaces.55 The EPA’s Community Multi-scale Air Quality (CMAQ) model is an example of an integration meteorological-emissions model and will be discussed in more detail in Section 3.2.2.2.66 In order to improve pollutant
20
pollutants are distributed in the ambient air, providing a more accurate proxy estimation of exposure at an individual’s location.
2.1.2.7 Probabilistic Exposure Models
While the deterministic models described above utilize large amounts of data to predict ambient levels of pollutants in the ambient air, they do not account for human activity, time-spent indoors, and other factors that can lead to misclassification when ambient estimates are used as proxy exposures for an individual. Probabilistic exposure models attempt to incorporate human activity into pollutant exposure models by simulating the population’s exposure as they move through multiple microenvironments during their daily life.68 Data on individual activities that are incorporated into the models comes from detailed diaries kept my people living within the area the model is being developed. Because they are estimating population exposures on an aggregate level such as census block or block group, the outputs from these models yield a range of exposures or an estimated percentage of residents in a given area who are above a certain exposure.69 Because they do not output a single exposure estimate that can be applied to an individual, their utility in epidemiologic studies of etiologic disease-exposure relationships are somewhat limited.
21
to the large expense of collecting and analyzing biospecimens, they have not been utilized in large-scale studies.
2.2 Congenital heart defects
2.2.1 Definition and Diagnosis
Congenital heart defects (CHDs), also referred to as cardiac birth defects or congenital heart disease, are generally defined as any abnormality in the structure and/or function of the heart or great vessels, which is present at birth. This definition results in a heterogeneous group of defects that vary anatomically, embryologically, in severity, and, potentially in etiologic risk factors.73 Depending upon the classification system used, there can be over 30 distinct groups of CHDs, with each group potentially containing defects of slightly varying phenotype and/or combinations of multiple defects. CHDs can be diagnosed prenatally using a fetal echocardiogram or after the infant is born using other imaging and diagnostic technologies, such as echocardiograms, electrocardiograms, chest X-rays, MRIs and CT scans. If a defect is not detected during prenatal screening, usually only defects that cause symptoms in the infant will be detected and diagnosed. These symptoms include irregular heartbeats, irregular breathing, poor weight gain, swelling of the extremities, and cyanosis.73
2.2.2 Prevalence, Morbidity and Mortality
22
easily diagnosed with newer technologies. They noted that the birth-prevalence of more severe forms of CHDs was relatively stable at 1.3 per 1000 live-births.74 Studies published since the Hoffman review have been consistent with these findings. Two studies in the US, one in Atlanta75 and one in California76, had differing overall prevalence of CHDs, 6.2 vs. 3.2 per 1000 live-births respectively, but found the same prevalence of severe defects at 1.3 per 1000 live births. The study in Atlanta had similar findings to a consortium study in Europe, which observed an overall prevalence of 6.6 per 1000 live-births and a prevalence of 1.3 per 1000 live births for severe defects.77 Other studies in France, Sweden, and Taiwan had similar prevalence estimates for severe CHDs.73
It should be noted that birth-prevalence is defined as the number of infants with diagnosed CHDs divided by the total number of live-births during a given time period. Because CHDs can cause spontaneous abortions, stillbirths or lead to elective terminations, some studies include fetal deaths after 20 weeks due to a cardiac birth defect and elective terminations due to a cardiac birth defect in the calculation. But elective termination data are sometimes not available. Some studies have tried to quantify the impact of missing data on elective terminations, but have found considerable variability in the effect on estimates.78,79 Differences in these impacts are dependent upon the utilization of prenatal diagnosis and elective terminations of fetuses with defects.80 It can be difficult to estimate the impact of elective terminations for single, isolated CHDs. A study in Atlanta found that 8% of pregnancies with fetuses with prenatally diagnosed defects were electively terminated.81 However, that figure included all CHDs. CHDs are more prevalent in fetuses with chromosomal abnormalities like trisomy, and the termination rate among those fetuses has been increasing and tends to vary by population.82,83 The termination rate among single, isolated CHDs is likely lower.
23
severe CHDs may be more prevalent among early fetal losses, causing an underestimation of the true incidence of defects when examining only late fetal loss and live-births.73 Although all defects are present at birth, the majority of CHDs are not diagnosed prenatally and some diagnoses are delayed until many months after birth, when they begin to affect the infant’s breathing and growth. This delayed diagnosis is more common among defects such as ASDs and VSDs, which may result in minor or no symptoms. Rarely, minor defects can be undiagnosed well into adulthood.
Table 2.2: Typical fetal cardiac development by week of pregnancy, measured from conception
In addition to being the most common group of birth defects, CHDs are also the leading cause of birth-defect related death. The age-standardized mortality rate for cardiac birth defect related deaths in the US from 1999-2006 was 1.78 per 100,000.84 There have not been very many long-term follow-up studies among infants born with birth defects to examine long-term prognosis and mortality. Within the Texas Birth Defects Registry from 1996-2003, it was observed that 8% of infants born with a cardiac birth defect died within the first year of life.85 Nationally, it is estimated that about half of cardiac-defect related deaths occur during the first-year of life, with approximately 70% of those occurring Week Cardiac Developmental Events
3 Endocardial tubes form from cells in the cardiogenic plate and move toward each other, eventually fusing to form a single heart tube with separate “sections” that will form the chambers of the heart. The heart tube than moves into the thoracic region.
4 Fusion of the endocardial tubes is complete, and the heart begins to beat. Pericardial cavity is formed. Heart tube begins to grow and fold upon itself, creating the positions and early structures of the fetal heart. Ventricles begin to dilate. The pulmonary artery begins to form on the left wall of the atrium. The endocardial cushions appear/form the atrioventricular canal.
5 The truncal swellings, which will eventually form the septum in the outflow tract that contributes to the formation of the aorta and pulmonary trunk, begin to form. The partitioning of the atrium begins. The ostium (foramen) secundum, forms.
6 The foramen ovale forms and establishes the primary path of the fetal circulatory system. Endocardial cushions begin fuse to partition the atrioventricular canal and eventually form the mitral and tricuspid valves.
7 The growth of the ventricles is completed, and the ventricular septum, which divides the two ventricles, stops growing. The coronary sinus is formed.
24
during the neonatal period (<28 days post-birth). In the US, 4.2% of all neonatal deaths have a cardiac birth defect listed as the underlying cause.86 Among infants who survive the first year of life, 76% of birth-defect related mortality occurs in adulthood.84 Improvements in surgical interventions and treatments have greatly improved prognosis, and the mortality rates of CHDs have been decreasing among all age-groups.84,87 Currently there are 1.4 million children and adults living in the US who were diagnosed with a cardiac birth defect. Even after corrective surgery and/or medication regimens, many people born with a CHD will have physical limitations and ongoing complications throughout their lifetime. Some of these complications include infectious endocarditis, arrhythmias, reoperations on their defects, heart failure, and in rare cases pulmonary hypertension.73 Additionally, women with CHDs are more likely to have pregnancy complications, including having a child with a CHD.88
2.2.3 Cardiac Development and Relevant Time Periods of Exposure
CHDs result from alterations from normal heart development, which occurs during weeks 3 through 8 of pregnancy. Cardiac development in a typically developing embryo is summarized, by week of pregnancy, in Table 2.2.89
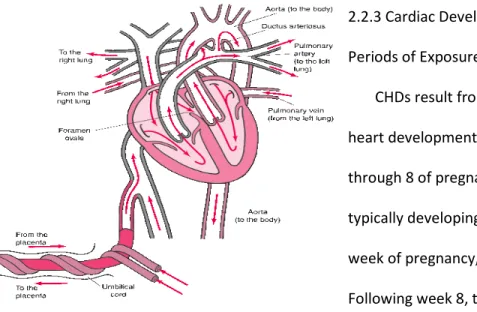
Following week 8, the heart’s development is mainly complete, and it continues to grow in size along with the fetus. However, fetal circulation is different than circulation following birth (Figure 2.1). In typical human circulation, blood enters the heart from the body through the right atrium, travels into the right ventricle and then into the pulmonary artery where it receives oxygen from the lungs. The pulmonary vein carries oxygen-rich blood to the left atrium, where it enters the left ventricle and is then pumped out to the tissues of the body. During fetal life, oxygen is delivered from the mother to the
Figure 2.1: Fetal Heart Circulation
25
fetus through the placenta and umbilical cord. Because the fetal lungs are not in use, temporary fetal structures, the foramen ovale and the ductus arteriousus, shunt blood away from the pulmonary circulatory system. The foramen ovale allows blood to pass directly from the right atrium to the left atrium, bypassing the right ventricle where it would normally be sent to the pulmonary artery. The ductus arteriousus connects the pulmonary artery directly to the aorta, shunting any blood that didn’t pass through the foramen ovale away from the lungs. Once the fetus is born and takes his/her first breath, pressure changes cause these two structures to close and blood to flow through the pulmonary circulatory system, ensuring oxygen-carbon dioxide exchange. Many CHDs impact the infant by shunting
blood within the heart in a way that reduces oxygenation of the body organs and tissues.90 Most studies of CHDs focus on exposures only during the first 2 months of pregnancy, when the
structure of the fetal heart is developing. However, because of the potential for epigenetic changes in either the mother and/or the germ cells to contribute to the development of CHDs, exposures prior to pregnancy may also be relevant.13 Additionally, insults in late pregnancy can impact the normal closure of remnants of the fetal circulation system. For example, ibuprofen taken in the 3rd trimester has been shown to cause premature closure of the ductus arteriousus.73 Whether certain late-pregnancy insults can prevent closure has not been examined.
As stated above, defects occur when these developmental events fail to proceed and/or complete properly. In the following section, details on individual defects, including formation and resulting morbidity are described.
2.2.4 Classification and Description of CHDs
As written above, CHDs are a heterogeneous group of defects. Recently, an international collaborative committee, led by the Society for Thoracic Surgeons (STS), created a standard
26
individual diagnoses. On the population level, because there are so many different individual phenotypes, aggregation is required to ensure consistency for surveillance and research purposes, as well as to avoid extremely small sample sizes. While there are classification schemes based on the clinical severity of the defects73 or on the pathogenetic mechanisms underlying the defects92, most are based on anatomical location of the defect.31,93,94 The International Classification for Diseases (ICD) codes have been used to classify CHDs94, although most surveillance programs in the US utilize the classification system developed by the British Pediatric Association93, which was subsequently modified by the Centers of Disease Control. These BPA/CDC codes are more detailed than the ICD codes. Recently, the STS has developed a classification scheme based on the standardized nomenclature mentioned above.95 Although there are some differences between these classification schemes, they all utilize multiple levels of aggregation starting with categories broadly based on anatomy and/or
developmental considerations, which are then further broken down into specific individual defects. Below, the broadest groupings of CHDs used by the STS classification system are listed and described.91,96 More detailed descriptions of some of the more common defects within those groups are also included.96 The National Birth Defects Prevention Study (NBDPS), the source of the data for this proposal, utilizes a different classification scheme that was created explicitly for the purposes of that study.97 Because the NBDPS excludes certain classes of defects, the STS groupings are more
comprehensive for a general overview. The NBDPS classification scheme will be described in detail in Section 3.2.1.3.
2.2.4.1 Ventricular Septal Defects The most prevalent of the CHDs,
ventricular septal defects (VSDs) are defects Figure 2.2: Ventricular Septal Defect
27
located in the wall, or septum, which separates the left and right ventricle. VSDs are hypothesized to arise from abnormal folding of the heart during development. As shown in Figure 2.2, this enables left-to-right shunting of blood within the heart, disrupting normal ventricular volume and pressure. These defects range in size and severity, with smaller VSDs causing no symptoms and often closing on their own as the heart grows. Larger VSDs can cause pulmonary hypertension and may require surgery. VSDs can be further classified by where in the septum they are located: in the membranous section (the most common of the defects), in the muscle, in the subpulmonary outlet or in the
inlet/atrioventricular section. Only membranous and muscular VSDs are included in the VSD group heading. VSDs in the outlet are classified under the heading of conotruncal defects, and VSDs in the atrioventricular
section are classified under the heading of atrioventricular septal defects.
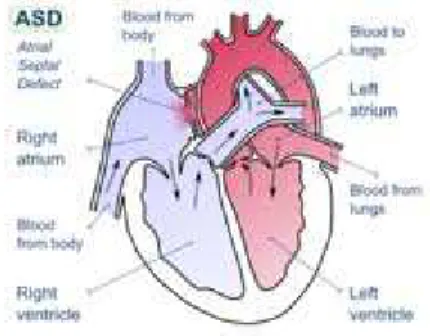
2.2.4.2 Atrial Septal Defects
Atrial septal defects (ASDs) are another common defect, which are located in the septum which separates the left and right atrium (Figure 2.3). Similar to VSDs, ASDs, can cause left-to-right shunting of blood. They vary by size and severity, and small ASDs are often
asymptomatic. There are 3 types of ASDs: ASD secundum (ASD2), ASD primum (ASD1), and ASD sinus venous. ASD, primum is categorized as an atrioventricular septal defects since it involves the endocardial cushions. ASD, sinus venous are included in the cell growth grouping of defects. ASD, secundum is the most prevalent ASD and is a defect within the middle of the septum, where the foramen ovale was located. They result from inadequate growth of the septum secundum or too much reabsorption of the septum primum during development. ASD,
Figure 2.3: Atrial Septal Defects
secundums are not foramen ovales that failed to close after birth. Those defects, called pat foramen ovale, are not generally considered an ASD, but a separate defect.
2.2.4.3 Atrioventricular Septal Defect
Previously known as endocardial cushion defects, atrioventricular septal defects arise when the two endocardial cushions fail to fuse properly with the atrial septum and/or ventricular septum during development. These defects are actually a combination of multiple defects that involve the atrial and ventricular septums and the valves at their junctions. AVSDs
are further classified as partial, intermediate (or transitional), or complete depending mostly upon the degree of ventricular malformation.
above as a defect in the anterior section of the atrial septum, either with or without a cleft located in the mitral valve. The transitional AVSD also has a minor defect in the ventricular septum, while a complete AVSD has an ASD1, a VSD in the inlet, and abnormalities in the valves that separate the atria and ventricles. The combination of an ASD1 and a VSD in the ventricular inlet results in a large, centralized defect which causes shunting of the blood that di
volume and pressure in all 4 chambers of the heart, causing the heart to become enlarged (Figure 2.4). Due to abnormalities in the valves, blood can also flow “backwards” through the valves, also known as valve regurgitation. These defects can be
2.2.4.4 Conotruncal Defects
Conotruncal defects are malformations concerning the outflow tracts of the heart, the portion of the ventricles that connect to the great arteries. The most common conotruncal defect is Tetralogy of Fallot (TOF), a collection of 4 distinct malformations.
2.5, TOF consists of a narrowing of the pulmonary valve, known as pulmonary stenosis, a 28
secundums are not foramen ovales that failed to close after birth. Those defects, called pat foramen ovale, are not generally considered an ASD, but a separate defect.
2.2.4.3 Atrioventricular Septal Defects
Previously known as endocardial cushion defects, atrioventricular septal defects arise when the two endocardial cushions fail to fuse properly with the atrial septum and/or ventricular septum during development. These defects are
on of multiple defects that involve the atrial and ventricular septums and the valves at their junctions. AVSDs
are further classified as partial, intermediate (or transitional), or complete depending mostly upon the degree of ventricular malformation. A partial AVSD is an ASD primum, described above as a defect in the anterior section of the atrial septum, either with or without a cleft located in the mitral valve. The transitional AVSD also has a minor defect in the ventricular
e AVSD has an ASD1, a VSD in the inlet, and abnormalities in the valves that separate the atria and ventricles. The combination of an ASD1 and a VSD in the ventricular inlet results in a large, centralized defect which causes shunting of the blood that di
volume and pressure in all 4 chambers of the heart, causing the heart to become enlarged 4). Due to abnormalities in the valves, blood can also flow “backwards” through the valves, also known as valve regurgitation. These defects can be corrected with surgery.
Conotruncal defects are malformations concerning the outflow tracts of the heart, the portion of the ventricles that connect to the great arteries. The most common conotruncal defect is Tetralogy of Fallot (TOF), a collection of 4 distinct malformations. As shown in Figure
5, TOF consists of a narrowing of the pulmonary valve, known as pulmonary stenosis, a
Figure 2.4: Complete Atrioventricular Septal Defe
http://www.childrensmn.org/ web/cardiovas/115292.asp secundums are not foramen ovales that failed to close after birth. Those defects, called patent
are further classified as partial, intermediate (or transitional), or complete depending mostly A partial AVSD is an ASD primum, described above as a defect in the anterior section of the atrial septum, either with or without a cleft located in the mitral valve. The transitional AVSD also has a minor defect in the ventricular
e AVSD has an ASD1, a VSD in the inlet, and abnormalities in the valves that separate the atria and ventricles. The combination of an ASD1 and a VSD in the ventricular inlet results in a large, centralized defect which causes shunting of the blood that disrupts volume and pressure in all 4 chambers of the heart, causing the heart to become enlarged
4). Due to abnormalities in the valves, blood can also flow “backwards” through the corrected with surgery.
Conotruncal defects are malformations concerning the outflow tracts of the heart, the portion of the ventricles that connect to the great arteries. The most common conotruncal
As shown in Figure 5, TOF consists of a narrowing of the pulmonary valve, known as pulmonary stenosis, a
: Complete Atrioventricular Septal Defect
29
thickening of the wall of the right ventricle, a displaced aorta that overlaps the right ventricle, and a VSD. The pulmonary stenosis restricts the amount of blood that can flow out of the right ventricle, causing this blood to go into the left ventricle and into the displaced aorta. In essence, the blood bypasses the pulmonary circulation and fails to become oxygenated. This leads to cyanosis. TOF requires surgical
correction. Transposition of the Great Arteries (TGA) is another common conotruncal defect where the placement of the aorta and the pulmonary artery are reversed, so oxygenated blood travels back and forth between the lungs and the heart, but is never pumped to the body tissues. TGA must be surgically corrected within the first few days of life. In a Double Outlet Right Ventricle (DORV) defect, the aorta is connected to the right ventricle, instead of the left ventricle. DORV defects always occur with a VSD, which allows some oxygenated blood to enter the aorta, but still limits the oxygenation of body tissues. Isolated VSDs of the outlet are also classified as conotruncal defects.
2.2.4.5 Right Ventricle Outflow Tract Obstructions (RVOTO)
This grouping contains defects which block or obstruct the boundary between the right ventricle and the pulmonary artery. The defect can occur in the pulmonary valve, the
supravalvar region, the upper part of the ventricle from which the pulmonary artery arises (the conus arteriousus), or in the pulmonary artery. Described above, valvular pulmonary stenosis (PVS), the narrowing of the pulmonary valve, is the most common RVOTO defect.
2.2.4.6 Left Ventricle Outflow Tract Obstructions (LVOTO)
Similar to RVOTOS, LVOTOS block or obstruct the movement of blood through the left ventricle into the aorta, potentially reducing the oxygenation of the body’s organs and tissues.
Figure 2.5: Tetralogy of Fallot
http://www.bluebabysyndrome.org/93
30
These defects occur in the aortic valve, or in the sub- or supravalvar region. The most common LVOTO is coarctation of the aorta, a narrowing of the aorta at the ductus arteriousus (the fetal structure which connected the pulmonary artery to the aorta to bypass pulmonary circulation). Severity of this defect depends upon where the narrowing occurs, before or after the ductus arteriousus. Hypoplastic left heart syndrome (HLHS) is a severe LVOTO defect where, because the ventricular region of the endocardial tube gets “pinched” during development, the left side of the heart is underdeveloped, including the aorta, the aortic valve, the left ventricle, and the mitral valve. This defect causes the right side of the heart to be overworked. Surgery is
eventually required or it results in heart failure. Similar to pulmonary stenosis, aortic stenosis is a narrowing of the aortic valve.
2.2.4.7 Ebstein’s
31 2.2.4.8 Patent Ductus Arteriousus
As described in a previous section, the ductus arteriousus is a fetal structure that allows the fetal circulation to bypass the lungs by connecting the pulmonary artery directly to the aorta. Once an infant is born and the lungs fill with air, pressure changes cause the ductus arteriousus to close, usually within the first few days. If it fails to close, the defect is known as patent ductus arteriousus (PDA) and, depending upon its size, can reduce the amount of blood that travels to the lungs to be oxygenated. PDA is more common among infants born preterm, and usually will close on its own within 2 years in these infants. Among term babies, a PDA that fails to close within a few days likely will require intervention if it causes symptoms.
Medications, such as a specific form of ibuprofen, can cause the PDA to close. Otherwise, catheterization and sometimes surgery are required. PDA that occurs in isolation in preterm babies is often excluded from structural defect studies, as it is hypothesized to be a result of being born preterm and not a developmental or structural defect in the heart.
2.2.4.9 Cardiac Looping
32 2.2.4.10 Heterotaxy
These defects arise as part of the failure during development to establish typical left-right differences in anatomy. For example, one defect in this grouping, dextrocardia, is when the heart is located in the right side of the thorax. The defects in this group are often complex, consisting of multiple malformations within the heart.
2.2.4.11 Abnormal Cell-growth Defects
Another grouping of rare defects, this group consists primarily of defects in the connections between the pulmonary veins and the left atrium. If all four pulmonary veins are connected somewhere besides the left atrium, the defect is referred to as total anomalous pulmonary venous return (TAPVR). If only some of the veins are connected into the wrong section of the heart, the defect is known as partial anomalous pulmonary venous return
(PAPVR). The result of this defect is a lack of oxygenated blood being distributed to the body.
2.2.4.12 Cardiomyopathy
Cardiomyopathy encompasses diseases of the muscle tissue in the heart. Because it is not a structural defect, even though it can be present at birth, it is often not included in studies of CHDs.
There are some individual defects and congenital heart diagnoses which do not fit into the above categories. These defects are either very rare, usually occur in the presence of other defects and have little clinical significance when present alone, or include diagnoses, such as arrhythmias or
aneurisms, that are not typically included in birth defect surveillance and research.
33
fall into these different categories tend to vary by study population. A recent review of metropolitan Atlanta’s birth defects surveillance system from 1968-2005 found that, within their system, the majority of infants with a cardiac birth defect (71.3%) had no other congenital anomalies, while 13.5% had both cardiac and non-cardiac defects.98 Approximately 13% of CHDs occurred in conjunction with either a chromosomal abnormality or a recognized syndrome of defects, while 2% occurred in the presence of laterality defects, when the left-right orientation of the body is disrupted.98 Additionally, previous population-based studies found that even among infants with only CHDs, approximately 22% have more than one defect present.97 It should be noted some phenotypes, such as Tetralogy of Fallot or
Hypoplastic Left Heart Syndrome, are classified as a single phenotype, even though they are a collection of different structural anomalies. These different levels of complexity must be addressed in research of CHDs, since the etiology of a single, CHD is probably not the same as the etiology of that same defect, if it is accompanied by multiple other cardiac and non-cardiac defects within an infant.
2.2.5 Risk Factors
Approximately 8-10% of all cases of CHDs are associated with a chromosomal abnormality.73 It is estimated that almost half of all children with Down syndrome, trisomy 21, have a CHD.99