A MEASUREMENT OF CHARTER SCHOOL EFFICIENCY IN NORTH CAROLINA UTILIZING MODIFIED QUADRIFORM ANALYSIS
Daniel C. Sturdevant
A dissertation submitted to the faculty at the University of North Carolina at Chapel Hill in partial fulfillment of the requirements for the degree of Doctor of Education
in the Educational Leadership program in the School of Education.
Chapel Hill 2017
ii
2017
iii
ABSTRACT
Daniel C. Sturdevant: A Measurement of Charter School Efficiency in North Carolina Utilizing Modified Quadriform Analysis
(Under the direction of Eric Houck)
iv
DEDICATION
To Christa, Elsa Claire, Dad, Mom, Gramma, and Poppa. Thank you for your love, support, encouragement, and examples. I am extraordinarily blessed to be in such good company,
and I love you all.
Christa, you are the best wife, mother, and partner I can imagine, and I never would have finished this without you.
Elsa Claire, I am so glad to be your Daddy. The hugs, kisses, and ‘I love yous’ were always exactly what I needed. I love you.
Dad and Mom, thank you for all you’ve done to push me, to hold my feet to the fire, and to support me. Dad, if not for you, I never would have been in education. Mom, you might be the
best listener I know, and it always helps!
Gramma and Poppa, thank you for always encouraging me and praying for me. Without Poppa always pushing me to go further, I’m not sure I would have ever thought about an Ed.D. I know
v
ACKNOWLEDGEMENTS
vi
TABLE OF CONTENTS
LIST OF TABLES ... ix
LIST OF FIGURES ... xi
CHAPTER 1: INTRODUCTION ...1
Background Information ...1
Statement of the Problem ...3
Significance of the Study ...3
Context of the Study ...4
Purpose of the Study ...5
Research Questions ...6
Hypothesis...6
Conceptual and Theoretical Framework ...7
Conceptual Framework ...7
Theoretical Framework ...8
Assumptions and Limitations ...9
Assumptions ...9
Limitations ...9
Definition of Important Terms ...10
CHAPTER 2: LITERATURE REVIEW ...11
Introduction to Early Efficiency Advocates and Implementation ...12
Cubberley and Taylor Usher in a Business Mindset ...12
Simon Patten: Efficiency as a Comparative Exercise ...13
ESEA, The Coleman Report, and A Nation at Risk: Efficiency as Allocation of Resources ...15
Eric A. Hanushek and Contemporaries: Efficiency in Production ...17
Charter Schools: History and Growth ...21
vii
Review of Charter School Performance ...31
Previous Charter School Efficiency Studies ...37
Overview of Funding in Charter Schools ...38
NC Charter Schools Legislation ...39
NC Charter Schools ...39
Framework for Interpretation ...42
Efficiency Measurement Techniques in Education ...44
Modified Quadriform Analysis ...47
Conclusion ...50
CHAPTER 3: DATA AND METHODS ...51
Purpose of the Study ...51
Theoretical and Conceptual Framework ...52
Conceptual ...52
Theoretical ...52
Research Questions ...53
Hypothesis...54
Design of Study...55
Control for Statistical and/or Rival Hypothesis ...56
Statistical and Analytical Procedure: The Modified Quadriform ...56
Procedures ...60
Data Selection Criteria and Process ...61
Conclusion ...63
CHAPTER 4: FINDINGS AND ANALYSIS ...65
Introduction ...65
Obtaining Input and Output Residuals ...65
Holding Schools Harmless ...70
viii
Summary of Findings ...85
CHAPTER 5: DISCUSSION AND CONCLUSIONS ...86
Introduction ...86
Answering the Research Questions ...87
1) Can the Modified Quadriform Be Used to Evaluate the Relative Efficiency of Charter Schools? 2) How Economically Efficient are Charter Schools in North Carolina, in terms of Financial Inputs vs. Academic Outputs? 3) What Alterable Characteristics Contribute to the Relative Efficiency/Inefficiency Of Charter Schools in North Carolina? 4) Is the Modified Quadriform Analysis a Potentially Beneficial Means of Evaluating Charter School Efficiency? Guidance Counselors ...94
Summary: What Matters? ...96
Limitations ...100
Limitations from Chapter 1 ...101
Additional Limitations ...101
Policy Considerations ...102
Increased Access to Information ...102
Further Research Considerations ...103
Critical Race Theory ...103
Using the MQA to Identify Trends ...103
Directions for Further Research ...103
Conclusions ...104
Appendix A ...106
LIST OF TABLES Table 2.1: Mean and Median PPE in North Carolina TPS and
Charter Schools 2012-2013...42
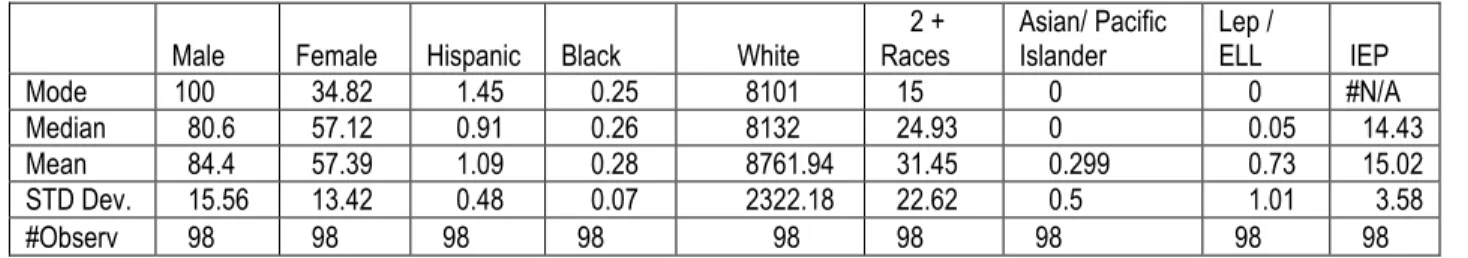
Table 3.1: Descriptive Statistics of Variables Regressed ...63
Table 3.2: Descriptive Statistics of Variables Regressed ...63
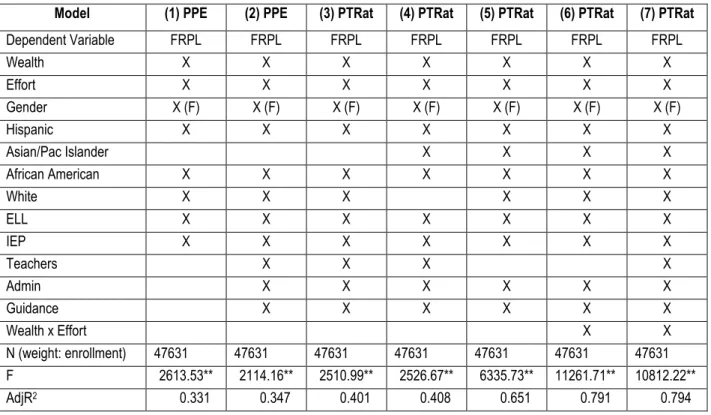
Table 4.1: Models Used for Predicting Resources in NC Charter Schools ...66
Table 4.2: Models Used for Predicting Performance in NC Charter Schools ...67
Table 4.3: Descriptive Statistics of Regression Residuals ...68
Table 4.4: Previous Study Hold-Harmless Cross Sizes ...71
Table 4.5: Population of Each Quadrant at Various Sizes of Hold-Harmless Cross ...73
Table 4.6: Quadrant Residual Averages by Mean and Median ...74
Table 4.7: 0.1 Std Dev Hold-Harmless Cross Analysis and Quadrant Mean Values ...75
Table 4.8: 0.1 Std Dev Hold-Harmless Cross Analysis and Quadrant Mean Values ...76
Table 4.9: 0.1 Std Dev Efficient vs. Inefficient Quadrants ...77
Table 4.10: 0.1 Std Dev Effective vs. Ineffective Quadrants ...78
Table 4.11: 0.1 Std Dev Efficient + Effective vs. Inefficient + Ineffective Quadrants ...79
Table 4.12: 0.5 Std Dev Efficient vs. Inefficient Quadrants ...80
Table 4.13: 0.5 Std Dev Effective vs. Ineffective Quadrants ...81
Table 4.14: 0.5 Std Dev Efficient + Effective vs. Inefficient + Ineffective Quardrants ...82
Table 4.15: Staffing Levels at 0.0 Hold-Harmless Level ...83
Table 4.16: Staffing Levels at 0.1 Hold-Harmless Level ...83
Table 4.17: Staffing Levels at 0.5 Hold-Harmless Level ...84
x
Table 4.19: Avg. Number of Administrators Per School Across Quadrants ...85
Table 5.1: Population of Each Quadrant at Various Sizes of Hold-Harmless Cross ...90
Table 5.2: Comparison of Quadrant Percentages Across Studies ...91
Table 5.3: 0.5 Std Dev Efficient vs. Inefficient Quadrants ...92
Table 5.4: 0.1 Std Dev Efficient vs. Inefficient Quadrants ...93
Table 5.5: Avg. Number of Guidance Counselors Per School Across Quadrants ...94
Table 5.6: Avg. Community Wealth Averages at 0.5 by Quadrant ...95
xi
LIST OF FIGURES
Figure 1.1: The Modified Quadriform ...9
Figure 2.1: Per Pupil Expenditures from 1965-2012 ...19
Figure 2.2: Growth in Charter Schools from 2000-2014 ...22
Figure 2.3: Growth in Charter School Enrollment from 2000-2014 ...23
Figure 2.4: Graphical Representation of Charter School Reading and Math Gains/Losses Relative to TPS Market ...33
Figure 2.5: The Modified Quadriform with Quadrant Definitions ...48
Figure 3.1: The Modified Quadriform ...53
Figure 3.2: Experimental Design ...55
Figure 3.3: The Modified Quadriform with Quadrant Defintions ...58
Figure 4.1: PerfComp and PTRat Residuals Plotted ...69
Figure 4.2: Residuals Plotted with Quadriform Overlaid at Median Values ...70
Figure 4.3: 0.1 Standard Deviation of the Median Quadriform ...72
Figure 4.4: 0.5 Standard Deviation of the Median Quadriform ...73
CHAPTER 1: INTRODUCTION Background Information
Charter schools are broadly defined and vary significantly from state to state, but basically, they “are privately managed, taxpayer-funded schools exempted from some rules applicable to all other taxpayer-funded schools” (www.nea.com). In 1988, Albert Shanker (then president of the American Federation of Teachers) suggested a school model “where teachers could experiment with fresh and innovative” curriculum and where they would have a greater say in the formation and function of the institutional model (Kahlenberg & Potter, 2014). The first such school opened in Minnesota in 1992, after the state adopted the first charter law in 1991. In 1994, the federal government revised the Elementary and Secondary Education Act (ESEA) (1965) to include a charter school option:
The Charter Schools Program (CSP) was authorized in October 1994, under Title X, Part C of the Elementary and Secondary Education Act of 1965 (ESEA), as amended, 20 U.S.C. 8061-8067. The program was amended in October 1998 by the Charter School Expansion Act of 1998 and in January 2001 by the No Child Left Behind Act of 2001. The program, which provides support for the planning, program design, and initial implementation of charter schools, is intended to enhance parent and student choices among public schools and give more students the opportunity to learn to challenging standards. Enhancement of parent and student choices will result in higher student achievement, however, only if sufficiently diverse and high-quality choices, and genuine opportunities to take advantage of those choices, are available to all students. Every student should have an equal opportunity to attend a charter school (U.S. Department of Education, 2004).
even though the standard of “an equal opportunity to attend a charter school” has not been met (NCLB guideline, 2001).
In the 25 years since their inception, charter schools have proliferated across the country. While the percentage of students served has increased steadily, issues such as faculty turnover, which is higher than traditional schools (Stuit & Smith, 2010), and lower rates of ethnic and economic diversity have plagued them (Podgursky & Ballou, 2001). Performance data (usually defined by standardized test scores) have shown some variation between traditional school models and charters, but on average the difference is nominal (Kahlenberg & Potter, 2014).
Charter schools are often associated with efficiency (Gronberg et al., 2012; Grasskopf et al., 2009) among other traits. The association with efficiency is a benefit to the charter school movement and is a difficult outcome to measure accurately because charter schools have widely differing models of instruction, hiring practices, and targeted student populations. Charter schools are independent operators within the school system, and are not subjected to customary comparisons and rankings as often as traditional public schools, which makes a study of their relative efficiency important and uncommon. Less oversight and accountability for results makes a study of their relative efficiency important and uncommon. A need within the academy of education finance research is a reliable and repeatable methodology for measuring the efficiency of charter schools. This study seeks to provide this methodology to examine and measure relative efficiency among charter schools in North Carolina.
3
Statement of the Problem
Charter schools exist under the umbrella of public education, but are not subject to the same level of public oversight or accountability as traditional public schools in North Carolina and many other states (BiFulco& Ladd, 2006; Bettinger, 2004). In addition, academic success is not the explicit mission of all charter schools. Many serve populations that are underrepresented in traditional public schools, while others serve populations that are by-and-large affluent and well represented in traditional public schools. Thus, there is a lack of easily accessible efficiency data on charter schools. The aim of this study was not to establish a normative efficiency
measure or scale, but rather to assess relative efficiency within the population of charter schools in North Carolina and to establish their rankings in context with one another, so that school programs and policies may be assessed to see which contribute most to efficiency.
Significance of the Study
4
and thereby which programs and policies are most effective, so that better educational decisions can be made statewide.
Context of the Study
In 2011, the NCGA voted to remove the cap on charter schools, which had been set at 100. In 2014 alone, 26 new charters for schools were awarded (Khrais, 2014). As of the 2016-2017 school year, there were 167 brick-and-mortar charter schools and two virtual charters in North Carolina. In 2014-2015, those 169 schools served 57,926 students out of a total of 1.5 million, or just under 4% of the public school students in North Carolina (NC DPI, 2014).
In North Carolina, the General Assembly controls education policy, and has embraced charter schools as a means to:
Improve student learning; Encourage the use of different and innovative teaching
methods; Provide parents and students with expanded choices in the types of educational opportunities that are available within the public-school system; and Increase learning opportunities for all students, with special emphasis on expanded learning experiences for students who are identified as at risk of academic failure or academically gifted. (§NCGS 115C-218)
The movement is based on the desire of parents and voters for improved access to various educational models, to raise the bar for both the lowest and the highest achieving populations, and to encourage innovation within the teaching profession (§NCGS 115C-218).
5
modified quadriform meets a need to understand the range of charter school performances by examining relative efficiency. Understanding efficiency in context allows researchers to identify particularly high- and low-performing schools, isolate effective practices, and determine if the schools within each quadrant have any common characteristics.
Modified quadriform analysis has been applied to large school districts (Stephens, 2006; Houck et al., 2010) and in statewide situations with positive results, and has enjoyed increasing usage since its first appearance (Anderson, 1996). Until now, it has not been applied to charter schools.
Purpose of the Study
The purpose of this study was to explore charter schools in North Carolina from the perspective of relative economic efficiency in order to understand the range of charter schools’ return on investment. This information would allow researchers to identify particularly high- and low-performing schools, isolate effective practices, and determine if these categories of schools have characteristics in common. The study analyzed academic outcomes in the context of economic inputs to determine relative charter school efficiency. To determine relative efficiency, the modified quadriform was applied to the error results of a multivariable statistical analysis, and was utilized to establish quadrants of relative efficiency among charter schools in North Carolina. This study was also a proof of concept, as the modified quadriform has never been used exclusively to analyze charter schools. After a baseline of relative efficiency is established, the schools within each quadrant were analyzed to determine which alterable characteristics may have affected academic outputs. The study sought to establish a model for further investigation of charter schools using the modified quadriform.
6
thoroughly examine the model that utilizes public money with the least oversight, i.e., charter schools. For purposes of this study, academic achievement was the dependent variable, and for lack of a more ubiquitous alternative, that was defined by the performance composite of the North Carolina Accountability Program, or ABCs.
Research Questions
The primary research questions of this study are:
1) Can the modified quadriform be used to evaluate the relative efficiency of charter schools? (A positive outcome would be measured by high Adj-r2 values and similar quadrant distributions as shown in other studies.)
2) How economically efficient are charter schools in North Carolina in terms of financial inputs vs. academic outputs?
3) What alterable characteristics contribute to the relative efficiency/inefficiency of charter schools in North Carolina?
4) Is the modified quadriform analysis a potentially beneficial means of evaluating charter school efficiency?
Hypothesis
7
Previous national studies find a wide range of charter school performances, mediated by factors such as race and socio-economic status (SES). I hypothesize that schools with relatively low racial diversity and high SES will be associated with greater efficiency and show sensitivity to these variables that is like traditional public schools (Alexander et al., 1994; Bali & Alvarez, 2004). charter Many North Carolina charter schools are relatively new entities, and there is a learning curve before optimal efficiency is reached. Thus, in all probability the schools in this study will fall mostly into inefficient or ineffective quadrants. In the interest of full disclosure, the author did wield some influence on the numbers (based upon the size of the “hold-harmless” area selected, which are discussed in chapters 3 and 4 in detail), but he endeavored to follow best practices established by previous study authors: Hickrod (1989,1994), Anderson (1996), Rolle (2004), Rolle, Houck, and He (2010) and others.
Conceptual and Theoretical Framework Conceptual Framework
Springer, Houck, and Guthrie in Handbook of Research in Education Finance and Policy
(Ladd & Fiske, 2013)establish a set of three modern public values of education finance policy: equity, efficiency, and liberty. While the pursuit of any of the three by itself is worthwhile, doing so may impede the ability of the remaining two to be realized effectively. Each value exists in tension, but also contains its own, separate line of inquiry. Guthrie and Wong (2013) give the pursuit of efficiency high value, especially as it pertains to schools, but if it becomes the primary goal, it may severely restrict liberty and equality, and diminish the overall product. As school budgets are resource constrained, efficiency is always a factor in evaluations and
8
This study seeks to examine the value of efficiency, and its associated line of inquiry, as it pertains to charter schools in North Carolina.
Theoretical Framework
Schools are complex and distinct institutions, and not all of them hold the same primary and secondary values/goals within their communities, and especially across communities and states, making a standard measure difficult. Previous efficiency research focuses on the input/output relationship, and determines technical efficiency based on units of production (Hanushek 1997, 2007; Bifulco, 2001). This study chooses instead to focus on relative efficiency through implementation of the modified quadriform. The modified quadriform assesses the efficiency of schools relative to one another rather than an objective standard of technical efficiency.
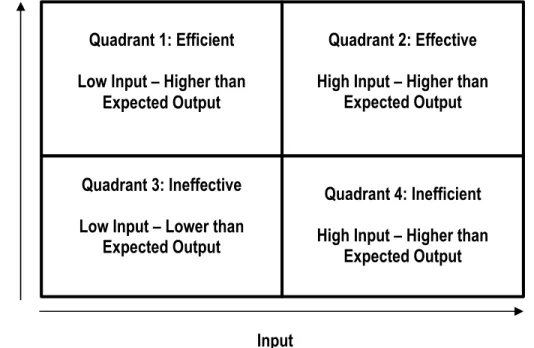
Houck, Rolle, and He (2010) specified the advantages of the modified quadriform as follows:
A quadriform is an abstract tool devised to allow relative relationships between inputs and outputs to be viewed both graphically and quantitatively. By comparing residuals of input and output oriented regression equations, the quadriform contextualizes
performance into a relative rather than an absolute framework.
9
Figure 1.1: The Modified Quadriform
Inefficient Effective
Ineffective Efficient
Assumptions and Limitations Assumptions
1. By conforming to §NCGS 115C-218, it was assumed that all charter schools have common purposes that define how they operate. As such, academic performance would be a priority.
2. It was assumed that the per-pupil expenditures (PPE) were accurate and did not reflect any significant unreported expenditures or significant in-kind gifts of services or materials to the institution that would skew the results.
3. It was assumed that the composite performance score of the NC ABCs wasa valid measure of student achievement and accurately reflected institutional policies and practices.
Limitations
1. This was a one-year, proof-of-concept study, and does not afford the clarity of data trends or student growth/regression of a longitudinal study.
10
Definition of Terms
Alterable school characteristics: school variables that are more open to change such as teacher-to-student ratios, teacher salaries, and the amount of funding allotted for various programs (Anderson, 1996; Stevens, 2007).
Educational efficiency: the optimal use of educational resources, which results in student achievement (Anderson, 1996; Stevens, 2007).
Modified quadriform: The modified quadriform interprets the input-output relationship of selected variables in two separate linear regressions to delineate efficient and inefficient school districts. The model then uses discriminant analysis to distinguish what alterable school
characteristics differ between the efficient and inefficient schools (Anderson, 1996; Stevens, 2007).
Production function research: identifying patterns and relationships of inputs and outputs (Anderson, 1996; Stevens, 2007).
Student achievement: School performance composite scores on the 2012 North Carolina ABCs (Accountability Program).
Unalterable school characteristics: Demographics of students and schools that school officials have little control over such as total district enrollment, percentage of economically
11
CHAPTER 2: LITERATURE REVIEW
This chapter reviews the history of efficiency studies in education and examines two prominent movements within education finance research: cost-benefit analysis and the “does money matter” research movement. Subsequently, the chapter examines the literature concerning the establishment of charter schools and previous studies of their efficiency and performance. The review incorporates literature and research relevant to specifics of the charter school movement both nationally and in North Carolina. The chapter concludes with a summary of available school efficiency techniques, including both the modified quadriform and other techniques not selected for this study.
12
rather how it matters. Through specification of a quadrant and a secondary discriminant analysis, the modified quadriform highlights how money is spent, putting the focus upon allocation rather than amount, at least in financial terms.
The structure of the literature review was informed by both the nature of this study and of charter schools and their structures and goals. First, this study sought to measure relative
efficiency within the charter school sector. To do so, calls for a discussion of efficiency measures within education and charters themselves. Second, the charter school movement is linked to higher efficiency and is designed to secure efficient educational outputs. Thus, investigations of charter school development, efficiency and outcome studies, and funding mechanisms for both traditional public schools and charter schools are germane and important.
Introduction to Early Efficiency Advocates and Implementation Cubberley and Taylor Usher in a Business Mindset
Early efforts at educational efficiency were based on a factory model of production efficiency; the more prepared and satisfactorily achieving students a school produced with the least financial input, the better. Born out of efforts to improve factory production as the United States approached the end of the second industrial revolution, the gray areas of education— different learning styles, paces, or even demographics of the students and teachers—were not considered. Human capital was treated the same as financial or material capital in the process of analysis (Callahan, 1962).
13
population to become professional managers, not trained specifically in a trade, but in the
practice of managing others. Despite the vast differences between manufacturing and education, in 1911 the National Education Association (NEA) endorsed the principles of scientific
management for management of educational systems (Miller, 2002). The educational-industrial management connection had not been made in scholarship, and it was a watershed moment for the practice (Callahan, 1962).
After Taylor introduced scientific management principles to the world, the question of “how is efficiency measured” was widely asked. To complicate matters, the answer is highly industry specific, and the measure can vary from an analysis of the employee (a teacher in this case) to an analysis of the product (a student) or nearly anywhere in between. Taylor’s ideas are the bedrock of modern efficiency studies, but his influence is diminished in times of public plenty (Ibid). However, when a recession or depression strikes, Taylor’s principles come roaring back into the political, economic, and educational discourse; efficiency becomes the pre-eminent social value, at least temporarily.
In Stretching the School Dollar, Hess and Osberg (2010, p. 2) argue that recessions, like the 2008 financial downturn in the United States, create a climate in which district leaders ask how schools can “boost efficiency and promote reform?” The result is the conspicuous
conclusion that reforms can often be cost-saving measures that are designed to lessen the budget without harming overall student performance on standardized measures. Examples include: limiting sports, cancelling arts, and refraining from new textbook purchases.
Simon Patten: Efficiency as a Comparative Exercise
14
administrators, however, had a subjective product under significant scrutiny, and not always with consistent expectations and standards. Researchers and practitioners searching for a measure decided on standardized testing as the solution for efficiency measurement in education (Callahan, 1962).
Thus, the drive toward efficiency increased the use of standardized testing. As Taylor’s ideas spread, the public focus shifted to increases in profit and output, and teachers and
administrators came under fire. In May of 1911, Simon Patten wrote in the Educational Review
that “the advocate of pure water or clean streets shows by how much the death rate will be altered by each proposed addition to his share of the budget… only the teacher is without such figures” (Ibid.). Patten contended that public school systems unable to show their merit in measurable ways should not be funded over other public entities that could. Ultimately, he argued that schools could only answer his challenge by showing results that could be “readily seen and measured” (Ibid). Patten fed the fire of “reform” in schools and created a climate in which critics of education were equipped to demand reforms that created unnecessary and illogical burdens of proof—especially in the humanities. As a result, instructional time was replaced with testing, and a factory efficiency approach was implemented in a non-industrial endeavor.
15
(Ibid) was established, and gender exclusivity notwithstanding, it was a prestigious membership counted among the national council of superintendents. The suggestions from this group were not strictly limited to testing, however, and ranged into teacher conduct and preparation. Teachers, the committee asserted, “should have a well-stocked satchel [with paper and pencils, etc.] and carry it from room to room in case it is needed.” (Ibid). Additionally, basic classroom tasks were measured for efficiency, such as taking up and passing out papers and tests, and these menial tasks were graded and timed.
ESEA, The Coleman Report, and A Nation at Risk: Efficiency as Allocation of Resources
After the launch of the Soviet satellite Sputnik, the U.S. government became concerned that its education system had not produced scientists capable of winning the space race, and several studies were commissioned to see what could be done about it. Contextualized by the space race, arms race, and the myriad crises of the 1960s, the first publication to come out of the studies, the Coleman Report (1966), created widespread concern regarding public education in the United States (Rolle, 2004; Standerfer, 2006).
16
specific, state-to-state comparisons. However, by the end of the 1970s, the ESEA reforms had not closed the achievement gap as hoped (Standerfer, 2006).
In 1966, James Coleman and his team of researchers, commissioned by the Civil Rights Act of 1964, published the eponymously titled report, Equality of Educational Opportunity, and caused national alarm. The 746 pages detailed an alarming lack of quality and equality within the U.S. public school system. While the report did not immediately generate concerns about efficiency, it did bring about significant change in equity and access within the school system. Less than half a decade later, Swann v. Mecklenberg County (1971) was decided in the U.S. Supreme Court; it mandated busing to integrate schools, especially across the South, the region where Coleman’s statistics showed the most egregious inequities.
The mass of data collected by Coleman and his colleagues allowed them to draw conclusions that were previously not possible, some related to efficiency. Per Gary Burtless (1996), Coleman’s investigation revealed that the differences among resources available to black and white students were smaller than supposed in several areas, and in most other measurable statistics. The resulting sea change throughout public schools created a new urgency to measure efficiency, as per-pupil expenditures were far more racially diverse than previously thought.
17
the reports’ findings of failing schools and American students falling behind the rest of the world sent the message that increased spending was not the solution (Standerfer, 2006).
Another effect of the findings reported in A Nation at Risk was the expansion of NAEP testing and an increase in comparisons. Secretary of Education William J. Bennett hired the Alexander-James group to study and make recommendations on how the NAEP could be utilized to increase accountability through comparisons. Shortly thereafter, under the leadership of President George H.W. Bush, national content standards were created for each core subject (Standerfer, 2006). President Bill Clinton continued the trend with the Goals 2000 legislation and a reauthorization of ESEA under the new name of “Improving America’s Schools Act.” This act mandated that states must create standards in core subjects that will be assessed (Standerfer, 2006).
Eric A. Hanushek and Contemporaries: Efficiency in Production
Building upon the national attention garnered by A Nation at Risk, Eric A. Hanushek (1986) argued in The Journal of Economic Literature that there is no statistically significant link between student outcomes and district expenditures. As an economist, Hanuskek’s view was relatively new, and created a sub-field of inquiry among his economist peers. His work was well regarded among economists, and remains the prevailing view among those who study education finance (Burtless, 1996). Augmenting his research was a study by Chubb and Hanuskek (1990), that detailed the rise in expenditures beginning in the Johnson Administration and the
18
However, it is worth noting that following the 1983 publication of A Nation at Risk, the direction of student achievement changed, and by the latter part of the 1980s. It remains true, however, that since the 1960s, the United States has fared significantly worse than it once did on all international achievement tests in comparison to other nations (Burtless, 1996). There are several reasons this may be true. First, it may be that the United States was the first nation to invest significant sums of money into education and it enjoyed an initial jump in quality that has been since matched (or approached) by other nations over time. Second, the United States has experienced significant population growth since 1960, the year that marked a peak population growth rate internationally. Most other nations have not experienced this rate of growth, making educational development a smaller scale project (Ortiz-Ospina & Roser, 2016). Greenwald and Hedges (1996) say that the drop may not, in fact, be as precipitous as it first appears, and could be attributed to changes in the student population demographics. They contend thatthe addition of many different kinds of students, such as English Language Learners (ELL) and Exceptional Children (EC) as the result of court cases throughout the 60s and 70s focusing on access, put increased demands on the education system.
Most relevant to this investigation, however, was a conclusion from Hanushek’s 1996 article School Resources and Student Performance in which he argued that spending money on education is a reasonable and expected cost, but it is worth investigating as “the existing
evidence simply indicates that the typical school system today does not use resources well.” The amount of money spent on education (especially in the wake of A Nation at Risk) increased dramatically and significantly outpaced academic gains.
19
(2010) the rate of per-pupil spending (even when adjusted for inflation) rose in nearly every year since Taylor’s publication in 1911. The rate of spending did not dramatically change salaries (ironically, as that is what Taylor would likely have advocated), but it did dramatically increase both instructional and support staff and technology in schools. As a result of the focus on school finance, the drive for student performance, and the desire for a good return on investments, education has become one of the largest expenditures of all levels of government in the United States. Per-pupil-expenditure (PPE) has increased four-fold since 1966 (see Figure 2.2). Figure 2.1: Per Pupil Expenditures in 1965-2012
SOURCE: U.S. Department of Education, National Center for Education Statistics, Biennial Survey of Education in the United States, 1919-20 through 1955-56; Statistics of State School Systems, 1957-58 through 1969-70; Revenues and Expenditures for Public Elementary and Secondary Education, 1970-71 through 1986-87; and Common Core of Data (CCD), "National Public Education Financial Survey," 1987-88 through 2012-13. (This table was prepared September 2015.)
0 2,000 4,000 6,000 8,000 10,000 12,000 14,000 16,000 P e r-P u p il E x p e n d it u re i n D o ll a rs School Year
20
In 2004, when Rolle asked if money mattered, he qualified the question by considering and defining “technical efficiency” and “allocative efficiency.”
Technical efficiency is achieved when either (a) output levels cannot be maintained with lesser amounts of inputs or (b) output levels cannot be increased while holding inputs constant. Allocative efficiency is achieved when all input resources are exhausted while producing any amount of output. In other words, an entire education budget is spent in an attempt to deliver as many desired services as possible. (Rolle, 2004)
He goes on to assert that while there are many education finance research studies, most of them concern the study of inputs and the effect they have on outputs and/or educational production outcomes. This discussion introduced the two conclusions that have been reached by most researchers:
• Money Does Not Matter. There is no economically efficient relationship between educational expenditures and outcomes.
• Money Does Matter. There is an economically efficient relationship between educational expenditures and outcomes.
In arguing that “Money Does Not Matter,” Rolle utilized a review of Coleman (1966), Jenks (1972), and related state and federal level budgetary decisions, to build a context for the debate. He included the efforts of A Nation at Risk at refocusing the debate on the economic
consequences of low-performing schools, and the formation of a conservative coalition to
increase spending to achieve better results. These efforts were ultimately tempered by Hanushek (1995, 1996), who asserted that the only correlation between school expenditures and student success came through years of teacher experience, and that hiring and retaining long-term teachers was the way forward.
21
Odden (1986), Murphy and Hallinger (1986), and Rossmiller (1987), Rolle argued that the focus on production-function relationships between funding and outcomes was myopic, and that additional funds would improve educational output (Rolle, 2004). Rolle went on to include Laine, Greenwald, and Hedges’s (1994) re-analysis of Hanushek’s (1981) meta-analysis, and found that more funding did in fact increase educational outputs, and scholars who based their analyses on Hanushek’s conclusions should be cautious. Rolle concluded t with a reference to Cooper (1993, 1994) reminding readers that a true production-function for education is yet to be discovered, and the way schools use their resources is essential to understanding the relationship.
He goes on to investigate several methods of assessing efficiency, and concludes that legislative goals, oversight mechanisms, and policies are more affective of educational efficiency than money (in this case PPE). Rolle offered his thoughts on future directions for educational productivity research, highlighting public choice approaches, the modified quadriform analysis, and data envelopment analysis. It is worth noting that since Rolle concluded that money does not matter as much as legislative oversight in achieving efficiency, charter schools (which are relatively free from oversight) should be especially efficient, and the places where programs, policies, and curriculum best foster efficiency.
Charter Schools: History and Growth
There have been forms of publicly funded education in the United States since the Puritans founded Boston, but charter schools are less than a generation old. Entering the
22
A charter school is an institutional paradigm that was established by two schools in 1992 in St. Paul Minnesota (Bettinger, 2004). Since then, the growth of the charter model has been phenomenal. By 2001, less than a decade after the inception of the paradigm, there were nearly 2,400 charter schools operating in 34 states (NCES, 2016). In 2017, 43 states and the District of Columbia had charter school laws on the books, and the number of schools has grown to nearly 7,000, with more coming in the next year. Charter schools have enjoyed significant growth, by almost 400 schools, even as the number of traditional public schools fell by nearly 200 in 2012-2014 alone.
Figure 2.2: Growth of Charter Schools in 2000-2014
0 2,000 4,000 6,000 8,000 10,000 12,000 14,000
1990-91 2000-01 2003-04 2007-08 2008-09 2009-10 2010-11 2011-12 2012-13 2013-14
Charter School Growth by Institution
All charter schools Year
Secondary Combined grade level schools
23
Figure 2.3: Growth in Charter School Enrollment in 2000-2014
Source: NCES, https://nces.ed.gov/programs/digest/d15/tables/dt15_216.20.asp Charter schools exist in several different models—not-for-profit, for-profit,
independently managed, or managed by an Education Service Provider. Different states allow for all of these forms or a combination of forms, and several policy groups (pro-charter and anti-charter) rank states based on their charter school laws. National Alliance for Public Charter Schools is one such policy group and has an extensive report card system available online at http://www.publiccharters.org/get-the-facts/law-database/states/NC.
Many charter initiatives involve considerable political maneuvering (Bettinger 2004). The state of Michigan provides a relevant example of an early and large-scale adopter of charter schools (heavily influenced by U.S. Secretary of Education Betsy DeVos). A central focus of Michigan’s charter school initiative, and one that added legitimacy as well as volume, was to encourage the creation of 150 charter schools that would be sponsored by state colleges and universities, regardless of geographic proximity. Of the 150 university-sponsored charter
0 200,000 400,000 600,000 800,000 1,000,000 1,200,000 1,400,000
2000-01 2003-04 2007-08 2008-09 2009-10 2010-2011 2011-2012 2012-13 2013-14
Charter School Enrollment 2000-2014
24
schools, all were approved by the 10 state universities’ boards of trustees. This allowed then Governor John Engler, who approves all appointments to these boards, to politicize the process. Driving the point home, in 1998, Eastern Michigan University announced it would not sponsor any charter schools, and shortly thereafter was informed that the state legislature proposed cuts to its budget. EMU trustees reversed their position, and the cuts never came (Bettinger, 2004). Soon after, most universities abandoned attempts to keep charter schools in close geographic proximity, opting to open as many as possible as quickly as possible, to respond to existing and increasing political pressure.
In Michigan, home to some of the most flexible charter school laws in the nation (Bettinger, 2004), 170 charter schools opened within the first five years of eligibility (1994-1999), and accounted for 3% of all student enrollment in the state by 1999. Any non-religious group in Michigan can apply for a charter, “including existing public and private schools.” To gain approval, a charter is required to establish academic goals for the next seven years. However, in the first seven years of the charter school program, only two of nearly 200 schools were closed for failure to meet their goals.
25
persuasion are utilizing the physical space of former public schools that were failing, and then ‘privatized’ to create charter schools. In all, New York requires five separate entities (three state and two federal) to give input on the status of a charter school’s actual charter to operate, and a charter is good for three to five years. Charters can be revoked for misconduct or failing performance.
The success of the NYC schools is debatable, and there is a significant amount of information publicly available. The New York City Charter School Center (NYCCSC) is a repository, on the pro-charter side. The center publishes extensive information on its website (http://www.nyccharterschools.org) and offers explanations about many common concerns such as governance, accreditation, and fiduciary oversight. The website also touts significant gains for charter students over their public counterparts in math and reading, converting the gains into a unit of “additional school days” (ASD) worth of instruction. The NYCCSC assertion of increased performance is backed by the most recent report from the Center for Research on Education Outcomes (CREDO) at Stanford University. In a March 2015 report, charter students, particularly in urban areas, were found to be gaining ASDs over their public school peers, and the relative gap in performance has increased of late (CREDO, 2015). This allows for the argument that the longer charter schools are in existence, the better they respond to the market, become more effective, and raise achievement levels.
Renzulli and Evans (2005) clarify the basic arguments both for and against charters: Although they are public and secular, they elude the bureaucratic constraints of school districts, thereby evoking controversy. Proponents argue that charter schools
26
problems, and, if anything, are instruments of elitism and deplete public school resources (Alexander, 1997; Berliner and Biddle, 1995; Cobb and Glass, 1999.) This is the primary tension and question of charter schools. Do they improve performance, demand efficiency, and benefit the most vulnerable student populations, or do they promote elitism, detract from educational opportunities and resources, and further inhibit the education of the most vulnerable students in schools? While diversity, equity, and access are well studied, the primary investigation here is the existing tension within charter schools over student
performance, measured in efficiency, an area in which charters are thought to excel.
However, measuring efficiency in charter schools presented several challenges, as some schools are focused on specific areas related to their mission (or actual charter); their level of funding from state and Local Educational Administrations; their external fundraising (often more elaborate and “compulsory” than traditional public schools); and a lack of auxiliary programs found in traditional public schools such as athletics, special education, facilities for physically disabled students, and transportation services, which naturally skews the applicant pool (Ladd & Fiske, 2013; [Bifulco & Bulkley 2007]).
Politics and the Growth of Charter Schools
27
public educational funds to be directed to the school (public, independent, parochial or secular) at the discretion of the students and/or the students’ parents. Additionally, viewing education as a commodity in a marketplace allows for isolation of the social values previously mentioned, and the elevation/descent of each per “market forces,” allowing for any of the three (in charter
schools, most often it is efficiency) to rise to the top of the proverbial heap.
Friedman’s work created national interest and momentum toward voucher programs, but more importantly, it expanded a national conversation that has since produced the Coleman Report(s), A Nation at Risk, and has influenced in obvious and subtle ways policies such as as No Child Left Behind and Race to the Top. Friedman’s work also changed the literal terms of discussion surrounding education policy; scholarship such as Arthur Okun’s (1976) economic efficiency tradeoff argument became directly applicable to the education system discussion and influenced policy and funding decisions.
Efficiency in schools had been inextricably tied to market economics beginning with Adam Smith (efficiency = profit). Increasingly, efficiency, which is becoming synonymous with innovation, is now the end goal. A major consequence of this shift in focus is the growing trend of deregulation as an educational reform, the tension it creates between advocates for
deregulation and those who favor traditional organizational models, and the difficulties and inequalities created when public money is used to pay tuition at independent, parochial, or charter schools outside the purview of LEAs.
28
metric is used to determine performance? Is the hoped-for outcome measurable; is it short-term, longitudinal, individual, corporate, or specific to one demographic? What is the baseline? Can it be a true “apples-to-apples” comparison?
David Hursh (2007) argued that the impetus for the growing trend of deregulatory reform in public education is the result of an increasingly globalized world, the need for American students to remain competitive, and the idea that deregulation and unrestricted market forces (like Alan Greenspan’s economic policy of the 1990s and 2000s) would benefit everything in the public sector—education included. The fear of American students being underprepared was, and is, very real, and has been spread by influential deregulation advocates such as Friedman.
Friedman’s influence through his regular column in TheNew York Times and multiple best sellers including The World is Flat (2005), and Hot, Flat and Crowded (2008)is seen in the millions of copies sold around the world. He sums up his view of the issue of American education in a 2005 column for The New York Times as follows:
We need to get going immediately. It takes 15 years to train a good engineer, because, ladies and gentlemen, this really is rocket science. So, parents, throw away the Game Boy, turn off the television and get your kids to work. There is no sugar-coating this: in a flat world, every individual is going to have to run a little faster if he or she wants to advance his or her standard of living. When I was growing up, my parents used to say to me, "Tom, finish your dinner—people in China are starving." But after sailing to the edges of the flat world for a year, I am now telling my own daughters, "Girls, finish your homework—people in China and India are starving for your jobs."
I repeat, this is not a test. This is the beginning of a crisis that won't remain quiet for long. And as the Stanford economist Paul Romer so rightly says, "A crisis is a terrible thing to waste."
He was concerned that the generation coming of age in the developing world, armed with only
an internet connection, could disrupt our entire economy and steal our children’s, and our own,
jobs. He offered little instruction on how to achieve this improved education, other than working
29
However, Friedman did not need to offer much direction, as the ball was already rolling
in a specific direction. The 1997 report, Public and Private Schools: How Do They Differ?—
commissioned by then U.S. Department of Education Secretary Richard Riley and written by
Susan Choy—offered the following insight to educational reform:
Because private schools are often perceived to be more successful in teaching students, with at least some empirical basis,many reform proposals for public schools have looked to the private sector for models to emulate. School choice, small schools, and
decentralized decision making, for example, are among the features commonly associated with private education that many have suggested might benefit public schools. (Choy, 1997, p. 1)
What is immediately evident is that the reforms mentioned are all types of deregulation. Choy’s 1997 report aligns well with Hursh’s (2007) argument that the deregulation trend in all public sectors has been advancing since the end of WWII and peaked in the 1990s and early 2000s with the second Bush presidency. It is important to clarify, however, that Hursh was not asserting that deregulatory education reform is merely a Republican ideal. In fact, a deregulatory approach to education was cemented with bi-partisan approval in 2002 when No Child Left Behind passed the House with more votes from Democrats than Republicans, 197-185 (congress.gov).
30
scores from 4th-12th grade U.S. students compared to the international average, in a
foreshadowing of Friedman’s (2005) logic. The perceived weakness of secondary education only added fuel to the argument for deregulation.
Given that this is the direction that educational reform is taking (many recent presidential candidates supported a deregulatory agenda in education), it is of paramount importance to determine just how great the organizational/structural differences are between
independent/parochial/charter schools and traditional public school, especially regarding student achievement. Deciphering anecdote from objective investigation is more difficult in the current political environment, and that numerous Political Action Committees and “think tanks” have waded into the debate only further muddies the waters.
Independent and parochial schools have been around for centuries in the United States, and have existed exclusively within a market context. To achieve results (or the perceived results) similar to traditional market-based schools, efforts aimed at deregulating education and allowing the market to create efficiency and positive outcomes has led to the public-private option: charter schools. Charter schools rely on public money to operate, but do so outside of the purview of elected boards of education and their appointed superintendents. Some states allow charter schools to operate on a for-profit basis, revealing a true market-driven approach that rewards efficiency and student success. In charter schools, achievement scores and college admissions are measures of effectiveness, and also drive the bottom line through increased admissions, which translates into more funding.
31
all share the common requirement of presenting to the LEA financial disclosures and student test scores to confirm or repudiate their claims of higher efficiency and/or efficacy.
While Nelson, Muir, and Drown (2003) and Speakman and Hassel (2005) have shown that charter schools overall receive less funding per pupil than their traditional counterparts, it is unclear what the difference is, if there is one. That calculation is skewed by factors including the exclusion of charters from the economies of scale that larger districts can utilize to mitigate costs for large volume needs, such as paper towels for restrooms or chalk for classrooms. It is not, and cannot be, a true dollar-for-dollar comparison. An area given attention in the article was that of facilities and their associated costs. The costs for facilities obviously differ across geographic locations, and within districts. For example, in a district that was losing population, a charter school often occupied a vacated or under-occupied school building (Fiske and Ladd, 2013). Conversely, in growing districts, such as Wake County, NC, facilities for charter schools were often found in former industrial or commercial spaces, and the facilities came with a more substantial price tag. The difference in funds allocated to facilities among charter schools was dramatic, and districts and states were inconsistent in regard to facilities funding on top of the per-pupil allotments.
Review of Charter School Performance
32
In their study of the 2003 NAEP data, Lubienski and Lubienski (2006) argued that when student demographics are accounted for, the private school effect (specifically, higher
achievement scores) is neutralized, and in many cases reversed. They acknowledge that their findings differ from the results found in Choy (1997) and Hoxby (1994, 2003). Further clarifying their position, Lubienski and Lubienski published a further analysis of their study in 2006, offering this within the executive summary:
These notable findings regarding the remarkable performance of public schools are significant, not just statistically, but also in terms of their policy implications. The presumed panacea of private-style organizational models—the private-school
advantage—is not supported by this comprehensive dataset on mathematics achievement. These data suggest significant reasons to be suspicious of claims of general failure in the public schools, and raise substantial questions regarding a basic premise of the current generation of school reforms based on mechanisms such as choice and competition drawn from the private sector.
What they refer to as “private-style educational models” was defined as including charter schools along with voucher programs, which they analyzed in depth in their 2009 article, along with P. Wetzel. wherein they attempted to refute the perceived consensus surrounding voucher programs and private education.
Countering the Lubienkis’ research, Abdulkadiroğlu et al. (2011) investigated
33
CREDO has published several reports on charter school performance. The most recent study was published in 2013, and offers a detailed consideration of the performance of charter schools nationwide. Most striking was their analysis of charter schools’ performances as compared to their local markets in both reading (green) and math (pink):
Figure 2.4: Graphical Representation of Charter School Reading and Math Gains/Losses Relative to TPS Market
Source: CREDO, Executive Summary,
https://credo.stanford.edu/documents/NCSS%202013%20Executive%20Summary.pdf
CREDO’s results are a mixed bag for charter advocates and opponents alike. If charters are truly experimental in their curricular practices, then one could expect outcomes like this, but only if the results were aligned institutionally. However, if the lessons of what does and does not work are not being passed along to the larger, traditional public school system, then charters are, in fact, relatively average in relation to their local markets, and may be simply redundant.
34
I find evidence that easier choice leads to greater productivity. Areas with greater opportunities for choice among public schools have lower per-pupil spending, lower teacher salaries, and larger classes. The same areas have better average student performance, as measured by students' educational attainment, wages, and test scores. Performance improvements are concentrated among white non-Hispanics, males, and students who have a parent with at least a high school degree. However, student
performance is not worse among Hispanics, African-Americans, females, or students who do not have a parent with a high school degree. Also, student performance improves at both ends of the educational attainment distribution and test score distribution.
Although Hoxby’s analysis came before much of the charter school movement had begun, her reasoning for choice was attractive to nearly all constituents except for public school faculty and staff. Lower PPE, higher achievement, and lower salaries are all interesting and uncommonly associated factors.
Almost a decade later, Hoxby again commented upon the importance of choice. This time in an environment including charters, and reached a similar conclusion. Highlighting the
importance of competition effects on all schools in a district, Hoxby (Hoxby, 2003, p. 339) argued that “schools that face choice-driven incentives can be induced to raise their
productivity.” She supported her argument with evidence from districts with for-profit choice schools, not-for-profit choice schools, and in districts with only TPS choice schools.
In 2014, Roland Fryer discussed translating the best instructional practices discovered in charter schools into the larger public school system in Houston, Texas. His study incorporated five techniques (increased instructional time, high-dosage tutoring, data-driven instruction, more effective teachers and administrators, and a culture of high expectations). His findings showed significant benefits of the practices for mathematics, but had insignificant effects upon reading achievement. Comparable experiments in Denver and Chicago found similar results.
35
achievement data from standardized test scores in 33 samples in which students were selected for charters based on a randomized lottery. Researchers compared the achievement data of students who were admitted to the data of those who were not selected through regression analysis, then evaluated school impact on achievement. Their results were not statistically significant, but trended toward a negative effect, within the expected error.
Nationally, a trend within charter school geography is that they are most commonly established in racially diverse neighborhoods, often as the deregulated answer to failing public school options. In Michigan, the average (mean, 25th and 75th percentile) test scores among first-year charter school students consistently went down each first-year of Bettinger’s (2004) study. One posited reason is that the number of disadvantaged students entering charter schools from low-performing backgrounds increased, or that an increasing number of students transferred to a different school (many of them charters) every year. The tie between the increase in
economically disadvantaged students and the increase in charter schools established in high-diversity neighborhoods is clear. And while the trend across Michigan was for second year (and beyond) charter students to improve, the transient student population had grown, making the option for charter rather than a consistent public option more suspect.
36
students enrolling (a.k.a., non-minority) but without the financial costs of relocation or
independent school fees. This essentially allowed charter schools to be publicly financed, racially segregated institutions allowing for a geographically diverse, but not necessarily racially diverse population.
Renzulli and Evans (2005) further asserted that the perceived value of property and status of an educational institution can be diminished in the eyes of white citizens when diversity levels in neighborhoods and schools rise. The authors found that 30% enrollment was the proverbial “tipping point” for white flight to occur in a school, and that racial segregation was greater between districts than within districts, indicating that families were willing to relocate to specific areas to find the student-body racial composition they favored. Within the context of charter schools, the initial research was encouraging through an equity/access/diversity lens: 51% of all charter enrollments in 2003 were minority students, compared to 41% in traditional public schools, indicating that the charter movement was fulfilling its promised potential to reach minority students (Frankenberg and Lee, 2003).
However, when drilling down further, variation within states can be dramatic. In California, Wells (1998) found that 37 percent of charter schools were 80%-100% white students. In Florida, Crew and Anderson (2003) found that charter schools were 30% more racially segregated than public schools, and similarly in Arizona, Cobb and Glass (1999) found that charters were 20% “more white” than traditional public schools. The state-level data refutes the narrative and the averages, showing that they appear sound on a macro level, while
37
Previous Charter School Efficiency Studies
Charter schools have been studied for their efficiency in relation to traditional public schools, but researchers have not measured charter schools against each other or employed the modified quadriform.. In addition, the studies have had strikingly dissimilar conclusions about efficiency. Grosskopf (2009) asserted that Texas charters schools enjoy a statistically significant advantage in efficiency in comparison to their TPS counterparts, while Bifulco and Ladd (2006) determined that charter schools in North Carolina were significantly less efficient than their TPS “competition.”
Eric Bettinger (2004) published an article in the Economics of Education Review
concerning charter school efficiency and citing a study he had conducted in Michigan, a state that established charter schools at a higher-than-average pace. Building on the work of previous educational organization studies such as Coleman, Hoffer, and Kilgore (1982), who investigated differences in student cognitive outcomes between public and private institutions, and Evans and Schwab (1995), who refined the question to study exclusively Catholic schools, Bettinger
extended the research to include charter schools.
Bettinger (2004) was building upon research already performed and published by Solmon, Park, and Garcia (2001), Nelson and Hollenbeck (2001), and Hoxby (2001) among others. In a finding consistent with that of Eberts and Hollenbeck (2002), Bettinger found that students who attended a charter school in Michigan do not enjoy an academic advantage relative to their traditional public school counterparts, and in fact their scores may decline in comparison to their public school counterparts.
38
Texas were significantly more efficient than their TPS counterparts. Other literature that
supported charter schools as more efficient comes from CREDO (2015) citing that specifically in urban districts, students have a significant gain in instructional days relative to their TPS
counterparts.
Closer to home, Robert Bifulco and Helen Ladd (2006) published a study titled, “The Impacts of Charter Schools Upon Student Achievement: Evidence from North Carolina.” They reached a similar conclusion to Bettinger (2004), asserting that North Carolina charter school students do not, overall, enjoy large academic achievement gains when compared to their TPS counterparts. Further, they conclude that any overall gains that charter schools are offering to the public school system are offset by the large negative impact they have on achievement. Overview of Funding in Charter Schools
Nationally, charter school funding mechanisms vary significantly. One relevant example outside of North Carolina is Michigan, where charter school funding is set at 97% of the state allocation for public school students. However, charters in Michigan do not receive any local supplements, nor do they have access to funds for renting or purchasing facilities. The
39
NC Charter Schools Legislation
The legal basis for charter schools in North Carolina was established on June 21, 1996 with ratification of NCGS §115C-218. Per the statute, charter schools are established and charged as follows:
Purpose of Charter Schools. The purpose of this Article is to authorize a system of charter schools to provide opportunities for teachers, parents, pupils, and community members to establish and maintain schools that operate independently of existing schools, as a
method to accomplish all of the following:
1. Improve student learning;
2. Increase learning opportunities for all students, with special emphasis on expanded learning experiences for students who are identified as at risk of academic failure or academically gifted;
3. Encourage the use of different and innovative teaching methods;
4. Create new professional opportunities for teachers, including the opportunities to be responsible for the learning program at the school site;
5. Provide parents and students with expanded choices in the types of
educational opportunities that are available within the public school system; and
6. Hold the schools established under this Article accountable for meeting measurable student achievement results, and provide the schools with a method to change from rule-based to performance-based accountability systems.
Further legislation, all under the NCGS §115C-218 designation, cover the totality of rules and regulations governing charter school operations, funding, and reporting.
North Carolina Charter Schools
40
of the regulatory spectrum. Like Michigan, no charters may be obtained by religious
organizations, but unlike many other charter school adopters, there is a minimum requirement for certified teachers: 75 percent of faculty in grades K-5 and 50 percent in grades 6-12. Charters in North Carolina can be revoked for several reasons, but most notably for poor student
performance and financial mismanagement. Between 1997 and 2006, seven charters were revoked, and seven more were voluntarily relinquished due to low enrollment and financial trouble. Conspicuously, since 2006 no charters have been revoked in North Carolina due to low student performance. Overall, roughly 12% of all charters opened in North Carolina after 1997 were closed by 2006. (Bifulco and Ladd, 2006)
Unlike Michigan, North Carolina charters receive a pro-rated percentage of the local supplement in addition to the per-pupil payment, and there is access to federal (but not state) education dollars to fund facilities. Additionally, in North Carolina charter schools, students are required to take the same state tests as traditional public school students. While NCGS §115C-218.105 protects the budgetary commitments of a charter school (ensuring faculty and staff are paid, programs are funded, etc.), it does present a possible equity issue. The law gives the charter school the per-pupil funding. If a student leaves a particular school any time in the first 60 days, those funds go with the student to his or her new school. However, if a student is expelled from a charter school on day 61, he or she would legally be compelled to attend a TPS (as the TPS is compelled to accept the student). However, funding for that student would remain at the charter school.
41
multiple avenues: federal, state, and local governments chief among them, and also through private allocations and fundraising organizations, such as booster clubs and PTAs, but their overall budget must be in accordance with the State Board of Education’s (SBE) budget resolution for the fiscal year. Individual schools may utilize public and private funds as they acquire them, with no limitations upon their spending, as defined in NCGS §115C–425. To keep superintendents and school administrative units accountable, NCGS § 115C–427-499 covers the creation, submission, review, accounting, and reporting of all budgets, funds, loans, bonds, and scholarships payable to or through the administrative unit.
Charter schools receive public funds per NCGS §115C–238.29H, which requires that charter schools receive “an amount equal to the average per pupil allocation for average daily membership from the local school administrative unit allotments…” and the LEA sending the student is required to share allotments from the local current expense fund. To keep charter schools accountable there is a private board, not responsible to the local school administrative unit (NCGS §115C–238.29E). Charter schools are also required by the same statute to maintain federal tax-exempt status, and adhere to 501 c3 regulations of a non-profit organization.
42
Table 2.1: Mean and Median PPE in North Carolina TPS and Charter Schools 2012-2013
School Type Average PPE Median PPE
Traditional Public School $5,484.57 $5,331.00
Charter School $4,957.10 $4,738.50
Difference $527.47 $592.50
Framework for Interpretation
Springer, Houck, and Guthrie collaborated for the opening chapter in Handbook of Research in Education Finance and Policy (Ladd & Fiske, 2013) and addressed the “History and Scholarship Regarding United States Education Finance and Policy,” which served as a
convenient framework for this literature review. The chapter is a collection of salient policies and interventions utilized by scholars and schools over the past century to address, measure, and/or improve efficiency of resource allocation in schools.
The authors established a set of three modern public values of education finance policy (including Cubberley’s efficiency) namely equity, efficiency, and liberty. Guthrie and Wong (Ladd & Fiske, 2013) highlighted the tension created between these three key social values. Each value exists in tension with the other two, but also contains its own separate line of inquiry.