ESSAYS ON BRAND TRUST
Koushyar Rajavi
A Dissertation submitted to the faculty at the University of North Carolina at Chapel Hill in partial fulfillment of the requirements for the degree of Doctor of Philosophy in Business
Administration in the Kenan-Flagler Business School.
Chapel Hill 2018
iii ABSTRACT
Koushyar Rajavi: Essays on Brand Trust
(Under the direction of Tarun Kushwaha and Jan-Benedict Steenkamp)
Brand Trust is defined as the “willingness of the average consumer to rely on the ability of the brand to perform its stated function” (Chaudhuri and Holbrook 2001, p. 82). Trust plays a key role in brand success by lowering customers’ purchase risk and easing their decision making. Despite the importance of brand trust, industry reports indicate alarming decline in consumer trust in brands across the world. For example, Young & Rubicam (2011) reported that the percentage of brands that customers trusted dropped from 49% in 2001 to 25% in 2010. In the meantime, despite growing managerial interest in brand trust, marketing literature lacks
generalizable insights regarding antecedents and consequences of brand trust. Specifically, there is need for research to investigate the impact of marketing activities on brand trust, the
implications and consequences of brand trust (and violation of brand trust), and the
characteristics that explain the heterogeneity in relationships between brand trust and related concepts. I address these issues in three studies.
iv
v
To my wife, Mahnaz Parsanasab,
And my parents Mahboub Asri and Behzad Rajavi;
vi
ACKNOWLEDGEMENTS
The completion of my dissertation and Ph.D. has been a long journey. It would not have been possible to do without the support and guidance that I received from several people. First, I would like to express my special appreciation and thanks to my advisors, Tarun Kushwaha and Jan-Benedict Steenkamp. I am extremely grateful to Tarun Kushwaha and Jan-Benedict
Steenkamp, for their invaluable guidance, scholarly input, and their patient support throughout my Ph.D. In addition, I would like to thank the rest of my dissertation committee, Isaac Dinner, Katrijn Gielens, and Saravanan Kesavan for their valuable advice and feedback throughout the doctoral program and dissertation work.
I wholeheartedly thank my wife and soul mate, Mahnaz Parsanasab. These past several years have not been an easy ride for me. I truly thank Mahnaz Parsanasab for her love, constant
support and encouragement, and for helping me gain confidence in my abilities.
vii
TABLE OF CONTENTS
LIST OF TABLES ... xii
LIST OF FIGURES ... xiii
CHAPTER 1: INTRODUCTION ... 1
REFERENCES ... 6
CHAPTER 2: IN BRANDS WE TRUST? A GLOBAL STUDY INTO THE RELATIONSHIP BETWEEN MARKETING MIX ACTIVITIES AND BRAND TRUST IN CONSUMER PACKAGED GOODS INDUSTRY ... 8
Abstract ... 8
Introduction ... 9
Research Hypotheses ... 11
Previous Research ... 11
Marketing Mix Instruments and Brand Trust... 14
Variation in the Relationship between Marketing Mix Activities and Brand Trust across Categories ... 18
Variation in the Relationship between Marketing Mix Activities and Brand Trust across Countries ... 19
Method ... 21
Data ... 21
Cross-National Measurement Validation ... 23
Model and Estimation ... 25
Endogeneity and Common Method Variance ... 27
Results ... 30
viii
Model Fit ... 30
Hypothesis Testing ... 32
Developed Countries vs. BRIC Countries ... 35
Robustness Checks ... 36
Discussion ... 38
Limitations and Further Research ... 40
REFERENCES ... 43
CHAPTER 3: IMPACT OF ECONOMIC BUSINESS CYCLES ON EVOLUTION OF BRAND EQUITY: ROLE OF BRAND AND PRODUCT CHARACTERISTICS ... 60
Abstract ... 60
Introduction ... 61
Conceptual Background ... 64
Brand Equity Definition and Measurement ... 64
Business Cycle and Its Relationship with Brand Equity ... 66
Permanent Effect of Business Cycle on Brand Equity ... 67
The Relationships between Business Cycle Fluctuations and Brand Equity across Different Brand Segments ... 68
The Relationships between Business Cycle Fluctuations and Brand Equity across Different Product Categories ... 69
Data ... 70
Model and Estimation ... 71
Step 1: Estimating Brand Equity ... 71
Step 2: Extracting Cyclical and Trend Components in Each of the Time-Series ... 73
Step 3a: Assessing Temporary Impact of Business Cycle Fluctuations on Brand Equity ... 75
Step 3b: Assessing Permanent Impact of Business Cycle Fluctuations on Brand Equity ... 76
ix
Results ... 78
Brand Equity Estimation (Step 1) ... 78
Temporary Impact of Business Cycle Fluctuations on Brand Equity (Step 3a) ... 79
Permanent Impact of Business Cycle Fluctuations on Brand Equity (Step 3b) ... 80
Heterogeneity in Temporary and Permanent Impacts of Business Cycle Fluctuations on Brand Equity across Different Product Categories (Step 4) ... 81
Additional Analyses ... 82
Discussion ... 84
Managerial Implications ... 86
Limitations and Directions for Future Research ... 88
REFERENCES ... 92
CHAPTER 4: RECOVERING FROM PRODUCT-HARM CRISIS: HOW RISK FACTORS IMPACT EFFECTIVENESS OF PRICE PROMOTIONS? ... 106
Abstract ... 106
Introduction ... 107
Research Hypotheses ... 110
Price Promotion ... 111
The Role of Risk Perception ... 112
Recall Severity ... 113
Product Category Risk ... 114
Uncertainty Avoidance ... 116
Data ... 117
Identifying Recall Instances ... 117
Brand Performance and Price Promotion ... 119
Recall Severity ... 120
Product Category Risk ... 121
x
Control Variables ... 122
Model and Estimation ... 123
Empirical Challenges ... 125
Results ... 126
Model Fit ... 126
Hypothesis Testing ... 127
Control Variables ... 129
Robustness Tests ... 130
General Discussion and Implications ... 131
Managerial Implications ... 132
Limitations and Directions for Future Research ... 135
REFERENCES ... 136
CHAPTER 5: CONCLUSION ... 151
APPENDIX 2.A: EXAMPLES OF LOW, MEDIUM, AND HIGH TRUSTED BRANDS ... 153
APPENDIX 2.B: ESTIMATION AFTER EXCLUDING ONE COUNTRY AT A TIME ... 154
APPENDIX 2.C: MODEL-FREE EVIDENCE ... 155
APPENDIX 3.A: SURVEY ITEMS USED FOR CATEGORY LEVEL PERCEPTUAL MEASURES ... 156
APPENDIX 3.B: HETEROGENEITY IN TEMPORARY AND PERMANENT IMPACTS OF BUSINESS CYCLE FLUCTUATIONS ON BRAND EQUITY USING CONTINUOUS MEASURES FOR BRAND AND CATEGORY LEVEL MEASURES ... 157
APPENDIX 3.C: TEMPORARY BRAND-SPECIFIC EFFECTS OF BUSINESS CYCLE CHANGES ON BRAND EQUITY ... 158
APPENDIX 3.D: TEMPORARY CATEGORY-SPECIFIC META-ANALYTIC EFFECTS OF BUSINESS CYCLE CHANGES ON BRAND EQUITY ... 161
xi
APPENDIX 3.F: PERMANENT CATEGORY-SPECIFIC META-ANALYTIC EFFECTS OF BUSINESS CYCLE CHANGES ON BRAND EQUITY ... 165 APPENDIX 3.G: PERFORMANCE RISK, SOCIAL RISK, AND
xii
LIST OF TABLES
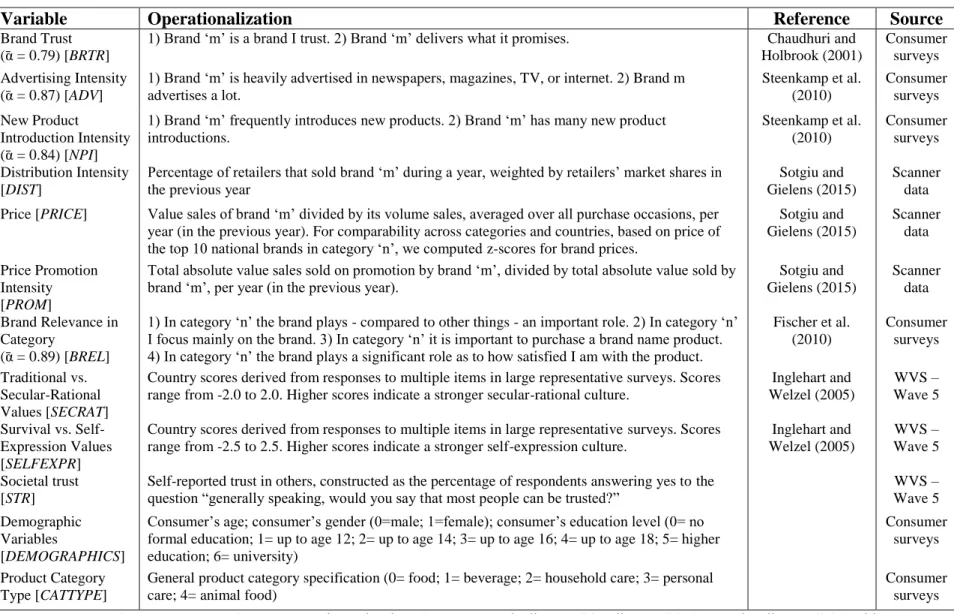
TABLE 2.1: Variables and descriptions ... 49
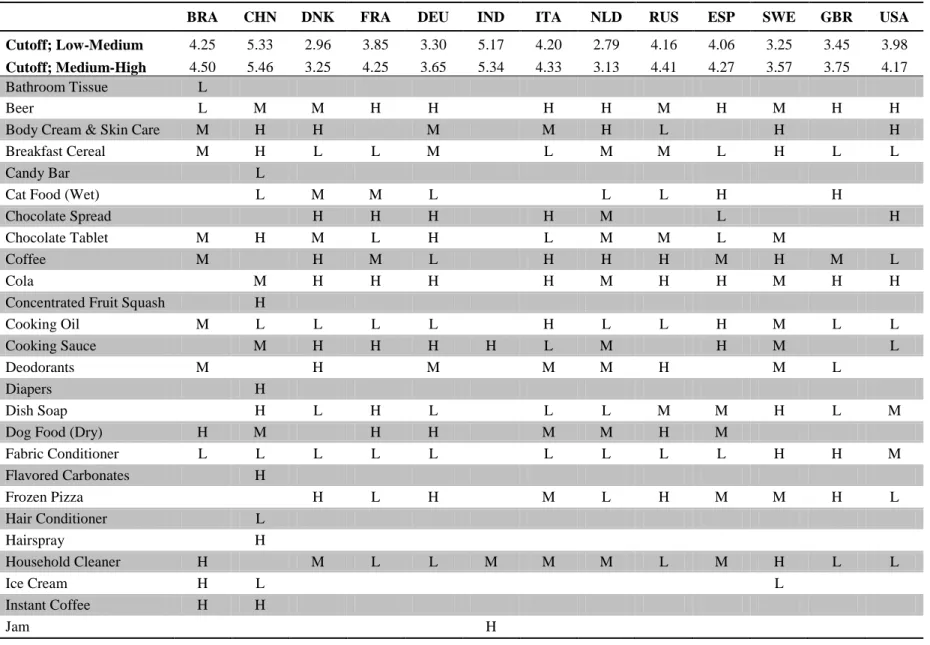
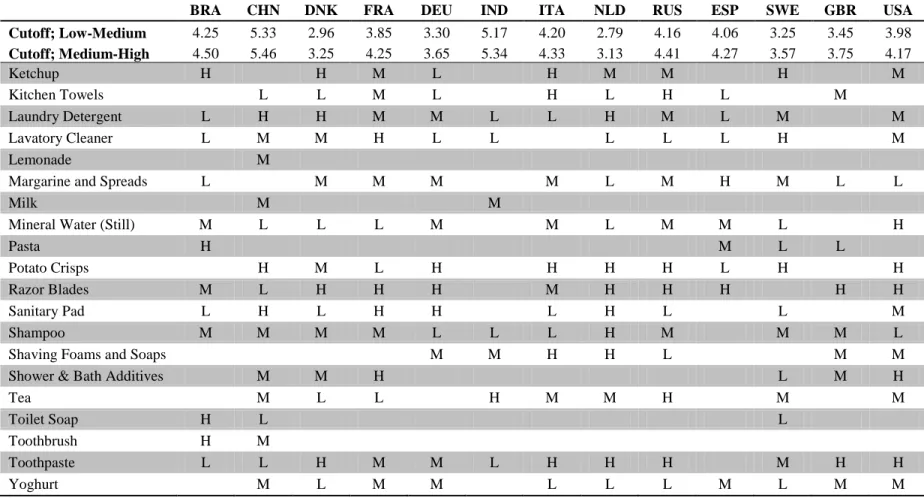
TABLE 2.2: Categories and countries in our dataset ... 50
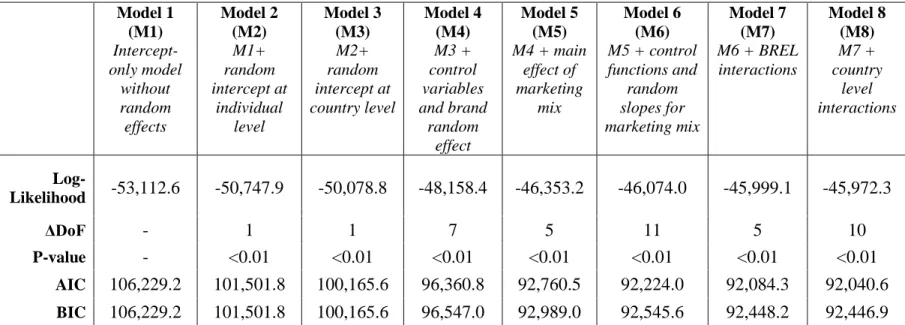
TABLE 2.3: Model fit... 52
TABLE 2.4: Results ... 53
TABLE 2.5: The relationships between marketing mix activities and brand trust in BRIC countries and developed countries... 54
TABLE 2.6: The relationships between marketing mix activities and brand trust in median split analysis ... 54
TABLE 2.7: Random slopes for marketing mix at the brand level ... 55
TABLE 3.1: Related research on the impact of business cycles on marketing-related phenomena ... 98
TABLE 3.2: Focal variables in this study ... 99
TABLE 3.3: Summary of elasticities in the first stage model ... 100
TABLE 3.4: Impact of business cycle fluctuations on brand equity ... 101
TABLE 3.5: Heterogeneity in temporary and permanent impacts of business cycle fluctuations on brand equity across product categories and brand segments ... 102
TABLE 4.1: Review of relevant literature from the domain of product-harm crises ... 141
TABLE 4.2: Some examples of product recalls in our study ... 142
TABLE 4.3: Variables and descriptions ... 143
TABLE 4.4: Model fit... 144
TABLE 4.5: Results: effect on logit transformed market share ... 145
xiii
LIST OF FIGURES
1
CHAPTER 1: INTRODUCTION
In the Oxford dictionary, trust is defined as the “firm belief in the reliability, truth, or ability of someone or something”, while Giffin (1967, p. 105) defined trust as the “reliance upon the characteristics of an object, or the occurrence of an event, or the behavior of a person in order to achieve a desired but uncertain objective in a risky situation”. The essence of trust is the belief that another entity has the ability and the willingness to fulfill its promises.
Trust is crucial in our daily lives because it reduces uncertainty inherent in any economic or social transaction. It is difficult to open a newspaper or a magazine that does not talk about trust in one way or another. Indeed, there are few constructs that play a bigger role in international, national, economic, and social life than trust. Accordingly, trust has been studied across many fields including sociology (Lewis and Weigert 1985), psychology (Rotter 1967), economics (North 1990), political science (Newton 2001), and management (Rousseau et al. 1998). In marketing, while the role of trust has been extensively studied in B2B settings (e.g., Moorman, Deshpande, and Zaltman 1993; Morgan and Hunt 1994; Doney and Cannon 1997; Geyskens, Steenkamp, and Kumar 1998; Sirdeshmukh, Singh, and Sabol 2002), there has been little academic research investigating the role of trust in B2C contexts. Specifically, consumers’ trust in brands has not been adequately addressed in the literature.
2
the notion of trust. Today’s marketplace has brought about huge complexities and uncertainties for consumers; a typical consumer is faced with lots of options and alternatives but limited time and budget. If consumers trust the brand to deliver on its promises, this eases their decision making, reduces their purchase risk, and reduces costs of information gathering and processing (Erdem, Swait, and Valenzuela 2006). Thus, brand trust – defined as the consumer’s belief that the brand is willing and able to deliver on its promises (Chaudhuri and Holbrook 2001; Erdem and Swait 2004) – is key to brand success in the marketplace. Given the importance of brand trust, it is worrying that industry evidence indicates that trust in brands is slipping. For instance, according to Young & Rubicam, the proportion of brands that customers said they trusted dropped from 49% in 2001 to 25% in 2010 (Young & Rubicam 2011). Subsequently, consumer trust in brands has moved to the top of marketing managers’ priority lists.
In my dissertation, I aim to contribute to marketing literature and practice by studying aspects of brand trust that have not been thoroughly investigated. More specifically, I address three facets of brand trust: (a) marketing mix activities as drivers of brand trust; (b) dynamics of brand equity as outcome of brand trust; and (c) product-harm crises as instances in which brand trust is violated. Additionally, I examine the role that brand, category, and country characteristics play in explaining the heterogeneity in strength of the observed relationships.
3
secondary (household panel, country data) measures on brands in consumer packaged goods (CPG) categories. The dataset covers 13 countries, including the US, various European countries, as well as all the BRIC countries (Brazil, Russia, India, and China). I use hierarchical linear modeling for cross-classified data which controls for unobserved heterogeneity at country, category, brand, and respondent levels. I find that advertising, innovation, distribution, and price positively impact brand trust whereas price promotions damage brand trust. Furthermore, I find that the marketing mix instruments have stronger impact in categories with high brand relevance, countries high on secular-rational values, and countries high on survival values.
The main reason that brand managers care about brand trust is that it is an important
4
monthly data on 150 leading CPG brands in 36 categories across 17 years. The results show that brand equity behaves cyclically; it increases (decreases) during economic upturns (downturns) and that such changes persist in the long run. Moreover, I find that business cycle fluctuations have a stronger impact on brand equity in low performance risk categories, for brands that are pricier, and brands that do not advertise a lot.
Although the importance of brand trust in building brand equity and thus contributing to brand’s success is well-established, brand trust is often violated. The likes of Volkswagen, Wells Fargo, Uber, Facebook, and United Airlines are among a long list of firms which have recently violated their customers’ trust in different ways. When trust is violated, managers are desperate to do something to mitigate the losses and regain customer trust. Marketing managers oftentimes turn to price promotions to reduce customer churn and regain customer trust. For example, after the Volkswagen emission scandal, the German auto manufacturer offered large discounts to avoid losing customers (Bloomberg 2015). However, it is not clear whether price promotions can be helpful in reducing the consequences of violation of customer trust and more importantly, under which conditions price promotions are more effective in helping the affected brands. In the third essay, I study product-harm crises as well-known instances in which brand trust is violated. This study is guided by two important questions: 1) Can price promotions help the recalled brands? 2) What explains the heterogeneity in post-recall brand performance and post-recall price promotion effectiveness? In doing so, I study country (i.e., uncertainty avoidance),
5
6
REFERENCES
Ambler, Tim (1997), “How Much of Brand Equity is Explained by Trust?,” Management Decision, 35 (4), 283-92.
Bloomberg (2015), “VW Discounts Almost Double U.S. Average after Cheating Scandal,” (October 21), (accessed October 3, 2017), [available at https://goo.gl/XVYUhG]
Chaudhuri, Arjun and Morris B. Holbrook (2001), “The Chain of Effects from Brand Trust and Brand Affect to Brand Performance: The Role of Brand Loyalty,” Journal of Marketing, 65 (April), 81-93.
Doney, Patricia M. and Joseph P. Cannon (1997), “An Examination of the Nature of Trust in Buyer-Seller Relationships,” Journal of Marketing, 61 (April), 35-51.
Erdem, Tülin and Joffre Swait (1998), “Brand Equity as a Signaling Phenomenon,” Journal of Consumer Psychology, 7 (2), 131-57.
Erdem, Tülin and Joffre Swait (2004), “Brand Credibility, Brand Consideration, and Choice,” Journal of Consumer Research, 31 (June), 191-8.
Erdem, Tülin, Joffre Swait, and Ana Valenzuela (2006), “Brands as Signals: A Cross-Country Validation Study,” Journal of Marketing, 70 (January), 34-49.
Giffin, Kim (1967), “The Contribution of Studies of Source Credibility to a Theory of
Interpersonal Trust in the Communication Process,” Psychological Bulletin, 68 (2), 104–20. Keller, Kevin Lane (1998), Strategic Brand Management: Building, Measuring, and
Managing Brand Equity. Upper Saddle River, NJ: Prentice Hall.
Kotler, Philip (2002), Marketing Management. Englewood Cliffs, New Jersey Prentice-Hall. Lewis, J. David and Andrew Weigert (1985), “Trust as a Social Reality,” Social Forces, 63 (4).
967-85.
Moorman, Christine, Rohit Deshpande, and Gerald Zaltman (1993), “Factors Affecting Trust in Market Research Relationships,” Journal of Marketing, 57 (1), 81-101.
Morgan, Robert M. and Shelby D. Hunt (1994), “The Commitment-Trust Theory of Relationship Marketing,” The Journal of Marketing, 58 (July), 20-38.
Newton, Kenneth (2001), “Trust, Social Capital, Civil Society, and Democracy,” International Political Science Review, 22 (2), 201-14.
7
Rotter, Julian B. (1967), “A New Scale for the Measurement of Interpersonal Trust,” Journal of Personality, 35 (4), 651-65.
Rousseau, Denise M., Sim B. Sitkin, Ronlad S. Burt, and Colin Camerer (1998), “Not So
Different After All: A Cross-Discipline View of Trust,” Academy of Management Review, 23 (3), 393-404.
Sirdeshmukh, Deepak, Jagdip Singh, and Barry Sabol (2002), “Consumer Trust, Value, and Loyalty in Relational Exchanges,” Journal of Marketing, 66 (1), 15-37.
Geyskens, Inge, Jan-Benedict EM Steenkamp, and Nirmalya Kumar (1998), “Generalizations about Trust in Marketing Channel Relationships Using Meta-Analysis1,” International Journal of Research in Marketing, 15 (3), 223-48.
8
CHAPTER 2: IN BRANDS WE TRUST? A GLOBAL STUDY INTO THE
RELATIONSHIP BETWEEN MARKETING MIX ACTIVITIES AND BRAND TRUST IN CONSUMER PACKAGED GOODS INDUSTRY
Abstract
The essence of a brand is that it delivers on its promises. However, consumer trust in brands has declined around the world in recent decades. As a result, brand trust has become a major concern for managers. We study the relationship between marketing mix activities (i.e.,
advertising, new product introduction, distribution, price, and price promotion) and brand trust. We propose and show that the relationship between marketing mix and brand trust is moderated by cultural and category level factors. Using a unique data-set which consists of survey and scanner panel data in 46 CPG categories across 13 countries, we find that advertising, new product introduction, distribution, and price are positively associated with brand trust whereas price promotion and brand trust are negatively related. Furthermore, we find that marketing mix activities are more strongly related to brand trust in categories with high brand relevance, countries high on secular-rational values, and countries low on self-expression values. We also examine differences in the relationship between marketing mix activities and brand trust between developed and BRIC countries in an exploratory fashion. Limitations and implications for future research are discussed.
9 Introduction
For most firms, brands are among their most valuable assets. According to brand consultancy Kantar Millward Brown, the value of the 100 most valuable global brands alone stood at $3.4 trillion in 2016 (Millward Brown 2016a). What makes brands so valuable? This can be
understood by considering the definition of a brand: “a seller’s promise to deliver a specific set of features, benefits and services consistent to the buyers” (Kotler 2002, p. 593). Thus, a brand is a pledge by the firm to deliver on its promises. If consumers trust the brand to deliver on these promises, this eases their decision making, reduces costs of information gathering and processing information, reduces their purchase risk, and increases expected utility (Erdem, Swait, and Valenzuela 2006). Thus, trust is key to brand success in the marketplace. For example, Kantar Millward Brown found that B2B brands that rated high on brand trust grew 80% in brand value in the last decade while less trusted brands grew only 25%. As another example, industry analysts consider brand trust to be crucial for the success of the Internet of Things. Hence, it is not surprising that the word trust (trustworthy, trusted) occurred 64 times in Millward Brown’s (2016a) BrandZ global report.
10
2015 when the CEOs of leading consumer goods firms such as P&G, Nestlé, and PepsiCo gathered for the 59th Consumer Goods Forum’s annual summit, ‘Trust as a Foundation for Growth’ was their main topic of discussion (Consumer Goods Forum 2015).
Academic research has recognized the importance of brand trust - defined as the consumer’s belief that the brand is willing and able to deliver on its promises (Chaudhuri and Holbrook 2001; Erdem and Swait 2004). The focus of this stream of research has largely been on the consequences of brand trust, including expected utility (Erdem and Swait 1998), brand
consideration and brand choice (Erdem and Swait 2004; Erdem, Swait, and Valenzuela 2006), brand loyalty (Chaudhuri and Holbrook 2001), and word of mouth (Becerra and Badrinarayanan 2013). We build upon and extend previous work in three meaningful ways. First, while there is considerable research evidence that consumer trust in one’s brand is associated with favorable attitudinal and behavioral outcomes, there is little research on the relation between firm marketing mix activities and consumer trust in their brands. We conduct a comprehensive investigation into the relationship between five essential brand marketing mix activities that are under the control of the firm - advertising intensity, new product introduction intensity, price, price promotion, and distribution intensity - and brand trust. Our examination encompasses a large number of product categories. This allows for a rather comprehensive assessment of the relationship between marketing mix activities and brand trust.
11
Western brands as it has been identified as a major factor in countries like China (Millward Brown 2017a), India (Millward Brown 2016b), and Latin America (Millward Brown 2017b).
Third, we examine boundary conditions to the findings within and across countries. More specifically, we investigate whether the relationship between marketing mix activities and brand trust systematically differs across product categories in function of the relevance that brands have in that category (Fischer,Völckner, and Sattler 2010) and across countries according to their national culture (Steenkamp and Geyskens 2014).
We put together a unique cross-sectional data set, which contains primary (survey) data as well as secondary (household panel, country) data from 15,073 respondents on 589 brands in 46 consumer packaged goods (CPG) categories. Our data set covers 13 countries, including the US, various European countries including France, Germany, and Great Britain, as well as the four BRIC countries (Brazil, Russia, India, and China). Several marketing mix instruments (new product introduction intensity, advertising intensity) are derived from the surveys, others (price, price promotion, distribution) are derived from household panels operated by Kantar
Worldpanel, GfK, and IRI. We recognize that the cross-sectional nature of our empirical analysis, despite our best efforts to address biases and endogeneity concerns, has limitations. Therefore, we characterize our findings as descriptive. Our findings which are based on this broad database can direct future follow-up causal research using longitudinal and/or field experimental designs. We discuss this at the end of our paper.
Research Hypotheses Previous Research
12
many fields including psychology (Rotter 1967), sociology (Lewis and Weigert 1985), political science (Newton 2001), economics (Dasgupta 1988), and management (Rousseau et al. 1998). In marketing, the role of trust has been studied extensively in B2B settings (Ganesan 1994; Morgan and Hunt 1994; Doney and Cannon 1997; Geyskens, Steenkamp, and Kumar 1998). In
comparison, there has been relatively little academic research examining the role of trust in B2C contexts in general, and in brand trust in particular. Grayson, Johnson, and Chen (2008)
examined the role of customer trust in firms when the business environment is highly trusted by customers. Their research provides evidence on the importance of contextual (i.e., industry) and institutional (i.e., country) factors in shaping customers’ trust.
Chaudhuri and Holbrook (2001) studied trust in brands, using cross-sectional survey data on 107 brands in 49 product categories. They found that highly trusted brands commanded higher attitudinal and purchase loyalty. They also examined the relation between utilitarian value (tangible product attributes) in the category versus hedonic value (nontangible, symbolic benefits) in the category and brand trust. They speculated that utilitarian value has a stronger relation with trust than hedonic value but found no support for this notion. This suggests that the promises encapsulated in the concept of brand trust may both refer to tangible outcomes (e.g., functional performance) as well as nontangible outcomes (e.g., mode of production or social welfare).
Erdem and colleagues (Erdem and Swait 1998, 2004; Erdem, Swait, and Valenzuela 2006) examined brand trust (also labeled brand credibility, defined as the ability and willingness of the brand to deliver what is promised; Erdem and Swait 1998, p. 137). Using an information
13
and consistency as antecedents and to brand purchase as consequence through the intervening constructs of perceived quality, information costs, and perceived risk. They found broad support for their model across two categories (juice and jeans) using a survey among undergraduate students. In another study conducted among students for six product categories, Erdem and Swait (2004) found that brand trust rather than brand expertise affects consumer choices and brand consideration. Erdem, Swait, and Valenzuela (2006) extended their earlier work by investigating the consequences of brand trust across countries for two product categories (juice, PCs) using surveys among students in seven countries around the world. They found strong support for the key role of brand trust in shaping consumer consideration and purchase of brands. Moreover, they documented the importance of culture in understanding how brand trust affects consumer choice. They reported that the positive effect of brand trust on choice is greater for consumers high on collectivism or uncertainty avoidance.
14
of their national culture; and the use of over 15,000 real consumers. As a consequence, we can explore issues that previous research was not designed to address. For example, we can compare average trust in brands across countries. We will see that when it comes to trust in brands, the US is actually closer to China and India than to Germany or the UK. We provide insights into the effect of each marketing mix instrument is function of the brand’s product category and the national-cultural context of its consumers. We will also compare and contrast the link between brand trust and marketing mix activities between the two important groups of countries in the world: developed countries versus emerging markets of BRICs nations. Overall, we investigate a set of issues that are important and not addressed by previous research.
Marketing Mix Instruments and Brand Trust
As discussed above, the essence of brand trust is that the brand delivers on its promises, time and time again. These promises can be of various nature such as physical attributes (e.g., organic ingredients, no artificial colors), functional benefits (taste of coffee, cleaning power of a
detergent), and symbolic and self-expressive benefits (e.g., “smart shopper,” brand corporate social responsibility). But what should hold a brand back from cheating the consumer by offering a high-priced product with the promise of superior quality while delivering inferior quality (e.g., selling products with regular (non-organic) ingredients, using cheaper coffee beans that taste less good, not being involved in CSR)? And how can the consumer trust the brand to deliver on these promises?
15
Leffler (1981) demonstrate theoretically that market prices above the competitive price and the presence of non-salvageable brand investments are means of enforcing brand promises. These authors assume that if a consumer receives a product of quality at least as high as implicitly contracted for, he or she will continue to purchase that brand. On the other hand, “if quality is less than contracted for, all consumers will cease to purchase from the particular sampled
“cheating” firm” (Klein and Leffler 1981, p. 620). So, what is to persuade a “rational” firm from reneging on its promises? If they can charge a price premium so that the brand earns a continual stream of income whose discounted value exceeds the one-time profit increase obtained from cheating. They show analytically that in competitive markets, consumers can use price as market signal to infer whether the brand is likely to fulfill its promises, i.e., that the brand can be trusted.
Klein and Leffler (1981) further show that market equilibrium requires the excess rental income from the price premium be dissipated. Brand-specific capital expenditures on advertising whose outcomes are observable to consumers are the only form of competition consistent with a zero-profit market equilibrium. These advertising expenditures become sunk cost that are lost if the brand cheats on its promises. Large advertising expenditures inform consumers of the magnitude of sunk capital costs and thereby supply information about the quasi-rent price premium being earned by the brand and hence the opportunity cost to the brand if it cheats.1 In sum, advertising expenditure can be used by consumers as an indicator of likely (absence of) cheating. Shapiro (1983) and Kihlstrom and Riordan (1984) reach the same conclusion. Empirical research has confirmed that consumers do indeed regard heavy advertising as
safeguard against cheating. Kirmani and Wright (1989) find support for the consumer attribution
16
that if a marketer spends heavily on advertising a new product, it is because the marketer believes strongly that it has high sales potential. This attribution is consistent with Klein and Leffler’s predictions – after all, even the most naïve consumers will intuitively understand that the marketer can hardly be confident about the sales potential if their brand cheats. Erdem and Swait (1998) investigate the relationship between brand advertising and the credibility of juice and jeans brands using cross-sectional survey data. They find that advertising has a significant effect (p < 0.10) on credibility of juice brands but not on the credibility of jeans brands.
Klein and Leffler (1981) and Kihlstrom and Riordan (1984) focus on advertising as brand-specific investment, but while advertising has attracted most attention in the information economics literature, the analytical conclusions apply to any kind of observable brand-name expenditures (Milgrom and Roberts 1986, pp. 799-800), including new product introductions under a given brand name (Milgrom and Roberts 1986) and distribution (Rao and Mahi 2003). Frequent new product introductions help a brand differentiate itself with its competitors. The innovative brand relies on consumers’ repeat purchases to recoup R&D, new packaging, and other innovation related costs. Thus, innovative brands signal to consumers that they are motivated to deliver on their promises; otherwise they would incur great losses (fixed cost of innovation) (Milgrom and Roberts 1986).
17
Thus, the information economics literature suggests that consumers can – and do – use a brand’s price, advertising activity, new product introduction activity, and distribution coverage as market signals to form perceptions of brand trust. But what is the role of price promotions? Price promotions are frequently used by marketing managers to increase short-term brand sales. From an economics of information perspective, price promotions may be regarded as a signal that undermines brand trust. First, they lower the price premium over costs – albeit temporarily – while a price premium is required to dissuade the brand from cheating. Second, price promotions work largely in the short run, while it is long-run revenues that motivate a firm from delivering on its promises (Klein and Leffler 1981). Thus, heavy price promotions may raise suspicions in the minds of consumers and undermine consumer attitude towards a brand (Blattberg and Neslin 1989; Yoo, Donthu, and Lee 2000). While consumers are prone to attribute heavy brand
advertising to the marketer belief in the high sales potential of the brand (Kirmani and Wright 1989), heavy promotion sends exactly the opposite signal (Blattberg and Neslin 1989). Clearly, without discounting, the brand does not have adequate sales potential. Kantar Millward Brown’s industry expert Nigel Hollis (2017) described consumer attributions to a heavily promoted brand as follows: “And consumers are not dumb – they are us after all – they interpret the scale and frequency of price reductions just like you do….What’s wrong with it? Is there a better one out there? Maybe they introduced a new version? Look, it’s on sale again! They must be in trouble.”
Based on the above discussion, we hypothesize that:
18
Variation in the Relationship between Marketing Mix Activities and Brand Trust across Categories
Hitherto, we have abstracted from considering that the signaling role of brand activities may differ across product categories. Implicit in the information economics perspective is that consumers can – and do – rely on brands in their decision making. Recent work by Fischer, Völckner, and Sattler (2010) has shown that product categories do systematically differ in the overall role of brands in consumer decision processes. For example, they found that on average brands play a more decisive role in the life of US consumers when it comes to cigarettes or beer than in paper tissues or headache tablets. Fischer and colleagues further showed that what they call “brand relevance in category” varies between consumers. While on average, brands may play a larger role in the beer category than in the paper facial tissue category, there may be some consumers for which the opposite is true.
Heterogeneity in the relationship between marketing mix activities and brand trust across different categories can be explained by accessibility-diagnosticity theory (Feldman and Lynch 1988). In a category where brands have high relevance for a particular consumer, brands are important to him or her. As a result, he or she is expected to more closely follow brands and their marketing activities in that category (Fischer, Völckner, and Sattler 2010). According to
accessibility-diagnosticity theory, the likelihood that an input will be used for judgment is determined by accessibility of the input in memory (i.e., ease of retrieval), perceived
diagnosticity of the input (i.e., attribute relevance), and availability of other inputs in memory. Factors that increase the accessibility of an input will increase the probability that the input will be used for judgment and decision making (Herr, Kardes, and Kim 1991).2 Drawing on this
19
theory, several studies have shown that when accessibility of brand-related information increases, the likelihood with which consumers use such information as an input for judgment and decision-making increases (e.g., Menon and Raghubir 2003; Li and He 2013). Similarly, we argue that when brands are important to consumers, brand-related information is more accessible to consumers and hence more likely to be used in their attitude formation. As a consequence, according to accessibility-diagnosticity theory, if brands are seen as highly relevant in a given category by a particular consumer, marketing mix activity by a brand in that category is likely to be relatively more strongly associated with that consumer’s brand attitude. Conversely, in a category where brand relevance is low for that consumer, marketing mix activity will exhibit a relatively weaker association with his or her brand attitudes. Thus:
H2: The relevance of brands in a given category to a consumer moderates the (absolute) magnitude of relationships between marketing mix activities and brand trust. If a consumer attaches high (low) relevance to brands in a given category, brand marketing mix activities are strongly (weakly) related to brand trust.
Variation in the Relationship between Marketing Mix Activities and Brand Trust across Countries
20
In countries where brands are important to consumers, marketing activities of brands are more accessible and hence are strongly linked to judgment formation.
The best-known national-cultural systems include the frameworks proposed by Hofstede, Inglehart, Schwartz, and Triandis (see Vinken, Soeters, and Ester 2004 for an overview and comparison). For our purposes, the Inglehart framework (Inglehart and Baker 2000; Inglehart and Welzel 2005) is especially useful because it is grounded in materialism and modernization theory (see Steenkamp and De Jong 2010 and Steenkamp and Geyksens 2014 for applications in marketing). Inglehart identifies four clusters of national-cultural values, which are organized in two bipolar dimensions: traditional versus secular-rational values and survival versus self-expression values. Countries that are low on the traditional/secular-rational dimension
(“traditional” societies) emphasize the importance of deference to authority, along with absolute standards and traditional family values. These societies have high levels of national pride, and take protectionist and nationalist attitudes. Secular-rational societies’ values have the opposite preferences on all of these topics. Important for our purposes is that secular-rational societies are characterized by materialistic ideologies (Inglehart and Welzel 2005, p. 26). Brands – as one of the most visible exponents of a materialistic world (McCracken 1986) – are expected to be of greater relevance in these societies (Rindfleisch, Burroughs, and Wong 2009). Applying the tenets of accessibility-diagnosticity theory in this context suggests that brand-related marketing mix activity is more accessible to consumers in these countries and hence more likely to be used in attitude formation. Thus, we expect that marketing mix activities are more strongly related to brand trust in secular-rational countries than in traditional countries.
21
Countries low on the survival/self-expression dimension (“survival” societies) emphasize economic and physical security. There are strong economic, cognitive, and social constraints on individual choice and autonomy. The opposite applies to countries high on self-expression (“self-expression” societies). In these societies, economic security is less of an issue, and individual autonomy is high. According to Inglehart, the contrast between materialist vs. post-materialist values is a key component of the survival/self-expression dimension (Inglehart and Welzel 2005). This pits values such as security, affluence, and economic well-being against values such as subjective well-being, quality of life, and protection of the environment. In self-expression societies, “the ‘quality of experience’ replaces the quantity of commodities as the prime criterion for making a good living” (Inglehart and Welzel 2005, p. 25). Maximizing well-being rather than maximizing material possessions becomes a guiding motivation to people and their interest in the marketplace for achieving life goals declines (Steenkamp and Maydeu-Olivares 2015).
Postmaterialist priorities are associated with reduced importance of brands as well as strong consumer tendency to avoid marketing influences (Holt 2002). Anecdotally, this is supported by the success of Klein’s (2000) No Logo and Boorman’s (2007) Bonfire of Brands. Therefore, in countries high on self-expression values, marketing mix activities are expected to be weakly related to consumers’ attitude and their trust in brands:
H4: Survival/self-expression cultural values of the country in which consumers live moderate the (absolute) magnitude of relationships between marketing mix activities and brand trust. Brand marketing mix activities are weakly (strongly) related to brand trust in countries high (low) on self-expression values.
Method Data
22
agencies GfK and Kantar Worldpanel in 2015 in 13 countries, including nine developed countries (Denmark, France, Germany, Great Britain, Italy, Netherlands, Spain, Sweden, and United States) and the four BRIC nations (Brazil, Russia, India, China). In each country,
respondents – the person in the household that was responsible for grocery purchases – answered questions regarding a maximum of three CPG brands in a product category. The selected brands were the top three national brands in their category in 2013 (based on annual volume market share). The total number of different product categories included in the survey was 46. The specific categories included varied across countries to reflect usage patterns and needs of GfK and Kantar Worldpanel.
The questionnaire was developed in English and translated into local languages using the back-translation method. Respondents answered questions regarding marketing activities of a brand (i.e., advertising and innovation) and brand trust. Advertising and new product
introduction intensity were operationalized with two items each, using items developed by Steenkamp and Geyskens (2014). Brand trust was operationalized using two items drawn from Chaudhuri and Holbrook (2001). About 50 respondents answered to questions about each brand. Respondents also answered questions regarding brand relevance in category with the four-item scale developed by Fischer, Völckner, and Sattler (2010). To account for differences across consumers, we include several demographic variables (i.e., age, gender, and education level of respondents).
23
annual sales) during 2014. To render the measure for price comparable across categories, we compute z-scores for brand price based on price of the top 10 national brands in each category. To ensure temporal separation the scanner data are from 2014 so that they lag the brand trust measure collected in 2015.
We acquired country data on Inglehart’s cultural values from World Values Survey (WVS). Figure 2.1 illustrates scores on the two Inglehart’s dimensions across the 13 countries in our data (See Figure 2.1). We also obtained a measure of generalized societal trust from WVS to control for cross-country variations in people’s disposition to trust. Variables and their operationalization are summarized in Table 2.1 (See Table 2.1).
We merged the scanner data with consumer survey data to construct our final data set. Our final sample consisted of 35,028 observations from 15,073 respondents and 589 brands across 46 distinct CPG categories in 13 countries (average of 26 CPG categories in each country). Table 2.2 presents category-country combinations in our dataset (as well as grouping them into low, medium, and high categories with respect to their brand relevance ratings; See Table 2.2). We provide examples of brands with low, medium, and high trust (compared to country mean) in Appendix 2.A (See Appendix 2.A).
Cross-National Measurement Validation
Before mean differences between countries can be examined and our hypotheses can be tested in national research, we must establish that the measurement instruments are cross-nationally invariant (Steenkamp and Baumgartner 1998). We first test the configural and metric invariance of the brand relevance scale, using robust estimation. The fit of the one-factor
24
invariance for brand relevance by setting the loadings to be equal across countries. Metric invariance is also supported: χ2(62) = 225.3 (p < 0.01), CFI = 0.993, RMSEA = 0.048. While the difference in chi-square is significant – which is not surprising given our sample size (over 15,000) – overall fit is good, RMSEA which contains a penalty against overfitting stays the same, and the decline in CFI is below 0.01. This supports metric invariance for the brand relevance scale (Cheung and Rensvold 2002).
Next, we test the invariance of all brand level measures simultaneously (i.e., brand trust, advertising intensity, and new product introduction intensity).3 The configural invariance model yields a good fit: χ2(84) = 932.4 (p < 0.01), CFI = 0.992, RMSEA = 0.051. All factor loadings are large (typically exceeding 0.5) and significant. The full metric invariance model yields a good fit as well: χ2(123) = 1,226.0 (p < 0.01), CFI = 0.990, RMSEA = 0.048. Next, we estimate a model where we impose scalar invariance on brand trust.4 Fit deteriorates slightly (χ2(136) = 1,697.9 (p < 0.01), CFI = 0.986, RMSEA = 0.054) but continues to be good and the decline in CFI is below 0.01 (Cheung and Rensvold 2002). These findings support scalar invariance for our dependent variable brand trust and metric invariance for brand relevance, brand trust, advertising intensity, and new product introduction intensity, as well as. Scale items were averaged for each scale to obtain composites.
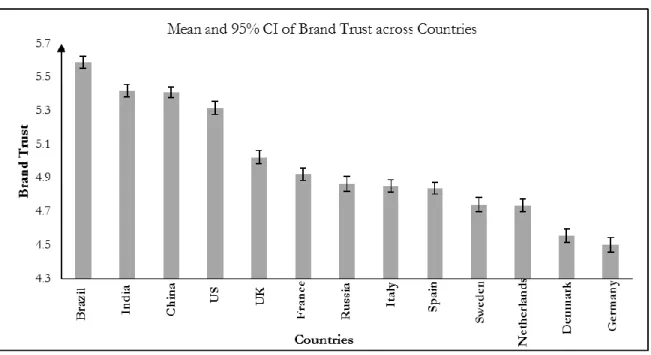
Figure 2.2 shows country means for brand trust, with their 95% confidence intervals (See Figure 2.2). The three countries where brand trust is highest – Brazil, India, and China are all BRIC nations. Noteworthy is also that the US is significantly higher on brand trust than any other developed market. Brand trust is lowest in Denmark and Germany.
3 We use the entire universe of brands covered in the survey data provided by GfK and Kantar Worldpanel.
25 Model and Estimation
Our model consists of variables at three levels: brand, individual, and country. We develop the model step by step by presenting separate equations for each level, and then arriving to one final equation by substitution (Raudenbush and Bryk 2002).
Level 1: Within an individual – Across brands
(1) 𝐵𝑅𝑇𝑅𝑖𝑗𝑘= 𝛼0𝑗𝑘+ 𝛼1𝑗𝑘𝐴𝐷𝑉𝑖𝑗𝑘+ 𝛼2𝑗𝑘𝑁𝑃𝐼𝑖𝑗𝑘+ 𝛼3𝑗𝑘𝐷𝐼𝑆𝑇𝑖𝑘+ 𝛼4𝑗𝑘𝑃𝑅𝐼𝐶𝐸𝑖𝑘+ 𝛼5𝑗𝑘𝑃𝑅𝑂𝑀𝑖𝑘 +𝜀𝑖𝑗𝑘+ 𝑣𝑖𝑘𝑏𝑟𝑎𝑛𝑑
where i denotes the brands, j denotes the individuals, and k denotes the countries in our data. BRTRijk denotes the trust that consumer j in country k has in brand i. ADVijk, NPIijk, DISTik,
PRICEik, and PROMik refer to advertising intensity, new product introduction intensity,
distribution intensity, price, and promotion intensity.5 Equation (1) models brand trust as a function of its marketing mix instruments, a random error term 𝜀ijk, which is normally distributed
with zero mean and variance σ12, and a cross-classified brand random effect νikbrand, which is
normally distributed with zero mean and variance σ22. νikbrand captures brand-specific unobserved
heterogeneity that might impact trust scores. Level 2: Across individuals – Within a country
(2) 𝛼0𝑗𝑘= 𝛽00𝑘+ 𝛽01𝑘𝐵𝑅𝐸𝐿𝑗𝑘+ ∑𝑝=9𝑝=2𝛽0𝑝𝑘𝐷𝐸𝑀𝑂𝐺𝑅𝐴𝑃𝐻𝐼𝐶𝑆𝑝𝑗𝑘 + ∑𝑞=13𝑞=10𝛽0𝑞𝑘𝐶𝐴𝑇𝑇𝑌𝑃𝐸𝑞𝑗𝑘+ 𝑢0𝑗𝑘
(3) 𝛼𝑞𝑗𝑘 = 𝛽𝑟0𝑘+ 𝛽𝑟1𝑘𝐵𝑅𝐸𝐿𝑗𝑘 , for r=1-5
Level 2 specifies all parameters from level 1 as dependent variables. Equation (2) shows that respondents’ average trust in brands in a given category is a function of a country-specific intercept (β00k), the relevance of brands in that category for that respondent (BRELjk), and a
random error term (u0jk). We include several demographic related variables
5DIST
26
(DEMOGRAPHICSpjk) to control for heterogeneity across consumers. We also include four
category dummies (CATTYPEqjk) to account for five different types of CPG categories (i.e., food,
beverage, personal care, household care, and pet food). Equation (3) specifies the slopes of all marketing mixes in level 1 as a function of brand relevance in category.
Level 3: Across countries
(4) 𝛽00𝑘 = 𝛿000+ 𝛿001𝑆𝐸𝐶𝑅𝐴𝑇𝑘+ 𝛿002𝑆𝐸𝐿𝐹𝐸𝑋𝑃𝑅𝑘+ 𝛿003𝑆𝑇𝑅𝑘+ 𝛿004𝐸𝑈𝑅𝑘+ 𝑢00𝑘
(5) 𝛽𝑝0𝑘= 𝛿𝑝00+ 𝛿𝑝01𝑆𝐸𝐶𝑅𝐴𝑇𝑘+ 𝛿𝑝02𝑆𝐸𝐿𝐹𝐸𝑋𝑃𝑅𝑘+ 𝑢𝑝0𝑘, p=1-5
(6) 𝛽𝑞1𝑘= 𝛿𝑞10, q=0-5
(7) 𝛽0𝑟𝑘= 𝛿0𝑟0 , r=2-14
Level 3 incorporates predictors subscripted for the k-th country. Equation (4) specifies the average level of brand trust in a country (β00k) as a function of an intercept (δ000), four
country-specific predictors, and an error term (u00k). SECRATk and SELFEXPRk refer to the
secular-rational and self-expression dimensions, respectively. We include two country-level control variables in our model: STRk and EURk. STRk captures generalized trust in others in a country. It
could be that trust scores are higher in societies that are generally more trusting. In our data, we have 9 European countries; therefore we include a dummy variable (i.e., EURk) to capture
unobserved region-specific effects related to European countries. Equation (4) models cross-national variance in brand trust as a function of the cultural dimensions and an error term (up0k).
27
By successive substitution we arrive at the final model:
(8) 𝐵𝑅𝑇𝑅𝑖𝑗𝑘= 𝛿000+ 𝛿100𝐴𝐷𝑉𝑖𝑗𝑘+ 𝛿200𝑁𝑃𝐼𝑖𝑗𝑘+ 𝛿300𝐷𝐼𝑆𝑇𝑖𝑘+ 𝛿400𝑃𝑅𝐼𝐶𝐸𝑖𝑘+ 𝛿500𝑃𝑅𝑂𝑀𝑖𝑘+ 𝛿010𝐵𝑅𝐸𝐿𝑗𝑘 +𝛿110𝐵𝑅𝐸𝐿𝑗𝑘∗ 𝐴𝐷𝑉𝑖𝑗𝑘+ 𝛿210𝐵𝑅𝐸𝐿𝑗𝑘∗ 𝑁𝑃𝐼𝑖𝑗𝑘+ 𝛿310𝐵𝑅𝐸𝐿𝑗𝑘∗ 𝐷𝐼𝑆𝑇𝑖𝑘+ 𝛿410𝐵𝑅𝐸𝐿𝑗𝑘∗ 𝑃𝑅𝐼𝐶𝐸𝑖𝑘
+𝛿510𝐵𝑅𝐸𝐿𝑗𝑘∗ 𝑃𝑅𝑂𝑀𝑖𝑘+ 𝛿001𝑆𝐸𝐶𝑅𝐴𝑇𝑘+ 𝛿101𝑆𝐸𝐶𝑅𝐴𝑇𝑘∗ 𝐴𝐷𝑉𝑖𝑗𝑘+ 𝛿201𝑆𝐸𝐶𝑅𝐴𝑇𝑘∗ 𝑁𝑃𝐼𝑖𝑗𝑘
+𝛿301𝑆𝐸𝐶𝑅𝐴𝑇𝑘∗ 𝐷𝐼𝑆𝑇𝑖𝑘+ 𝛿401𝑆𝐸𝐶𝑅𝐴𝑇𝑘∗ 𝑃𝑅𝐼𝐶𝐸𝑖𝑘+ 𝛿501𝑆𝐸𝐶𝑅𝐴𝑇𝑘∗ 𝑃𝑅𝑂𝑀𝑖𝑘
+𝛿002𝑆𝐸𝐿𝐹𝐸𝑋𝑃𝑅𝑘+ 𝛿102𝑆𝐸𝐿𝐹𝐸𝑋𝑃𝑅𝑘∗ 𝐴𝐷𝑉𝑖𝑗𝑘+ 𝛿202𝑆𝐸𝐿𝐹𝐸𝑋𝑃𝑅𝑘∗ 𝑁𝑃𝐼𝑖𝑗𝑘
+𝛿302𝑆𝐸𝐿𝐹𝐸𝑋𝑃𝑅𝑘∗ 𝐷𝐼𝑆𝑇𝑖𝑘+ 𝛿402𝑆𝐸𝐿𝐹𝐸𝑋𝑃𝑅𝑘∗ 𝑃𝑅𝐼𝐶𝐸𝑖𝑘+ 𝛿502𝑆𝐸𝐿𝐹𝐸𝑋𝑃𝑅𝑘∗ 𝑃𝑅𝑂𝑀𝑖𝑘
+ ∑ 𝛿0𝑝0𝐷𝐸𝑀𝑂𝐺𝑅𝐴𝑃𝐻𝐼𝐶𝑆𝑝𝑗𝑘 𝑝=9
𝑝=2
+ ∑ 𝛿0𝑞0𝐶𝐴𝑇𝑇𝑌𝑃𝐸𝑞𝑗𝑘
𝑞=13
𝑞=10
+ 𝛿003𝑆𝑇𝑅𝑘+ 𝛿004𝐸𝑈𝑅𝑘+ 𝛹𝑖𝑗𝑘
δ100, δ200, δ300, δ400, andδ500 represent the main effect relations of marketing mix instruments
with brand trust, thereby testing H1. δ110, δ210, δ310, δ410, andδ510 represent the moderating effect of
brand relevance on the relation between marketing mix instruments and brand trust (H2). δ101, δ201,
δ301, δ401, andδ501 represent the moderating role of secular-rational values (H3) and δ102, δ202, δ302,
δ402, andδ502 test the moderating role of self-expression values (H4).
We use within-group centering at levels 1 and 2 and grand-mean centering at level 3. We estimate the model with iterative maximum likelihood, which permits a simultaneous estimation of relationships at multiple levels.
Endogeneity and Common Method Variance
28
brand relevance in a category and brand trust; one could argue that when consumers trust brands in a particular category, brands become more relevant in their decision making in that category. Moreover, there could be unobserved variables that influence both marketing activities and brand trust. For example, unobserved brand-country effects like access to capital, managerial talent, suppliers, and social media capabilities can affect both trust and marketing investment. Hence, the association between marketing mix instruments and brand trust can be overstated if, for example, managerial talent drives both. Additionally, the same individuals who rate brand trust also rate advertising intensity, new product introduction intensities, and brand relevance in category. This could lead to common method bias. In order to fully address the common method bias issue and partially account for endogeneity concerns, we generate instrumental variables.6
We exploit the multimarket nature of our dataset to construct valid instruments (Hausman 1996; Nevo 2001). We obtain meaningful instrumentation for marketing mix instruments by using a brand’s average marketing mix values in the same category across other countries in which the brand operates. To ensure that the IVs are correlated with the endogenous variables, we divide countries into three groups based on GDP per capita.7 If a brand exists in the same category in similar countries (i.e., same GDP per capita group), we use the average value of its marketing mix instruments in such countries; if not, we use average values of its marketing mix across all other countries. If the focal brand does not appear in any other country (in the same product category), we expand the procedure to other brands of the same manufacturer as well as
6 In the limitation section, we will discuss certain types of endogeneity concerns that our approach does not address. As such, even with instruments, our findings should still be interpreted as correlational rather than causal.
29
similar product categories (first in the same country group, next across all countries).8 For the remaining brands in the data for which we do not find matches in other countries and categories, we use the average value of marketing mix instruments of all brands in the same product
category across other countries. Our instruments are valid because 1) marketing mix instruments of a brand should be correlated across different markets (Che, Sudhir, and Seetharaman 2007) and 2) since market-specific valuations are independent across markets (Ghose, Ipeirotis, and Li 2012), marketing activities of a brand in country X does not directly affect customers’ level of trust in the focal brand in country Y (i.e., they only indirectly influence customers’ level of trust in the focal brand through their effect on marketing mix instruments of the focal brand).
Similarly, for brand relevance in category, we use average BREL values in other countries (first we use countries in the same GDP group, if there are no matches, we use all other countries). An important advantage of our approach is that it also addresses the common method bias problem. The instruments that we use for advertising intensity, new product introduction intensity, and brand relevance in category are obtained from responses by other respondents across different countries. According to Podsakoff et al. (2003), having different respondents score criterion versus predictor variables is the best method to address common method bias.
To assess instrument strength, we regress each endogenous variable first against the exogenous variables in the brand trust model and then add the instruments to conduct an incremental F-test. The instruments are sufficiently strong, as evidenced by the first-stage R-squared and F-statistics. Across the six scenarios, we obtain an average R-R-squared of 30%, and all incremental values exceed the common threshold of ten (on average, the incremental F-values are 3,021). We estimate six predicted residuals from the first-stage regressions and then
30
add the estimated residuals as control functions to the main model specification (Petrin and Train 2010). Given that the instruments are valid and not weak, we use the Hausman-Wu test to
formally probe for endogeneity of marketing mix instruments and brand relevance. The results confirm existence of endogeneity for advertising intensity, price promotion intensity, and brand relevance in category (p < 0.10).
Results
Model-Free Evidence
In Appendix 2.B we present model-free evidence regarding the relationship between marketing mix instruments and brand trust as well as the heterogeneity in the relationship between marketing mix and brand trust across different categories and countries (See Appendix 2.B). Groups with high (low) values of a particular variable (e.g., ADV, BREL, etc.) represent observations that are at least one standard deviation above (below) mean of that variable. The evidence indicates that brands with high advertising intensity, new product introduction intensity, distribution intensity, and price are more trusted than other brands. However, brands that promote intensively are trusted less than those with low promotional intensity. Moreover, the positive (negative) relationship between marketing mix and brand trust appears to be stronger in categories high on brand relevance, countries high on secular-rational values, and countries high on survival values.
Model Fit
31
models are nested, we can assess whether model fit improves significantly by comparing the deviance statistic (-2 log likelihood) between models. We start by a simple model without any covariates and with only a constant and a random term (M1). Adding the random intercept at the individual level (M2) yields a significant improvement in model fit (Δdev(1) = 4,729.4 , p < 0.01). Next, we allow for mean differences in trust between countries (See Figure 2.2) by adding a random intercept at the country level (M3). Fit improves significantly (Δdev(1) = 1,338.2, p < 0.01). These results highlight that there exists significant variation in brand trust within and across countries, which reinforces the need to explore the effects of brand, category, and country level variables on brand trust. Model 4 adds the control variables, the main effects of brand relevance and national culture, and the brand random effect and model fit improves significantly (Δdev(7) = 3,840.8, p < 0.01). Model 5 adds the main effects of the marketing mix instruments. The improvement in model fit (Δdev(5) = 3,610.4, p < 0.01) shows that marketing mix activities explain the variation in brand trust. In model 6 we add country level random slopes for
marketing mix instruments and the six control functions (Δdev(11) = 558.4, p < 0.01). Next, we add the five interactions between BREL and marketing mix instruments (M7). Model fit
improves significantly (Δdev(5) = 149.8, p < 0.01), which indicates that the effect of the
32 Hypothesis Testing
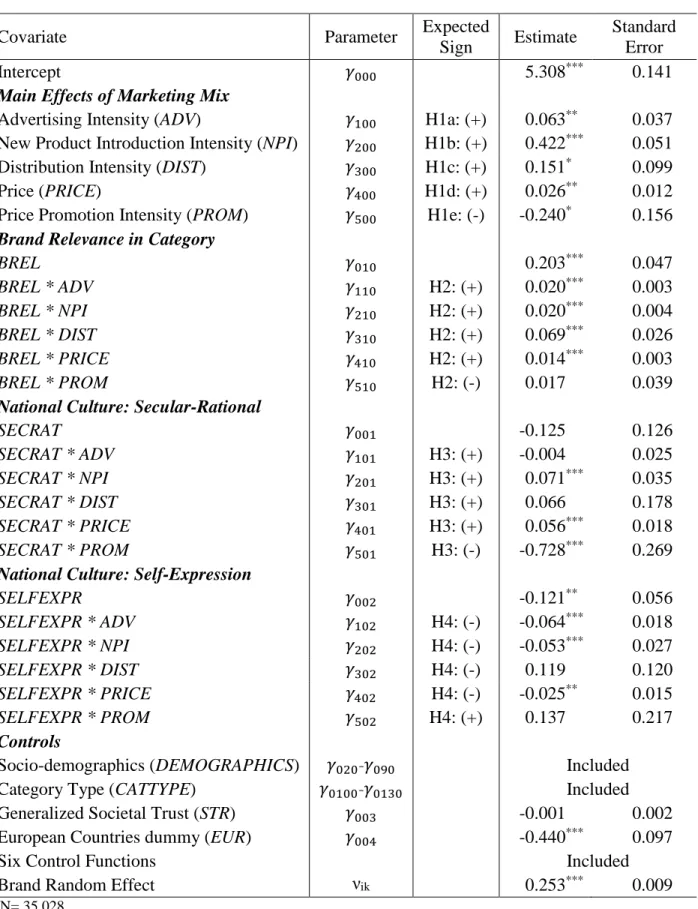
Parameter estimates for model M8 are reported in Table 2.4 (See Table 2.4). Note that we report unstandardized coefficients. In multilevel modeling, standardized coefficients are
problematic because variance is partitioned across different levels. Advertising intensity (γ100 = 0.063; p < 0.05), new product introduction intensity (γ200 = 0.422; p < 0.01), distribution
intensity (γ300 = 0.151; p < 0.10), and price (γ400 = 0.026; p < 0.05) are positively related to brand trust, while price promotion intensity is negatively related to brand trust (γ500 = -0.240; p < 0.10). These results support H1 implying that more advertising, new product introduction, distribution, and higher prices are associated with higher brand trust, whereas heavy price promotions are negatively related to brand trust.
The Moderating Role of Brand Relevance. The coefficient for the main effect of brand
relevance is positive and significant (γ010 = 0.203; p < 0.01) suggesting that in categories in which brands are important for consumers, brand trust is higher. Turning to the individual interaction effects, we find that advertising intensity (γ110 = 0.020; p < 0.01), new product introduction intensity (γ210 = 0.020; p < 0.01), distribution intensity (γ310 = 0.069; p < 0.01), and price (γ410 = 0.014; p < 0.01) are more strongly associated with brand trust in categories with high brand relevance vis-à-vis categories with low brand relevance. However, brand relevance in category does not moderate the negative relationship between price promotion intensity and brand trust (γ510 = 0.017; p > 0.10). In sum, these results support our hypothesis that the degree to which brands are relevant to a consumer systematically affects the impact of marketing mix activities on brand trust. We find further evidence for the moderating role of BREL for four out of five individual marketing instruments as specified in H2.
33
(See Figure 2.3). We use one standard deviation above and below country level mean of our focal variables as high and low values to evaluate their moderating impact (See Table 2.2 for classification of categories).9 We also report simple slopes and their statistical significance in Figure 2.3. We find that in low BREL categories, distribution and price are not significantly related to brand trust, the relationship between advertising and brand trust is weak but significant, and the relationship between new product introductions and brand trust remains strong and significant. Conversely, in high BREL categories the relationships between brand trust and marketing activities are all significant.
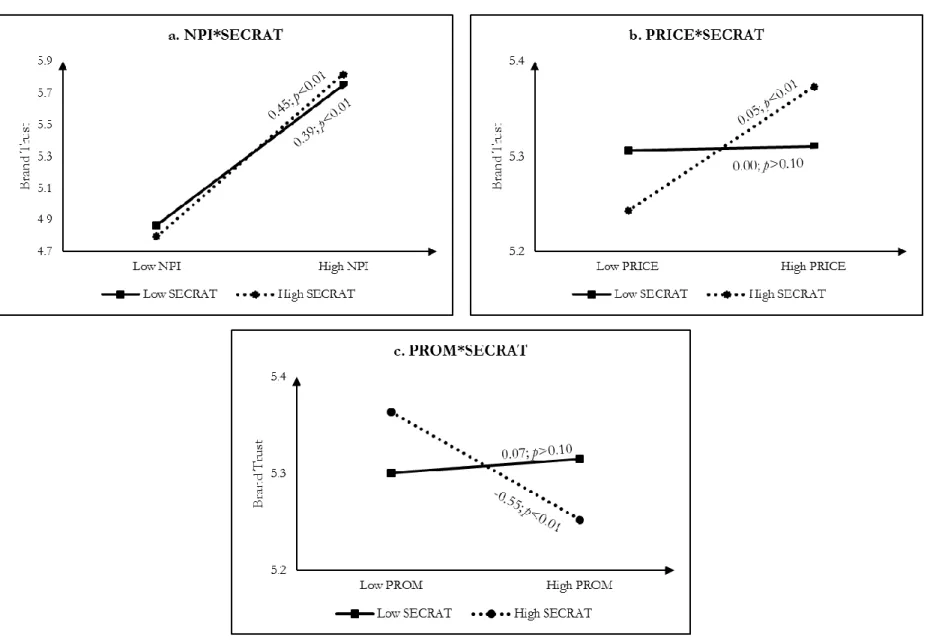
The Moderating Role of Secular-Rational National Culture Dimension. H3 posits that a
country’s score on the secular-rational dimension moderates the strength of the relation between brand marketing mix activities and brand trust, and more specifically that the relation is stronger in countries that are high on this dimension. We find significant interactions in the direction specified in H3, albeit not for all instruments. Consistent with H3, we find that new product introduction intensity (γ201 = 0.071; p < 0.01), price (γ401 = 0.056; p < 0.01), and price promotion intensity (γ501 = -0.728; p < 0.01) are more strongly associated with brand trust in countries high on secular-rational values vis-à-vis countries low on secular-rational values. However, the interactions for advertising and distribution intensity are not significant. Figure 2.4 depicts the significant interactions graphically (See Figure 2.4). The most prominent associations are found for price and price promotion. In low SECRAT countries, price and price promotion are not significantly related to brand trust while their relationships with brand trust are significant in high SECRAT countries.
34
The Moderating Role of Self-Expression National Culture Dimension. We find that brands
are less trusted in countries high on self-expression values (γ002 = -0.121; p < 0.05). This finding is consistent with previous research, which argued that brands are expected to do worse in post-materialistic countries (Holt 2002; Steenkamp and Geyskens 2014). We find significant
interactions in the direction specified in H4, albeit not for all marketing mix instruments. Consistent with H3, we find that advertising intensity (γ102 = -0.064; p < 0.01), new product introduction intensity (γ202 = -0.053; p < 0.01), and price (γ402 = -0.025; p < 0.05) are more strongly related to brand trust in countries low on self-expression values vis-à-vis countries high on self-expression values. However, the interactions for price and price promotion intensity are not significant. Figure 2.5 depicts the significant interactions graphically (See Figure 2.5). The most prominent relations are found for advertising intensity and price. In high SELFEXPR countries, change in advertising intensity and price are not significantly related to the level of brand trust. However, in low SELFEXPR countries, increase in price and advertising intensity is associated with higher brand trust.
Control Variables. Generalized societal trust (STR) is not significantly related to brand trust
(γ003 = -0.001; p > 0.10), but we find that brands are less trusted in European countries (γ004 = -0.440; p < 0.01). This finding is in line with the fact that private labels have become increasingly popular in European countries to the point that in 2014, private label market share exceeded 30% in 15 countries, including Spain (51%) and Switzerland (53%).10 With regards to
sociodemographics, we find that while age is not significantly related to brand trust (γ020 =
35
0.001; p > 0.10),11 women have lower trust in brands than men (γ030 = -0.057; p < 0.01). We also find that brands in personal care (γ0120 = -0.114; p < 0.01) and animal food (γ0130 = -0.281; p < 0.01) product categories are less trusted compared to brands in other categories.
Developed Countries vs. BRIC Countries
Finally, we examine differences in the relationships between marketing mix activities and brand trust between developed and BRIC countries in an exploratory fashion. We do not have a priori expectations about differences in effects, but given the rapidly growing importance of emerging markets in general and the BRIC nations in particular and the relative dearth of substantive findings in these markets (Burgess and Steenkamp 2006; Narasimhan, Srinivasan, and Sudhir 2015), this seems a worthwhile endeavor. We run separate analyses on the BRIC countries and on the developed countries with only the marketing mix instruments as regressors. Table 2.5 provides the results (See Table 2.5).
We find that advertising and price are more strongly related to brand trust in BRIC countries than in developed markets. Because brands have been around less long in emerging markets, knowledge about products and brands is generally less deep than in developed markets (Dawar and Chattopadhyay 2002). In these contexts, advertising fulfills a more important role in creating brand awareness and communicating the brand message (Pauwels, Erguncu, and Yildirim 2013). Furthermore, since advertising pressure is generally less in emerging markets, heavy advertising for a brand stands out more, i.e., there is less clutter, which should positively affect its effect (Danaher, Bonfrer, and Dhar 2008). The larger role of price in emerging markets is consistent with recent research that showed that while consumers in emerging markets are more price
36
conscious, they also rely more on price as indicator to infer product performance (Zielke and Komor 2015). Distribution has a strong relationship with brand trust in developed markets but not in BRIC countries. This may be due to the fact that in emerging markets, informal
distribution and small and relatively unsophisticated mom-and-pop shops play a large role while in developed markets, brands are almost exclusively offered in large, sophisticated, and
expensive looking supermarkets (Child, Kilroy, and Naylor 2015). Such outlets have more characteristics of expensive brand-specific capital expenditures that signal sunk costs.
Robustness Checks
We use a median-split analysis to assess the robustness of our findings. Based on the median value of BREL, we divide observations into two groups (high BREL and low BREL).
Furthermore, we conduct a median split of the countries based on their secular-rational score and a median split of the countries based on their self-expression score. We estimate the relationship between marketing mix and brand trust for each group separately. Dichotomizing continuous variables reduces the statistical power for detecting effects (Irwin and McClelland 2001) and as such the median-split analysis is a conservative test of hypotheses. We replicate the direction of the effects, and 9 out of 10 significant interactions in these analyses. More specifically, we find that advertising, new product introduction, price, and distribution are more strongly related to brand trust in the high BREL group vis-à-vis the low BREL group (See Table 2.6). Price and price promotion are more strongly related to brand trust in countries high on the secular-rational dimension vis-à-vis countries that score low on this dimension. Finally, advertising, new product introduction, and price have stronger relationship with brand trust in countries low on self-expression vis-à-vis countries high on this dimension.
37
separate analyses, excluding each country once. In Appendix 2.C, we report the number of times each hypothesis was supported at 0.05 and 0.10 levels across the 13 analyses (See Appendix 2.C). We find that our findings are highly robust.
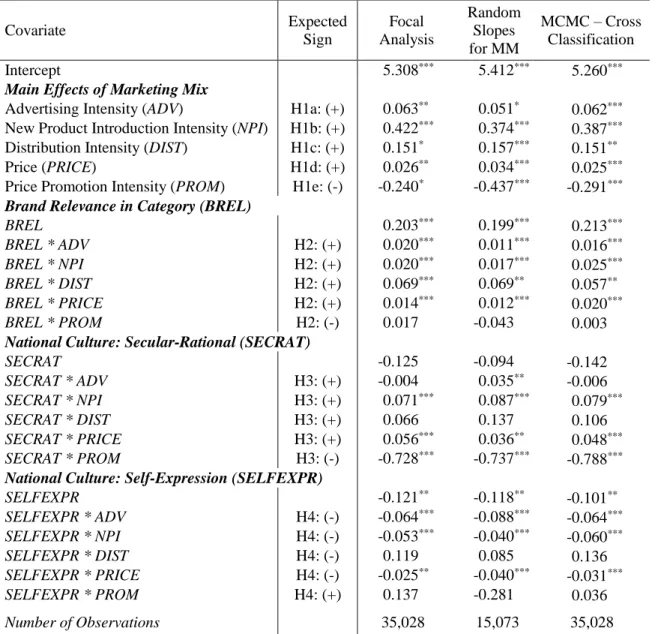
Our focal analysis accounts for the fact that different brands might have different levels of trust by including a cross-classified brand random effect (𝑣0𝑗𝑘𝑏𝑟𝑎𝑛𝑑). However, given that individuals are not fully nested within brands (i.e., one individual rates several brands) and brands are not fully nested within countries (i.e., one brand might exist in several countries), estimating random slopes for marketing mix at the brand level (which is cross-classified) is not computationally feasible in an HLM setting. This means that our focal analysis does not allow for the possibility that marketing mix instruments of different brands might have heterogeneous impact on brand trust. We address this concern using two different procedures.
In the first approach, we randomly keep one observation for each individual. Now that each respondent has only one response in the data, we do not need to model level 1 (within an individual). The new model would have brands and countries as cross-classified levels, with random slopes for marketing mix instruments at the brand level. The results which are similar to our focal analysis are reported in Table 2.7 (See Table 2.7).