DEVELOPMENT OF MULTIPLEXABLE BIOSENSORS TO QUANTIFY THE SPATIOTEMPORAL DYNAMICS OF RHO GTPASES AND PROTEIN KINASES
IN THE SAME LIVING CELL
Chia-Wen Hsu
A dissertation submitted to the faculty of the University of North Carolina at Chapel Hill in partial fulfillment of the requirements for the degree of Doctor of Philosophy in the
Division of Chemical Biology and Medicinal Chemistry at the Eshelman School of Pharmacy
Chapel Hill 2012
Approved by:
iii ABSTRACT
CHIA-WEN HSU: Development of Multiplexable Biosensors to Quantify the Spatiotemporal Dynamics of Rho GTPases and Protein Kinases in the Same Living Cell
(Under the direction of Dr. Klaus M. Hahn)
Cell motility is a highly dynamic and heterogenous cellular process regulated by the coordination of multiple Rho GTPases, Src family kinases, and the mitogen-activated protein kinase (MAPK) cascades. However, it has been difficult to monitor more than two protein activities in the same cell due to the overlapping spectra of current biosensors and biological perturbations at high biosensor concentrations. Dye-based biosensors, which rely on an affinity scaffold that binds only to the activated conformation of the endogenous targets and an environment-sensing dye that changes its fluorescence properties to report the specific binder-target interactions, possess great potential to monitor multiple endogenous targets in the same cell. Here, I created novel environment-sensing dyes and exploited novel affinity scaffolds to develop multiplexable dye-based biosensors capable of quantifying the spatiotemporal dynamics of multiple Rho GTPases and protein kinases in the same cell.
iv
multiplexible biosensors. The relative timing and the subcellular localization of active Cdc42 and Src during leading edge dynamics and during pinocytosis were revealed using the new dyes.
Src also plays an important role in the MAPK-mediated cell motility. However, the precise roles of MAPKKs and MAPKs at the leading edge remain poorly characterized due to the lack of sensitive biosensors for each target. By taking advantage of the specific interactions between MAPKKs and MAPKs, I developed the first substrate-based biosensor designs to report the activity of endogenous MEK1/2 and MKK3/6. I also developed a sensitive ERK1/2 biosensor based on artificial binders through collaborations with the Plűckthun group.
v
DEDICATION
To my parents Chun-Tseng Hsu and Yu-Yun Lin for their constant support and care throughout out my life.
vi
ACKNOWLEDGEMENTS
First I would like to express my most sincere thanks to my advisor Prof. Klaus Hahn. His great insight, patience, and critical thinking have nurtured me to be a better scientist. I am happy to have so many exciting, challenging, and highly interdisciplinary projects that forced me to exploit my creativity as much as I can and immerse myself in various disciplines. As a foreign student, I am fortunate to have an advisor like Prof. Hahn who is willing to take his time to improve my writing and presentation skills. More importantly, because of his close mentorship, I have become a chemist who not only knows how to make useful tools but also knows how to quantify cell biology to extract new information.
vii
viii
cell lines that I found very useful for characterization and applications of my new dye-based biosensors. I truly thank Dr. Jason Yi who frequently shares interesting science stories and makes me more positive about science. I especially thank Dr. Chris MacNevin, Dr. Jon Zawistowiski, Dr. Scott Slattery, and Dr. Li Li for reviewing this dissertation.
ix
obtain the first FLIM image of dye-based biosensors with his help. I thank Dr. Tilo Mathes in the Hegemann group for providing valuable reagents and for his support in the caging project. I also thank Dr. Arlene Bridges and Dr. Wanda Bodnar for their assistance in mass spectrometry.
x
xi PREFACE
“When you want something,
xii
TABLE OF CONTENTS
ABSTRACT ... iii
DEDICATION...v
ACKNOWLEDGEMENTS ... vi
PREFACE ... xi
TABLE OF CONTENTS ... xii
LIST OF TABLES ...xv
LIST OF FIGURES ... xvi
LIST OF ABBREVIATIONS ... xxi
CHAPTER 1. LONG WAVELENGTH MEROCYANINE DYES . FOR MULTIPLEXED LIVE CELL IMAGING ...1
1.1 Summary ... 1
1.2 Introduction and Background ... 1
1.2.1 Protein-based biosensors for live cell imaging ... 3
1.2.2 Solvatochromism ... 9
1.2.3 Recent progress of near infrared dye-based probes . for live cell imaging applications ... 14
1.3 Results and Discussion ... 21
1.3.1 Design and synthesis of near infrared merocyanine dyes ... 21
xiii
1.3.3 Synthesis and spectral properties of thiol-reactive
. NIR merocyanine dyes ... 41
1.3.4 Construction of red-shifted biosensor designs using . NIR merocyanine dyes ... 47
1.3.5 Live cell imaging of a red-shifted SFK activity sensor ... 54
1.3.6 Characterization of a red merocyanine dye . with an intrinsic ratiometric response ... 55
1.3.7 Co-imaging the spatiotemporal dynamics of endogenous . Cdc42 and SFK activation in the same living cell ... 66
1.3.8 Fluorescence lifetime imaging of dye-based biosensors ... 69
1.4 Conclusions ... 71
1.5 Materials and Methods ... 74
CHAPTER 2. DYE-BASED BIOSENSORS TO QUANTIFY . THE SPATIOTEMPORAL DYNAMICS OF . MAPKK AND MAPK IN LIVING CELLS ...…89
2.1 Summary ... 89
2.2 Introduction and Background ... 91
2.2.1 Overview of MAPK signaling ... 91
2.2.2 Structures and regulation of MAPKs and MAPKKs ... 96
2.2.3 Current biosensor designs for reporting spatiotemporal . dynamics of MAPK signaling in live cells ... 108
2.3 Results and Discussion ... 112
2.3.1 Biosensor designs based on dye-labeled ERK2 ... 112
2.3.2 Selection of sites for dye attachment in ERK2 ... 117
xiv
2.3.4 Preparation of test MEK proteins for fluorescence screening ... 131
2.3.5 Preparation of test proteins for specificity screening ... 134
2.3.6 Properties of dye-labeled ERK2 ... 136
2.3.7 Mechanisms of action of dye-labeled ERK ... 138
2.3.8 Fluorescence screening of MEK1/2 activity sensors ... 144
2.3.9 Construction of dye-labeled ERK-EGFP for ratio imaging ... 148
2.3.10 Live cell imaging of dye-labeled ERK2 ... 150
2.3.11 Correlation of biosensor properties with . protein stability predictions... 152
2.3.12 Future directions: . Designing more stable MEK1/2 activity sensors ... 157
2.3.13 Generation of MKK3/6 activity sensors . based on dye-labeled p38α ... 160
2.3.14 Characterization of an ERK activity biosensor . based on artificial binders ... 166
2.4 Conclusions ... 172
2.5 Materials and Methods ... 173
xv
LIST OF TABLES
Table 1.1 Spectral properties of near infrared merocyanine dyes. ... 30 Table 1.2 Spectral properties of ratiometric merocyanine dyes. ... 58 Table 2.1 Comparison of the reported biosensors for . ERK and JNK MAPKs. ... 109
Table 2.2 Summary of known mutations in ERK2 that cause altered . binding affinity and/or phosphorylation kinetics of ERK2. ... 126
xvi
LIST OF FIGURES
Figure 1.1 Exisitng designs of protein-based biosensors. ... 4
Figure 1.2 Brightness and excitation maxima of . fluorescent proteins and organic dyes. ... 7
Figure 1.3 Jabloński diagrams of regular fluorescence . and solvatochromism. ... 10
Figure 1.4 Mechanisms of dye-based biosensors. ... 12
Figure 1.5 Biosensor designs for Cdc42 and SFKs. ... 14
Figure 1.6 Examples of NIR dyes for live cell imaging applications. ... 15
Figure 1.7 Design of red-shifted merocyanine dyes. ... 23
Figure 1.8 Structures of red-shifted merocyanine dyes. ... 24
Figure 1.9 Synthesis of donor and acceptor moieties of . red-shifted merocyanine dyes. ... 25
Figure 1.10 Synthesis of red-shifted merocyanine dyes. ... 26
Figure 1.11 Relative photostabilities of NIR merocyanine dyes. ... 28
Figure 1.12 Solvent-sensitive fluorescence of NIR merocyanine dyes. ... 31
Figure 1.13 Solvent-sensitive fluorescence lifetime values of . red and NIR merocyanine dyes. ... 32
Figure 1.14 Fluorescence decays of mero79 in MeOH, BuOH, . and DMSO. ... 34
Figure 1.15 Effects of pH on the fluorescence properties . of NIR merocyanine dyes ... 35
Figure 1.16 Effects of viscosity on the fluorescence . properties of NIR merocyanine dyes. ... 36
xvii
Figure 1.18 Effects of water on the excitation and emission . properties of NIR merocyanine dyes. ... 39 Figure 1.19 Fluorescence responses of mero79 and mero80 to BSA. ... 40
Figure 1.20 Synthesis of thiol-reactive NIR merocyanine dyes with . a sulfate group on the alkyl side chain ... 43
Figure 1.21 Synthesis of thiol-reactive NIR merocyanine dyes with . a sulfate group on the aromatic ring of the electron donor. ... 44
Figure 1.22 Solvent-sensitive fluorescence of thiol-reactive and . water soluble NIR merocyanine dyes. ... 45
Figure 1.23 Concentration-dependent of thiol-reactive NIR . merocyanine dyes in water. ... 46
Figure 1.24 Absorption spectra of mero77 (I-SO-IAA) and . mero77-labeled sensor proteins. ... 47 Figure 1.25 Basal brightness and maximum fluorescence change . of NIR SFK and Cdc42 biosensors. ... 48 Figure 1.26 In vitro fluorescence response of mero77- and . mero78-labeled SFK biosensors. ... 50 Figure 1.27 In vitro fluorescence response of NIR Cdc42 biosensors. ... 51
Figure 1.28 Fluorescence lifetime changes of dye-labeled Cdc42 . sensors titrated with constitutively active Cdc42. ... 52
Figure 1.29 Fluorecence decays of mero65- and . mero77-labeled Cdc42 biosensors. ... 53
Figure 1.30 Live cell imaging of a NIR mero65-labeled . SFK biosensor in NIH 3T3 MEF cells. ... 55 Figure 1.31 Resonance forms of merocyanine dyes. ... 57 Figure 1.32 Fluorescence response of a mero199-labeled . Cdc42 biosensor. ... 59
xviii
Figure 1.34 Cdc42 biosensor ratios at the protrusion sites . of MEF cells. ... 63
Figure 1.35 Endogenous Cdc42 became more activated during cell . spreading as initiated by a photoactivatable Rac. ... 64
Figure 1.36 Filter and dichroic setting for co-imaging CFP, . mero199 and mero65 channels in the same cell. ... 66 Figure 1.37 Co-imaging of spatiotemporal dynamics of . endogenous SFKs and Cdc42 in the same living cell. ... 68 Figure 1.38 Fluorescence lifetime imaging of . mero87-labeled ERK biosensor in MEF cells. ... 70 Figure 1.39 Reaction tracking of the formation of . dye-chloroacetamide conjugates. ... 86
Figure 2.1 Overview of MAPK signaling in cell motility. ... 92 Figure 2.2 Structures and regulation of MAPKs. ... 93 Figure 2.3 Cancer-relevance of mutations in the ERK pathway . and structures of human MAPKKs. ... 95 Figure 2.4 Structures of MAPKKs and MAPKK complexes, . and a model of a MEK1-MEK2 heterodimer. ... 96
Figure 2.5 Signal specificity of MEKs and ERKs . is regulated by subsets of scaffold proteins. ... 99
Figure 2.6 Structures of MAPKs in complex with full length proteins . or synthetic peptides derived from ERK-interacting proteins. ... 103
Figure 2.7 Putative binding interfaces of ERK . and ERK-interacting proteins predicted by PRISM... 106 Figure 2.8 Existing biosensor designs for ERK and JNK. ... 110 Figure 2.9 Rational designs of ERK biosensors . and MEK1/2 biosensors based on dye-labeled ERK2. ... 113 Figure 2.10 Work flow for developing ERK biosensor . and MEK biosensors based on dye-labeled ERK2. ... 115
xix
Figure 2.12 Solvent accessible surface area (SASA) analysis
. of each residue in ERK2. ... 118
Figure 2.13 Local hydrophobic property of each residue in ERK2. ... 120
Figure 2.14 Potential docking sites of ERK-interacting proteins. ... 123
Figure 2.15 Expression and purification of ERK mutant proteins... 130
Figure 2.16 Expression and purifcation of active MEK proteins. ... 132
Figure 2.17 Purified ERK-interacting proteins and controls . for specificity test. ... 134
Figure 2.18 Spectral properties of dye-labeled ERK2 conjugates. ... 135
Figure 2.19 Assessment of phosphorylation kinetics . of ERK2 mutants... 138
Figure 2.20 Fluorescence titration of 50 nM dye-labeled ERK2. ... 142
Figure 2.21 Characterizaiton of dye-labeled ERk2 F329C. ... 143
Figure 2.22 Maximum fluorescence change of dye-labeled ERK2. ... 144
Figure 2.23 Fluorescence response of mero87-labeled ERK2 . against ERK regulators, ERK substrates, and control proteins. ... 145
Figure 2.24 Construction of ERK-EGFP fusion proteins . for ratio imaging. ... 149
Figure 2.25 Live cell images of a MEK1/2 activity sensor. ... 151
Figure 2.26 Calculated ΔΔG for all tested biosensor constructs. ... 154
Figure 2.27 Correlation of experimental data with . predicted protein stability of biosensor proteins. ... 156
Figure 2.28 Estimated ∆∆G of cysteine mutations in ERK2. ... 158
Figure 2.29 Rational designs of MKK3/6 activity sensors . based on dye-labeled p38α. ... 162
xx
xxi
LIST OF ABBREVIATIONS
ADP Adenosine diphosphate
ARF-GAP ADP ribosylation factor GTPase activating protein AIE Aggregation-induced emission
AMP-PNP Adenylyl-imidodiphosphate AP-1 Activation protein-1
ATP Adenosine triphosphate
ATP-γS Adenosine 5'-O-(3-thio)triphosphate BCA assay Bicinchoninic acid assay
Bcl-2 B cell lympoma 2 BHQ Black hole quencher
BiFC Bimolecular fluorescence complementation BODIPY Boron-dipyrromethene
BSA Bovine serum albumin CBD Cdc42-binding domain CD site Common docking site
Cdc42 Cell division control protein 42 Cdk5 Cyclin-dependent kinase 5
CFP Cyan fluorescent protein homolog CLIP 170 Cytoplasmic linker protein of 170 kDa cpFP Circularly permuted fluorescent protein cPLA2 Calcium-dependent phospholipase A2
c-Myc c-Fos and v-myc myelocytomatosis viral oncogene homolog CREB Cyclic AMP response element-binding protein
xxii DARPin Designed ankyrin repeat protein DCDHF Dicyanomethylenedihydrofuran DIC Differential interference contrast DLK Dual leucin-zipper kinase
DMEM Dulbecco's Modified Eagle Medium
DMF Dimethyl formamide
DMSO Dimethyl sulfoxide DTT Dithiothreitol
DUSP Dual specificity phosphatase
EA Ethyl acetate
EDTA Ethylenediaminetetraacetic acid
EE Early endosome
EGF Epidermal growth factor
EGFP Enhanced green fluorescent protein eIF-4E Eukaryotic initiation factor-4E
ELK-1 E twenty-six (ETS)-like transcription factor 1 ER Endoplasmic reticulum
ERK Extracellular signal-regulated kinase ESI Electrospray ionization
EV Endocytic vesibles FAK Focal adhesion kinase FBS Fetal bovine serum FGF Fibroblast growth factor
xxiii FRET Förster resonance energy transfer
FRG FGD1-related Cdc42-guanine nucleotide exchange factor GDP Guanosine diphosphate
GEF Guanine nucleotide exchange factor GFP Green fluorescent protein
GIT GPCR kinase interacting protein GPCR G protein-coupled receptor
GRB2 Growth factor receptor-bound protein 2 GST Glutathione S-transferase
GTP Guanosine triphosphate
HEK 293 Human Embryonic Kidney 293 cells
HEPES 4-(2-Hydroxyethyl)-1-piperazineethanesulfonic acid HePTP Hematopoietic protein-tyrosine phosphatase
HGF Hepatocyte growth factor
HPLC High performance liquid chromatography HRMS High-resolution mass spectrometry HRP Horseradish peroxidase
HSP27 Heat shock protein-27 HTS High throughput screening IPTG β-D-1-thiogalactopyranoside
IQGAP1 IQ motif containing GTPase activating protein 1 JIP1 c-Jun N-terminal kinase interacting protein 1 JNK c-Jun N-terminal kinase
KEGG Kyoto Encyclopedia of Genes and Genomes KIM Kinase interaction motif
xxiv LB-agar Luria-Bertani agarose
LC-MS Liquid chromatography-mass spectrometry LOV2 Light, oxygen, voltage-sensing domain LRMS Low-resolution mass spectrometry LUMO Lowest unoccupied molecular orbitals MALDI Matrix-assisted laser desorption/ionization MAPK Mitogen-activated protein kinase
MAPKAPK MAPK activated protein kinase
MAPKK Mitogen-activated protein kinase kinase MAPKKK Mitogen-activated protein kinase kinase kinase MBP Maltose-binding protein
MDCK cells Madin Darby canine kidney cells MEF Mouse embryo fibroblast
MEF2 Myocyte enhancer factor-2
MeOH Methanol
mRFP1 Monomeric red fluorescent protein NFκB Nuclear factor κB
NFAT3 Nuclear factor of activated T cells-3 MLCK Myosin light chain kinase
MLK3 Mix lineage kinase 3
MK2 MAPK activated protein kinase 2
MKP MAPK phosphatase
MNK MAPK interacting kinase MORG-1 MAPK organizer 1
MP-1 MEK-partner 1
xxv NES Nuclear export signal
NIR Near infrared NLO Non-linear optical
NLS Nuclear localization signal NMR Nuclear magnetic resonance NSCLC Non-small cell lung cancer PAK p21-activated protein kinase PA-Rac Photoactivatable Rac GTPase PBD Periplasmic binding protein PDGF Platelet-derived growth factor
PEA-15 Phospho-enriched protein in astrocytes 15 PET Photo-induced electron transfer
PI3K Phosphoinositide 3-kinase
2p-FLIM Two-photon fluorescence lifetime imaging microscopy PMA Phorbol-12-myristate-13-acetate
PMMA Poly methylmethacrylate
PMSF Phenylmethanesulfonylfluoride or phenylmethylsulfonyl fluoride POPC Palmitoyl oleoyl phosphatidyl choline
PP2A or PP2 Protein phosphatase 2 PPI Protein-protein interaction
PRISM Protein-protein interaction prediction by structural matching PTP Protein tyrosine phosphatase
PVDF Polyvinylidene fluoride PXNα Paxillin α
Q-TOF Quadrupole time-of-flight
xxvi
RE Recycling endosomes
RhoGDI Rho GDP-dissociation factor rRNA Ribosomal ribonucleic acid RSK Ribosomal protein S6 kinase RTK Receptor tyrosine kinase SASA Solvent accessible surface area SDM Site-directed Mutator
SDS-PAGE Sodium dodecyl sulfate polyacrylamide gel electrophoresis Sef Similar expression to FGF genes
SFK Src family kinase
SH3 SRC Homology 3 Domain
SNAPP Simplicial neighborhood analysis of protein packing SOS Son of sevenless homolog
SRF Serum response factor TAK TGFβ-activated kinase
TBST Tris-buffered saline with Tween TFA Trifluoroacetic acid
TFIIIB Pol III-specific transcription factor B TGFβ Transforming growth factor β
TICT Twisted intramolecular charge transfer +TIP Plus end tracking protein
TLC Thin layer chromatography tRNA Transfer ribonucleic acid
TPE Tetraphenylenes
TPL2 Tumor progression locus 2
xxvii
VDW Val der Waas
Chapter 1 Long wavelength merocyanine dyes for multiplexed live cell imaging
1.1 Summary
Activity of endogenous proteins can be reported by fluorescence changes of a solvatochromic merocyanine dye covalently attached to an affinity reagent that binds only the activated conformation of its target. It has however remained challenging to monitor multiple protein activities simultaneously in the same living cell due to the need for two fluorophores in a ratiometric biosensor and the spectral overlap that can occur when using multiple fluorophores. Here we describe a new class of near infrared and red merocyanine dyes with solvent-sensitive fluorescence properties for in vitro assays and for multiplexed live cell imaging. We also demonstrate the use of the new dyes to co-image spatiotemporal dynamics of endogenous Cdc42 and Src family kinases (SFK) in the same living cell. We show that both active Cdc42 and SFK are mainly localized at the leading edge while only SFK is activated throughout pinocytosis.
1.2 Introduction and Background
2
responses; such spatiotemporal information needs to be studied in living cells because it is often lost in in vitro assays or fixed cell experiments, due to the need for long incubation times and/or to the disruption of cellular compartments. Fluorophores for live cell imaging must possess the following properties: sufficient brightness (i.e. large extinction coefficient, high quantum yield), photostability, water solubility, biocompatibility, and emissions at long wavelengths to avoid cellular autofluorescence. Förster resonance energy transfer (FRET) and solvatochromism have been employed to generate biosensors for reporting protein activity in living cells. It has been
difficult to monitor two or more biosensors in the same living cell due to significant
spectral overlap of the multiple fluorophores and increasing biological perturbations at
high total biosensor concentrations. In our experience, cells expressing two FP-based
FRET biosensors usually fail to exhibit normal cell motility. An alternative approach we
have been developing uses dye-based biosensors. Biosensors based on dyes can require
less biosensor due to their enhanced brightness, and unlike their FP-based counterparts,
dye-based biosensors have the ability to sense endogenous, unmodified target molecules.
We are able to reduce biological perturbations by combining a FP-based FRET biosensor
and a biosensor based on a solvatochromic dye, enabling use to study the coordination of
Cdc42, Rac and Rho during cell motility with seconds and submicron resolution (1). Here we have sought to develop new merocyanine dyes for multiplexed imaging of two or
more dye-based biosensors in the same living cell, and optimized the best versions of
these dyes for intensity-based or lifetime-based imaging.
The first class of new dyes consists of the red-shifted versions of previously reported
3
each double bond to the conjugated polymethine chain in cyanine dyes usually results in
a red shift of approximately 100 nm, red merocyanine dyes with these chemical
modifications are likely to be excited by near infrared wavelengths. Thus these
red-shifted merocyanine dyes could provide an orthogonal fluorescent channel which can be
imaged together with a red dye-based biosensor or commonly used fluorescent proteins.
The second class consists of red merocyanine dyes with dual fluorescence changes in
both intensity and wavelengths; these dyes do not require a second fluorophore for ratio
imaging. In addition, because fluorescence lifetime of a molecule is insensitive to factors
that influence dye intensity, biosensors based on solvatochromic dyes do not need a
second fluorophore for quantification of protein activity in fluorescence lifetime imaging
microscopy (FLIM). Therefore FLIM properties of the new dyes were examined as well.
The new dyes were tested on the two published activity sensor designs for endogenous
activated Cdc42 GTPase and for Src family kinases (SFK). The best dye-based
biosensors for intensity-based or lifetime-based detection were determined by comparing
biosensor brightness, dynamic range, photostability, and solvent-dependent fluorescence
properties (intensity, lifetime, and wavelength maxima).
1.2.1 Protein-based biosensors for live cell imaging
Protein activity or abundance of analytes in live cells can be quantified by
fluorescence changes of fluorescent proteins (FPs) or small organic dyes. The
fluorophores are attached to target protein molecules or an affinity reagent that
specifically binds the activated conformation of the target proteins or sites of
posttranslational modifications. Affinity reagents based on protein scaffolds can be easily
4
proteins via high-throughput screening (HTS) or protein engineering. Protein-based
affinity reagents also provide more extensive binding interactions than small molecule-
and peptide-based binders. While FP-based biosensors still dominate the mainstream for
biological applications, an increasing number of chemically modified proteins with
unique properties is being developed and applied to live cell studies. Here I summarize
recent progress in protein-based biosensors that use fluorescent proteins or organic dyes:
Figure 1.1 Exisitng designs of protein-based biosensors.
5
identical to FP-FRET. Small molecule-FRET usually produces higher dynamic range than FP FRET. (f) Biosensors based on a solvatochromic dye-labeled target protein molecule. Upon conformational changes, the dye is likely in a more hydrophobic or a less hydrophobic environment on the binder surface and therefore displays a fluorescence change (g) Biosensors based on a cell permeable dye and split fragments of a protein tag such as SNAP tags or CLIP tags. The binding interactions enable reconstitution of the protein tags which can form a stable covalent linkage with the corresponding cell permeable dyes.
Fluorescent protein-based biosensors Most biosensor designs are based on
fluorescent proteins because FPs can be used for manipulation by transfecting reagents
and for genetically targeting to specific tissues by incorporating a tissue-specific
promoter sequence in the plasmids for transfection. The fluorescence readouts of
FP-based biosensors can be generated through bimolecular fluorescence complementation
(BiFC), Förster resonance energy transfer (FRET), and other mechanisms (Fig 1.1a-c).
BiFC utilizes the fluorescence recovery after in vivo reconstitution of the N-terminal and
the C-terminal fragments derived from the parent fluorescent protein molecules (Fig
1.1c). The available fluorescent protein variants for BiFC include Cerulean, mVenus and
GFP. The BiFC methods have been applied to many pairs of binding partners such
Ras-Raf (2), actin-cofilin (2), AP1-NFκB (3), Myc-Max-Mad (4), and p53-catalyse (5). The BiFC is easily adapted to a wide variety of protein-protein interactions; however this
method suffers from limited temporal resolution because the method takes time for
maturation of the reconstituted fluorescent proteins. The fluorescence intensity of a
reconstituted fluorescent protein is also usually 10-100 fold weaker than the parent
fluorescent protein (6). Because the wavelengths of the existing fluorescent proteins cover the entire visible spectrum (Fig 1.2), several pairs of fluorescent proteins capable
6
emission spectrum of CFP is substantially overlapped with the excitation spectrum of
YFP, indicating the close potential energies of the CFP-YFP pair. Because the FRET
efficiency of the two fluorophores is inversely proportional to the sixth power of the
distance between CFP and YFP, excitation of CFP can result in an increase in the
emission of YFP through FRET when the two fluorophores are within 10 nm. Binding
interactions between two binding partners alter the distance between the two fluorophores
and the relative orientations of their dipole moments, thus the change in FRET/donor
emission is a function of the protein-protein interactions (Fig 1.1a). To report target
protein activity or detect amounts of target molecules, one of the fluorophores in the
FRET pair is fused to a target-binding domain that specifically recognizes the activated
conformations of target proteins (1, 8-12), sites of post-translational modifications (13-24) or small molecules (25-30). Some FRET biosensors (24, 31, 32) are based on the loss of FRET upon enzymatic cleavage of a sequence between the donor and the acceptor
fluorophores or conformational changes of the FP-tagged target proteins. The other
fluorphore is fused to a docking domain or a recombinant target molecule for achieving
specificity of the biosensor designs. Circular permutation of fluorescent proteins not only
enables FRET through different orientations of either the donor or the acceptor FP but
also provide new biosensor designs based on single fluorophores. Structural changes
occurring at the site of permutation can stabilize the hydrogen bonding network or affect
the polarity surrounding the chromophore, resulting in a fluorescence intensity change
7
GFP to a periplasmic binding protein (PBD) (34). Binding of maltose induces a conformational change in PBD and affects the fluorescence intensity of the inserted
cpGFP. This approach has great potential to become a generally applicable method to
produce single FP-based reporters for a diverse array of analytes. Recently the detection
of a ternary complex in live cells has been enabled by combining BiFC and FRET (35). In the BiFC-FRET biosensor design, a pair of split mVenus fluorescent protein fragments
is fused to bJun and bFos transcription factors. The binding interactions between bJun
and bFos activate the reconstitution of mVenus. The complex is then capable of
associating with a Cerulean-tagged p65 transcription factor and undergoes FRET.
Figure 1. 2 Brightness and excitation maxima of fluorescent proteins and organic dyes.
Brightness is the product of the extinction coefficient ε and the quantum yield Φ of the fluorophore. The values were obtained from references (7, 36-39).
Dye-based biosensors The major advantages of organic dyes over FPs include the
8
optimization of dye properties through chemical modifications and the diversity of
sensing mechanisms such as solvatochromism, FRET, twisted intramolecular charge
transfer (TICT), and photo-induced electron transfer (PET). Despite the superior dynamic
range, small molecule FRET (Fig 1.1e) is less used in protein-based biosensors than
FP-based FRET because the latter is much easier in terms of preparation and delivery.
Therefore, the current scope of small molecule FRET is focused on detecting metabolites
or enzymatic cleavage in vitro and in cell lysates. Mie et al recently reported a
technology to visualize protein-protein interactions in live cells based on the newly
developed split SNAP and split CLIP tags (Fig 1.1g) (40). They showed that a pair of c-SNAP-tagged bJun and n-c-SNAP-tagged bFos can form a reconstituted SNAP tag and
react with SNAP-Cell TMR Star dyes in HeLa cells. Since protein tags can easily be
fused to protein-based affinity reagents, simultaneous labeling of a split SNAP tag and a
split CLIP tag with SNAP-Cell Oregon Green and CLIP-Cell TMR-Star also
demonstrates great potential for multiplexed imaging of two or more pairs of
protein-protein interactions in the same living cell.
Spatial and temporal dynamics of endogenous activated targets can be reported by
biosensor designs based on solvatochromic fluorphores (Fig 1.1d & f). Solvatochromic
fluorophores such as merocyanine dyes can emit at longer wavelengths than fluorescent
proteins (FPs) where the spectral overlap with cellular autofluorescence is greatly
diminished (Fig 1.2). Importantly, merocyanine dyes exhibit altered fluorescence
intensity and/or wavelength maxima in either excitation or emission spectra in response
to changes in polarity (hydrophobicity and charge) and hydrogen-bonding interactions in
9
generate dye-based biosensor designs (Fig 1.1 a & c) for reporting spatiotemporal
dynamics of calmodulin (41, 42), S100A4 (43), Cdc42 (44, 45) and Src family kineases (SFKs) (46). Another advantage of the use of solvatochromic dyes is the direct excitation that produces a brighter signal per unit irradiation intensity. Thus less biosensor material
is required to obtain sufficient biosensor signals with minimal cellular perturbation.
Because of the smaller size and the use of longer wavelengths, dye biosensors are
complementary to FP-based FRET biosensors and can be co-imaged with a FRET
biosensor in a single living cell (1).
1.2.2 Solvatochromism
The principle of fluorescence can perhaps be best understood by the Jabloński
diagram (Fig 1.3A) in which the singlet ground state and the first singlet excited state are
denoted as S0 and S2, respectively. A fluorophore can be populated at various vibration
levels upon excitation. In some cases, fluorophore molecules quickly relax to the lowest
excited state S1 in a process called internal conversion. When the excited electrons return
to the ground state, a loss in vibrational energy accompanies with emission, resulting in a
red shift of the emission spectra relative to the excitation spectra. The wavelength
difference between the absorption maximum and emission maximum is called the Stokes
shift. The relative potential energies of the ground state, the excited states and the
transition states are influenced by various factors such as temperature, solvent polarity,
10
Figure 1.3 Jabloński diagrams of regular fluorescen and solvatochromism.
A. Jabloński diagram. S0: singlet ground state. S1: the first excited state. hνA: absorption
energy. hνF: dissipated energy via fluorescence. Γnr: energy loss via non-radiative
processes. B. Solvatochromism. Emission maxima are red-shifted if the excited state is more stabilized than the ground state of a molecule in more polar solvents. These diagrams were adapted from: J. R. Lakowicz, Principles of Fluorescence Spectroscopy, Springer, New York, NY, USA, 3rd edition, 2006.
Solvatochromism is a term to describe the solvent-sensitive fluorescence behaviors of
some molecules (Fig 1.3B). These molecules usually possess a large difference in the
dipole moments of the ground state and the excited state. Hypsochromic (blue shift) and
bathochromic (red shift) transitions in the absorption spectra of a molecule are called as
negative solvatochromism and positive solvatochromism, respectively. When a molecule
undergoes a positive solvatochromism in a more polar solvent, a red shift in the emission
spectra of the molecule is observed. Solvatochromism is determined by the relative
stabilization in the ground state and the excited state of the molecule in solvents of
various polarities. Because the time for the light-absorbing molecules to be excited to the
excited state (femtoseconds) is much shorter than the time for molecules to undergo
vibrational or rotational movements (1-100 picoseconds), solvatochromic fluorophores
still obey the Frank-Condon principle in which the vibration levels in the ground state are
similar to the vibration levels in the excited state. Due to the unique solvent-dependent
11
developed to report protein conformation change, protein-sensor binding interactions and
post-translational modifications in vitro and in live cell imaging (1, 39, 41, 43-52). The solvatochromic properties of native tryptophan residues in proteins led to their
becoming the first well-investigated class of fluorophores that could be useful for
detecting protein conformation changes (53, 54). Since then, many new extrinsic fluorophores with greater brightness and longer wavelengths have been developed to
report biological events via probe-target interactions when a probe molecule is in
proximity to the target molecule (55). One class of solvatochromic dyes that are especially useful for live cell imaging is merocyanine dyes. A merocyanine molecule
consists of an electron donor, an electron acceptor, and a conjugated polymethine chain
bridging the donor and the acceptor moieties (Fig 1.4A). Depending on its environment
and the chemical structure, the ground state resonance structure of a merocyanine dye can
fall anywhere along a continuum between neutral, partially charged, and zwitterionic
forms. Merocyanines are more attractive for live cell imaging applications than most
solvatochromic dyes because merocyanines satisfy several criteria necessary for live cell
imaging including brightness, solvent-dependent fluorescence, and long excitation
wavelengths. Some merocyanine derivatives are brighter than most fluorescent proteins
and/or are more photostable than commonly used imaging dyes such as fluorescein and
12
Figure 1.4 Mechanisms of dye-based biosensors.
A. A merocyanine molecule consists of an electron donor (D) and an electron acceptor (A) connected by a conjugated polymethine chain (45, 58). B. An example of water-soluble and thiol-reactive merocyanine dye for biosensor applications. The electron donor is colored in red and the electron acceptor is colored in blue. C. A typical dye-based biosensor is based on dye-labeled protein-based binder molecules that bind only activated conformation of the target and exhibit fluorescence changes upon binding.
Two examples of biosensor designs based on solvatochromic dyes for live cell
imaging applications include MeroCBD for reporting activation of endogenous Cdc42
(44, 45) and SFK merobody for reporting activation of endogenous Src family kinases (SFK) (46). To report protein conformational changes or protein-protein interactions, a merocyanine dye molecule (Fig 1.4B) is covalently attached to an engineered cysteine
residue on an affinity reagent that binds only activated targets (Fig 1.4C). The affinity
reagent in MeroCBD is derived from the CRIB domain of Wiscott-Aldrich syndrome
protein (WASP)—a direct downstream effector of Cdc42, whereas the affinity reagent
that specifically binds the SH3 domain of c-Src was discovered via phage display of a
fibronectin scaffold library (59). According to the co-crystal structure (PDB: 1CEE), the binding interface between GTP-bound Cdc42 and WASP contains many hydrophobic
13
upon binding when the merocyanine dye is covalently attached to the binding interface
(Fig 1.5A). MeroCBD reveals that Cdc42 is highly active at the leading edge during
protrusions (Fig 1.5B). When a Src family kinase molecule is activated after
phosphorylation, the SH3 domain of SFK becomes accessible for the artificial binder
(Fig 1.5C). When a merocyanine dye is covalently attached to the engineered cysteine
residue at the potential binding interface between the affinity reagent and the activated
SFK, the dye fluorescence either increases or decreases to reflect abundance of activated
SFK in cells. The SFK merobody biosensor is capable of monitoring fluctuation of
endogenous SFK activation during leading edge dynamics and macropinocytosis (Fig
1.5D). Because merocyanine dyes report changes in total fluorescence intensity that are
easily influenced by factors such as varying cell thickness and uneven illumination, a
second fluorophore insensitive to protein activation is required as a volume indicator to
use for ratiometric imaging. As a result, the broad spectral range of two fluorophores
limits the maximum number of biosensors that can be imaged in a single cell using the
14
Figure 1.5 Biosensor designs for Cdc42 and SFKs.
A. MeroCBD, a dye-based biosensor for endogenous activated Cdc42 Rho GTPase. The affinity reagent specific to GTP-bound Cdc42 was derived from a substrate of Cdc42. A second fluorophore such as EGFP is fused to the dye-labeled affinity reagent to eliminate factors that affect dye intensity in live cell imaging including varying cell thickness and uneven illumination. B. SFK merobody, a dye-based biosensor for endogenous activated Src family kinases (SFKs). The affinity reagent specific to c-Src SH3 domain was obtained through phage display of a library of fibronectin monobodies.
The current obstacles to using solvatochromic dyes inside living cells are the delivery
of the highly polar dye conjugate and the lack of bright deep red (700-740 nm) or near
infrared (740-780 nm) solvatochromic dyes for multi-color imaging. As bio-orthogonal
reactions and site-specific labeling methods (60-84) have been rapidly advanced in recent years, the solvatochromic dyes will be easier to use and provide more novel tools
for live cell studies or in vivo imaging.
1.2.3 Recent progress of near infrared dye-based probes for live cell imaging applications
Near infrared (NIR) fluorophores with excitation wavelengths ranging from 650 to
15
tissues, the diminished contribution of cellular auto-fluorescence to background signal,
and the reduced photo-toxicity to live cells. NIR fluorophores are also useful for
multiplexed imaging since there are very few bright, photostable near infrared
fluorephores that have been routinely used for biological applications. In addition to the
most commonly-used cyanine derivatives, several dye scaffolds have progressed for live
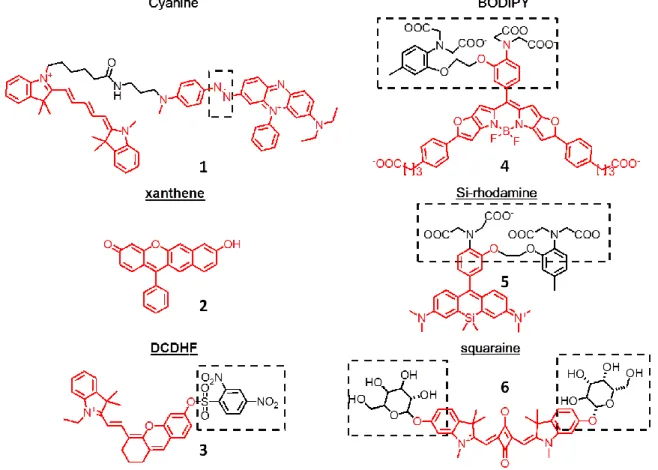
cell or live animal imaging applications. These near infrared dyes include rigidified
cyanines, squaraines, BODIPY derivatives, xanthenes, Si-rhodamines, and
dicyanomethylenedihydrofuran (DCDHF) derivatives (Fig 1.6).
Figure 1.6 Examples of NIR dyes for live cell imaging applications.
16
Cyanine derivatives Cyanine dyes are the most popular NIR fluorophores because
of their long wavelengths, high extinction coefficients, high quantum yields in aqueous
solution, and numerous well-established protocols for preparing dye-conjugates. White et
al designed a deep-red fluorescent probe with selective response to the surface of both
Gram-positive and Gram-negative bacteria in mice injected with bacteria (85). The probe reports the enhanced hydrophobicity surrounding the dye molecule by Förster resonance
energy transfer (FRET) of the conjugate of a cyanine energy donor and a
bis(zinc(II)-dipicolyamie) energy acceptor. When titrated with POPC/lipid A, the probe showed an
approximately four-fold increase in acceptor emission (85). A similar approach was applied by the Nagano group to generate QCy5, the first long wavelength FRET sensor
for imaging hypoxia in MCF-7 cells and acute hypoxia in living mice (86). In their sensor design, a Black Hole Quencher (BHQ) derivative serves as the fluorescence quencher for
Cy5 and an azobenzene moiety that undergoes reduction in hypoxia. For in vivo imaging,
mice injected with QCy5 were imaged with an excitation wavelength of 620 nm and an
emission wavelength of 680 nm. However, QCy5 is maximally excited at 605 nm and
maximally emits at 645 nm. Okuda et al also reported a cyanine-based NIR sensor for
hypoxia, GPU-167, which marks the tumor sites in mice with an excitation maxima of
753 nm and an emission maxima at 778 nm (87). Yuan et al reported a series of 2,3-dihydro-1H-xanthene-6-ol derivatives with λabs,max ranging from 608 to 698 nm and
λem,max ranging from 677 to 718 nm (88). The brightest derivative, compound 3, has an
extinction coefficient of 79000 cm-1M-1 and a quantum yield of 0.36 in 1:1 PBS-MeOH mixture at pH 7.4. They showed that two derivatives of compound 3 are capable of
17
endogenous thiols in live Bel 7702 cells and mice. Yuan et al also describe a new class
of cyanine dyes named Changsha (CS) NIR dyes and demonstrated the use of the new
dyes to detect endogenous HClO production in RAW264.7 macrophages and mice (88). The parent dye CS2 is maximally excited at 700 nm and emits most at 731 nm with an
extinction coefficient of 139,500 cm-1M-1 and a quantum yield of 0.41 in ethanol. The probe exclusively responds to HClO over several representative reaction oxygen species
(ROS) and reactive nitrogen species. Addition of HClO opens up the OSu-protected
derivative, resulting in increases emissions at 745 nm. Other NIR probes based on
cyanines have been used to detect pH change (89), mercury ions (90), copper ions (91), singlet oxygen (92), ozone (93) and peroxynitrite (ONOO-) (94, 95).
Dicyanomethylenedihydrofuran (DCDHF) derivatives DCDHF dyes are composed
of an amine donor moiety and an acceptor group based on
2-dicyanomethylene-3-cyano-2,5-dihydrofuran (DCDHF) connected with an extensive π-system (96). DCDHF dyes are characterized by a large Stokes shifts and solvent-sensitive change in brightness and
lifetime. A lipid-modified derivative, DCDHF-A-6, diffused to the plasma membrane of
CHO cells for monitoring membrane dynamics (97). In water the dye is weakly fluorescent with an absorption maximum of 600 nm and an emission maximum of 830
nm. While in toluene solution of 20% poly (methyl methacrylate) (PMMA), DCDHF-A-6
has a quantum yield of 0.71, a shifted absorption maximum at 594 nm and a
blue-shifted emission maximum at 686 nm. The extinction coefficients of DCDHF (ε:
29,000-71,000 cm-1M-1) are relatively smaller than cyanines and merocyanines, making it still
difficult to generate sufficient signal-to-noise ratios for intensity-based ratio imaging
18
polarity differences in the environment. For example, another dye, DCDHF-N-6, has a
quantum yield of 0.017 and a lifetime value smaller than 0.22 ns in ethanol; in PMMA
solution the dye becomes brighter with a quantum yield of 0.98 and a lifetime value of
3.2 ns. The photobleaching rates of DCDHF-A-6 and DCDHF-N-6 are 5.4 and 29.5 fold
slower than fluorescein. The major issue of DCDHF dyes is their low water solubility
caused by the highly planar and hydrophobic conjugated system. Methods to generate
more water soluble DCDHF derivatives are being developed to prevent non-specific
binding to membrane molecules in living cells (98).
BODIPY derivatives Several near infrared derivatives based on the BODIPY
(borondipyrromethane) scaffold by extending the π-conjugated system have been
reported (99-103). Most applications of the NIR versions of BODIPY dyes have been in material science. However, Myochin et al recently reported a series of near infrared
fluorescent probes for detecting matrix metalloproteinases (MMPs) in HT-1080 cells and
in mice (100). Among the NIR probes, a probe based on a NIR BODIPY dye and a dark quencher BHQ is cell permeable and shows an increase in quantum yield from 0.001 to
0.127 upon dequenching by the MMP-mediated cleavage of the probes. Interestingly, Hu
et al reported another new class of near infrared BODIPY derivatives with large Stokes
shifts with solvatochromic properties (102). They exploit the advantage of aggregation-induced emission (AIE) of tetraphenylenes (TPE) and create a series of TPE-BODIPY
derivatives with various conjugatable linkers. Although these dyes enter cells mainly by
endocytosis, these BODIPY dyes might be useful to construct dye-based biosensors to
19
Xanthene derivatives Two typical classes of xanthenes dyes are fluorescein,
rhodamine, and their derivatives, which are usually not excited or emit in the NIR region.
A series of new water soluble and low molecular weight semi-naphthofluorone ( SNAFR)
containing xanthenes derivatives emit at near infrared region with moderate quantum
yields of around 0.09 in DMSO and display dual fluorescence changes in both excitation
and emission spectra (104). A test dye, SNAFR-6, was capable of rapidly passing through the cell membrane of HEp2 cells and accumulating mainly at endoplasmic reticulum
(ER) and lysosomes with low cytotoxcity. This dye is excited maximally at 536 nm,
emits maximally at 733 nm and exhibits a photobleaching rate 3.3 fold slower than
fluorescein in aqueous solution. Despite the long emission wavelengths and large Stokes
shifts of SNAFR dyes, their brightness and photostability will be the focus for future
improvement.
Si-Rhodamine (SiR) derivatives The Nagano group at the University of Tokyo
recently invented a new class of near infrared fluorophores based on group 14-substituted
rhodamine derivatives (105). Group 14 metalloles including silicon, germanium and tin possess unusually low-lying lowest unoccupied molecular orbitals (LUMO) due to the
σ*-π* electronic transition between the σ* orbital of the two bonds connecting the group
14 atom and the π* orbital of the butadiene part of the appended fluorophore. As a result,
the rhodamine derivatives containing a bridge group 14 atom show a large bathochromic
shift to far-red or near infrared regions in excitation and emission spectra. The Nagono
group later incorporated an alkylaminobenzene group to a Si-rhodamine dye to generate a
20
in HeLa cells incubated with zinc or a zinc chelator,
N,N,N’,N’-tetrakis(2-pyridylmethyl)ethylene
diamine (105). Another exciting new sensor design is a new NIR calcium probe based on Si-rhodamine which allows deeper tissue penetration with reduced photo-cytotoxicity
(106). The probe, named CaSiR-1, consists of a Si-rhodamine (SiR) with excitation/emission maxima of 650 /664nm and a BAPTA ligand to chelate calcium ions.
The new probe has a quantum yield of 0.20 upon binding of saturating concentrations of
calcium ions with a Kd of 0.58 μM, enabling the co-imaging of sulforhodamine
101-stained astrocytes and CaSiR-1-illuminated endogenous calcium in a hippocampal slice
from a Thy1-mGFP mouse. Other in cell- or in vivo applications include detection of
HClO generation during phagocytosis of porcine neutrophil and PMA-stimulated mice
(107), and visualization of tumor sites in mice intravenously injected with a NIR siR-labeled anti-tenascin-antibody (108).
Squaraine derivatives Squaraine dyes feature an electron deficient four-member
ring acceptor moiety which bridges two electron donor moieties. These dyes commonly
exhibit intense fluorescence at long wavelengths. The major applications of squaraine
dyes have been in dye-sensitized solar cells, but their use in live cell imaging is currently
under development (109-113). Oushiki et al developed a squarylium-based NIR probe for alkaline phosphatase and β-galactosidase (113). Upon cleavage of a dye-galactoside derivative by β-galactose expressed in LacZ-positive HEK293 cells or mice, the probe
becomes brighter due to the enhanced hydrophobic environment at the probe-enzyme
21
bovine serum (FBS), the dye is red-shifted from 626 nm to 645 nm in the excitation
maximua and from 645 nm to 660 nm in the emission maxima. The extinction coefficient
and the quantum yield values of the dye raises to 12,000 cm-1M-1 and 0.32. Another advantage of squaraine dyes is the superior photostability when compared with Cy5, a
commonly used fluorophore for single molecule studies (114).
A few structures of near infrared merocyanine dyes (115, 116) have been reported. However, the current focus of most groups is to generate non-linear optical (NLO)
materials, and none of these have been used for live cell imaging. While the key
properties for live cell imaging of red merocyanine dyes have been carefully
characterized by our group, the potential of near infrared merocyanines for multiplexed
live cell imaging or in vivo imaging needs to be explored in more detail.
1.3 Results and Discussion
1.3.1 Design and synthesis of near infrared merocyanine dyes
The electron donor and the electron acceptor moieties of the new near infrared
merocyanine dyes were selected based on red merocyanine dyes with optimized
22
23
Figure 1.7 Design of red-shifted merocyanine dyes.
i. Solvatochromism of hepta-merocyanine dyes. ii. Structures of electron donor moieties. I: 2,2,3-trimethylindolenine. IS: 2,3,3-trimethyl-3H-indole-5-sulfonate. iii. Structures of electron acceptor moieties. SO: diketobenzothiophen-3-one. Pht: 1,3-indanedione. BA: 1,3-dimethylbarbituric acid. TBA: 1,3-diethyl-2-thiobarbituric acid. These end groups were previously optimized by Toutchkine et al (45, 56-58).
24
dye aggregation and for studies conducted in aqueous solution including pH sensitivity and dye-protein interactions.
N S O O O N O O N N N O O O N N N O O S N S O O O N O O N N N O O O
+K-O
3S +K-O3S
+K-O 3S mero80
mero79 mero81
mero82
mero97 mero84 mero83
Figure 1.8 Structures of red-shifted merocyanine dyes.
The syntheses of the electron donor moieties 1 and 3 and electron acceptor 5 were conducted according to published procedures (Fig 1.9). The indolenine ring of compound 3 was synthesized from 4-hydrazinylbenzenesulfonic acid and 3,3-dimethyl-2-butanone via Fischer Indole synthesis. Methylated derivatives of I and IS, compounds 1 and 3, were used for photophysical characterization and were prepared from indolenine intermediates through SN2 reaction with iodomethane. The synthesis of electron acceptor
25
aggregation. Other electron acceptor moieties Pht, BA, and TBA were obtained from commercially available resources. Pht has the most planar structure, while BA and TBA are the least planar. BA and TBA also possess more hydrogen bonding donor and hydrogen bonding acceptor groups than SO and Pht. It would be interesting to find out how the hydrogen bonding interactions and conformations of these electron acceptor moieties affects dye aggregation in water and dye-protein interactions.
HO3S
N H NH2
HO3S
N
HO3S
N I AcOH
O
reflux, 30 min
MeI, ACN reflux, overnight N N MeI, ACN reflux, overnight COOH SH O OH Cl COOH S OH O S O O O
NaOH/H2O reflux, 1h
i. Synthesis of donor moiety 1
2 3
1
i. H2O2/AcOH 65oC, 6h ii. NaOAc/Ac2O 110oC, 1h
4 5
ii. Synthesis of donor moiety 3
iii. Synthesis of acceptor moiety 5
Figure 1.9 Synthesis of donor and acceptor moieties of merocyanine dyes.
26
reacting acceptor moieties with malonaldehyde bis(dimethyl) acetal, the activated acceptor intermediates for red-shifted dyes were found to be highly unstable and difficult to separate by chromatography. We found that by activating the acceptor moieties via SN2 reaction with glutacondialdehyde dianil, the resulting acceptor intermediates 6a-6d
could be easily separated by re-crystallization, filtration, or flash chromatography with reasonable yields and purities.
O
N
H N
O
acetic anhydride / acetic acid reflux, 3 hrs
N O N O MeroNIR base, alcohol reflux, 20 min
N O
=
N N O O O N N O O S O O S O O OPht BA SO TBA
R
R
R = H
6a-6d
R = SO3-K+ mero97 mero79
pht BA SO TBA
mero80
mero84
mero81
mero83
mero82 i. Structures of acceptor moieties
ii. Synthesis of NIR parent dyes
Figure 1.10 Synthesis of red-shifted merocyanine dyes.
27
Severe compound decomposition after storage at 4 oC for three years was observed for activated BA and TBA acceptor intermediates (6b and 6d). The decomposed acceptor intermediates could easily form BA- and TBA-based red fluorescent cyanine dyes in the presence of base, as characterized by nuclear magnetic resonance and mass spectrometry (data not shown). For synthesis of mero79, mero80, mero81, and mero82, compound 1, an alkylated electron donor moiety of I, was dissolved in methanol and coupled with various activated electron acceptor intermediates upon addition of sodium acetate (Fig 1.9). Because the other electron donor moiety, compound 3, is poorly soluble in methanol, the synthesis of mero97, mero84, and mero83 was conducted in heated ethanol and catalyzed by triethylamine.
1.3.2 Photostability and spectral properties of NIR merocyanine dyes
28
formation. Once one or a few of the dye molecules in the dye aggregates is photobleached, dye-dye interactions become less significant and fluorescence of the remaining dyes are no longer quenched. Mero79 (I-Pht) and mero81 (I-SO) exhibited a fluorescence increase upon irradiation at 0.1 µM in n-butanol. Some dyes produced less excimer formation when placed on biosensor proteins (Fig 1.10A); however photobleaching rates measured on dye-labeled proteins vary from batch to batch and vary between different types of sensor proteins, making it difficult to obtain reproducible and consistent photobleaching kinetics for each dye.
Figure 1.11 Relative photostabilities of NIR merocyanine dyes.
A. Photobleaching of 0.1 μM mero81 in n-butanol and 1 μM mero77-labeled Cdc42 biosensor proteins in phosphate buffer (50 mM NaH2PO4, pH 7.6). B. Photobleaching
curves of 0.1 μM near infrared merocyanine dyes and Cy5 in glycerol. C. Normalized remaining intensity of 0.1 μM near infrared merocyanine dyes and Cy5 in glycerol after 2 hours of irradiation.
29
decay of 0.1 µM dyes in glycerol upon irradiation with a high energy xenon flashlamp (200 flashes per second) on a plate reader (Fig 1.11B). In general, most of the new near infrared merocyanine dyes exhibited photobleaching rates similar to the reference dye Cy5 (Fig 1.11C), with an exception being mero82 (I-TBA). After two hours of continuous irradiation, only approximately 60% of dye emission intensity remained in the case of mero82. In addition, mero62, a red and cysteine-reactive version of I-TBA, suffered from the tendency of over-labeling of sensor proteins of interest probably due to the strong association between free dye and dye-labeled proteins as assessed by SDS-PAGE and fluorescence gel scanning. Based on the poor photostability and potential of over-labeling of I-TBA dyes, near infrared derivatives of I-TBA were excluded from the following studies. In summary, mero80 (I-BA) is the most photostable among the new near infrared merocyanine dyes.
30
Table 1.11Spectral properties of near infrared merocyanine dyes.
Extinction coefficients were averaged with three separate preparations. Quantum yields were compared with Cy5.
Mero79 has the largest change in dye brightness with a nearly 12-fold increase from highly polar methanol to a solvent with lower hydrogen bonding such as DMSO.
However the basal brightness of mero79 is too low. Therefore this dye might be more
useful for in vitro fluorescence screening than for ratio images in live cells which require
signal-to-noise ratios of over 3.0 across whole cell regions. These near infrared
merocyanine dyes not only exhibit intensity changes in excitation and emission spectra
31
Figure 1.12 Solvent-sensitive fluorescence of NIR merocyanine dyes.
32
Figure 1.13 Solvent-sensitive fluorescence lifetime values of red and NIR merocyanine dyes.
33
34
Figure 1.14 Fluorescence decays of mero79 in MeOH, BuOH, and DMSO.
35
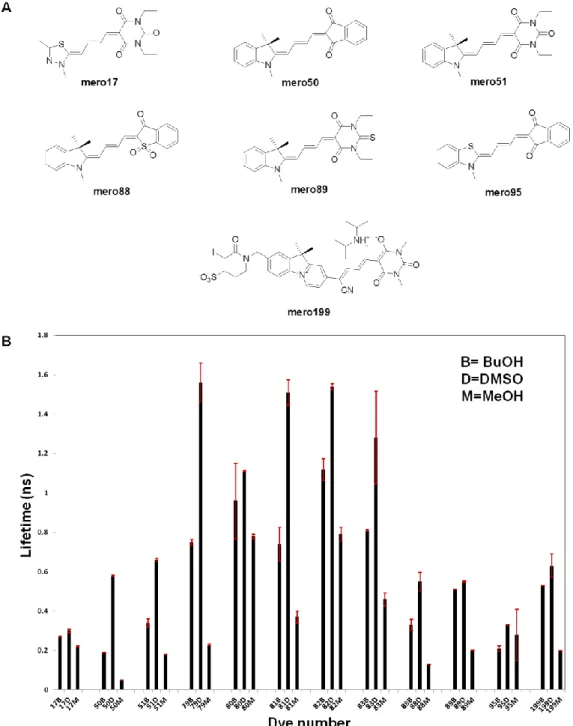
In general, the near infrared dyes have much longer lifetime values than the tested red merocyanine dyes (Fig 1.13B). Mero79, the near infrared merocyanine dye with the largest change in dye brightness, also possesses the largest change in fluorescence lifetime with an average lifetime of 0.23 ns in methanol and an average lifetime of 1.53 ns in DMSO. All the tested dyes showed single exponential fluorescence decay kinetics as shown in the example of mero79 (Fig 1.14). Mero81 and mero83 showed similar solvent-dependent fluorescence lifetime changes because the two dyes share the same combination of the electron donor I and the electron acceptor SO.
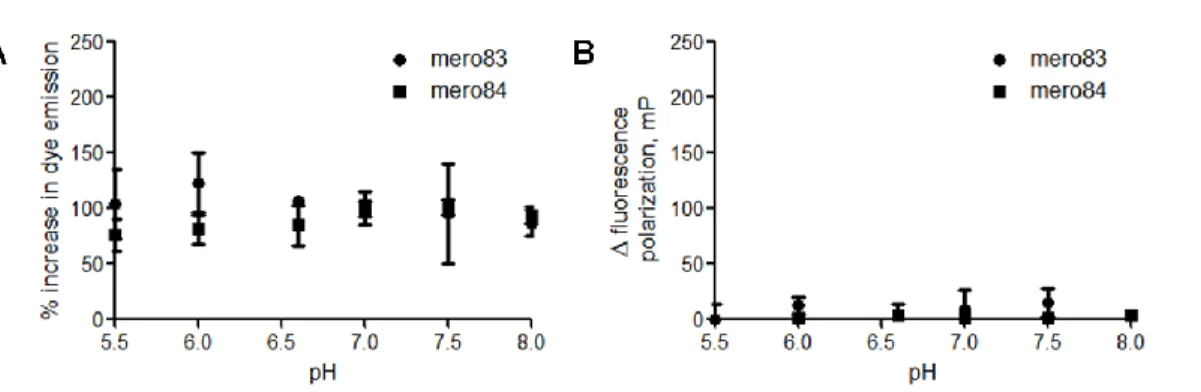
We next examined whether dye fluorescence responds to changes in pH and viscosity in the environment (Fig 1.15). Ideal solvatochromic dyes should possess constant fluorescence intensity throughout the physiological pH values ranging from pH 5.5 to pH 8.0. Water soluble derivatives of mero79 (I-Pht), mero80 (I-BA) and mero81 (I-SO)—mero97 (IS-Pht), mero84 (IS-BA) and mero83 (IS-SO) were employed here for fluorescence measurement in aqueous solution. Mero97 was not reported because of its low emission intensity in glycerol-water mixture. We found that mero83 is slightly brighter at lower pH while mero84 is slightly brighter at higher pH. The pH-dependent fluorescence changes of the two dyes were regarded as insignificant as compared to polarity-dependent fluorescence changes.
36
A. Relative dye emission intensity values of 10 μM mero83 (closed squares) and mero84 (closed squares) in phosphate buffer (50 mM NaH2PO4) at pH 5.5, 6.0, 6.5, 7.0, 7.5 and
8.0. Dye emission intensity values were normalized to the dye emission intensity value at pH 7.0. B. Relative dye fluorescence polarization values of 10 μM mero83 and mero84 in phosphate buffer at pH 5.5, 6.0, 6.5, 7.0, 7.5 and 8.0. Dye fluorescence polarization values were normalized to the dye fluorescence polarization values at pH 7.0
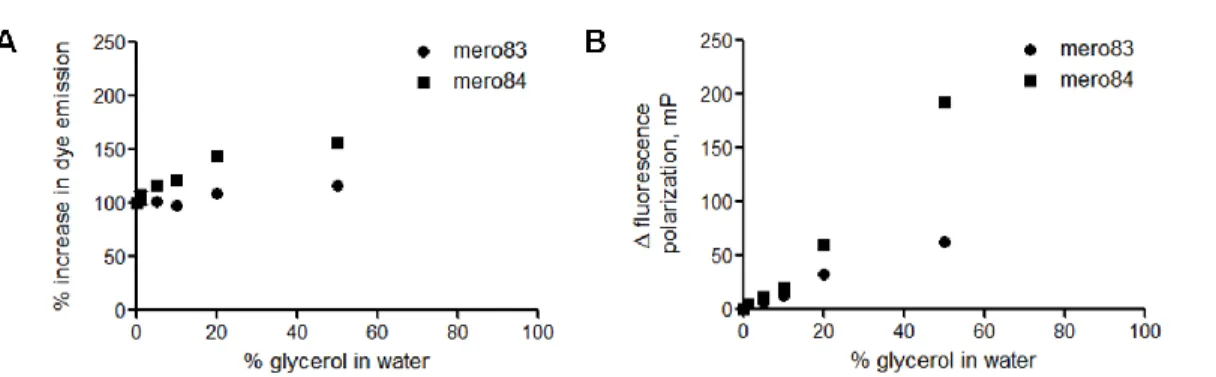
Dyes with large fluorescence response to viscosity have great potential as either membrane probes or protein activity sensors. Dye emission intensity and the fluorescence polarization values were measured in glycerol-water mixtures (Fig 1.16). Solvatochromic dyes usually become brighter in more viscous environments because solvent relaxation is greatly reduced. Both mero83 (IS-SO) and mero84 (IS-BA) exhibited limited fluorescence responses at low concentrations of glycerol molecules in water, with a maximum intensity increase of 5% for mero83 and 13% for mero84. Therefore the fluorescence response of dye-labeled sensor proteins is mainly due to the solvent-sensitivity of dye molecules, rather than variations in glycerol concentrations during in vitro assays conducted in 0~5% glycerol-buffer mixture. In summary, mero84 showed the most pronounced changes in fluorescence intensity and fluorescence changes in response to increased local viscosity.
Figure 1.16 Effects of viscosity on the fluorescence properties of NIR merocyanine dyes.
37
circles) and mero84 (closed squares) in glycerol-water mixture containing 0%, 0.5%, 5%, 10%, 20% and 50% glycerol. Fluorescence polarization values were normalized to the fluorescence polarization value in water.
38
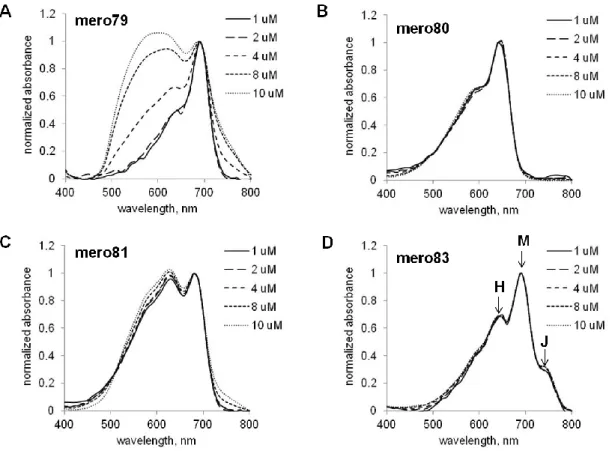
dye concentrations. Mero83, the water soluble derivative of mero81, contained a smaller absorption peak of H-type aggregates and a new red-shifted absorption peak, presumably to be J-type aggregates. Since H-type and J-type aggregates are determined by the relative spatial orientations of dye molecules, the addition of a charged sulfate group in mero83 did significantly alter dye-dye interactions. By comparing the absorption spectra of mero81 and mero83, dye aggregation behaviors seemed to be dominated by contributions from hydrophobic interactions, hydrogen bonding interactions, and electrostatic interactions of dye molecules, rather than aqueous solubility issues.
Figure 1.17 Concentration-dependent aggregation of NIR merocyanine dyes in water.
39
mero79. B. Absorption spectra of mero80. C. Absorption spectra of mero81. D. Absorption spectra of mero83, a water-soluble derivative of mero81.
H-type aggregates of merocyanine dyes are usually non-fluorescent or weakly fluorescent. Thus the relative fluorescence changes were examined in DMSO-water mixtures (Fig 1.18). Both excitation and emission intensity values of mero79, mero80, and mero81 showed large changes at various concentrations of DMSO in water. Mero79 became nearly non-fluorescent in 1:1 DMSO-glycerol mixtures. As dye molecules covalently attached on the surface of biosensor proteins are in a very hydrophilic environment, mero79 and its derivatives are less likely to generate bright activity sensors based on dye-labeled sensor proteins. A good correlation between the brightness of parent dyes in DMSO-water mixtures and the brightness of near infrared dye-labeled sensor proteins was found: mero80 and I-BA-labeled sensor proteins are both bright in high percentages (50-75%) of water while the fluorescence intensities of mero81 and I-SO-labeled sensors proteins dropped dramatically (Fig 1.18).
Figure 1.18 Effects of water on the excitation and emission properties of NIR merocyanine dyes.