PAST SUBSTANCE USE DISORDER IS ASSOCIATED WITH A MORE RAPID TRANSITION FROM GOAL-DIRECTED TO HABITUAL RESPONDING
Theresa H. McKim
A thesis submitted to the faculty at the University of North Carolina at Chapel Hill in partial fulfillment of the requirements for the degree of Master of Arts in the Department of Psychology
(Behavioral Neuroscience)
Chapel Hill 2014
Approved by:
ABSTRACT
Theresa H. McKim: Past substance use disorder is associated with a more rapid transition from goal-directed to habitual responding
(Under direction of Charlotte A. Boettiger)
ACKNOWLEDGEMENTS
TABLE OF CONTENTS
LIST OF TABLES ... vii
LIST OF FIGURES ... viii
LIST OF ABBREVIATIONS ... ix
Chapter 1: Introduction ... 1
Chapter 2: Materials and Methods ... 7
Participants ... 7
General Procedure ... 7
Data Analysis ... 9
Chapter 3: Results ...13
Demographic and Psychometric Data ...13
Behavioral Performance during Training ...13
Model 1: Initial Performance Model without SUD Status ...14
Model 2: Final Performance Model with SUD Status ...15
Perseverative Behavioral Indices ...16
Model 1: Initial Perseverative Model without SUD Status ...16
Model 2: Final Perseverative Model with SUD Status ...16
APPENDIX 1: MODEL 1 – INITIAL PERFORMANCE MODEL WITHOUT
SUD STATUS ...22 APPENDIX 2: MODEL 2 – FINAL PERFORMANCE MODEL WITH
LIST OF TABLES
Table 1. Sample Demographics and Psychometric Data ...32 Table 2. Fixed Effect Estimates (Top) and Variance-Covariance Estimates (Bottom)
for Models of the Predictors of Learning Behavior. ...33 Table 3. Fixed Effect Estimates (Top) and Variance-Covariance Estimates (Bottom)
LIST OF FIGURES
Figure 1. Predicted accuracy over time for FAM (red) and NOV (green) sets by
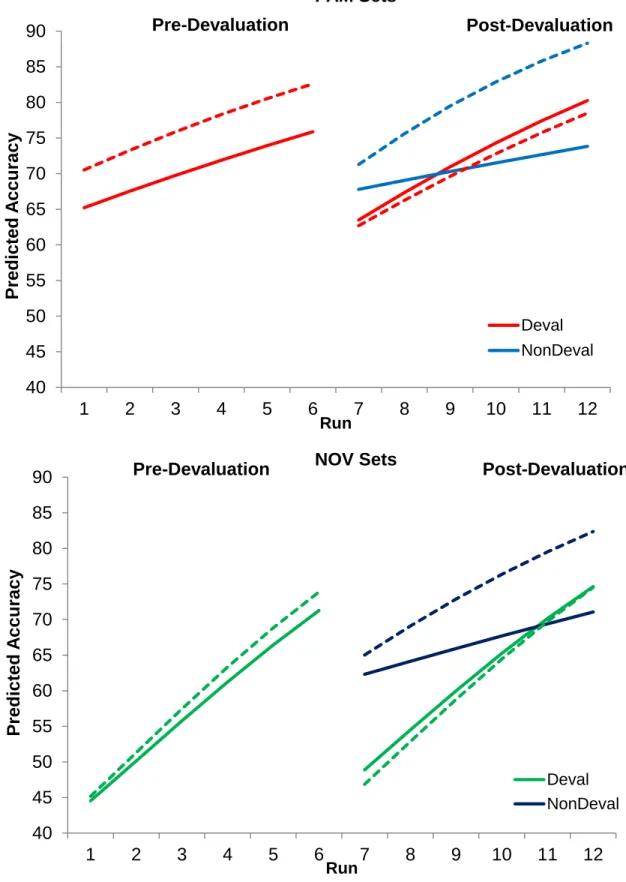
group prior to devaluation ...35 Figure 2. Predicted accuracy over time for FAM (red, top) and NOV (green, bottom)
sets by group pre-and post-devaluation ...36 Figure 3. Percentage of perseverative errors by group during the post-devaluation
phase ...37 Figure 4. Predicted perseverative errors over time for FAM (red) and NOV (green)
LIST OF ABBREVIATIONS
ANOVA Analysis of variance
DLPFC Dorsolateral prefrontal cortex DLS Dorsolateral striatum
DMS Dorsomedial striatum
DSM-IV Diagnostic and Statistical Manual of Mental Disorder – Fourth Edition FAM Familiar response set
IL Infralimbic cortex IQ Intelligence quotient LCD Liquid crystal display
MINI Mini International Neuropsychiatric Interview MLM Multilevel modeling
NOV Novel response set
OCD Obsessive compulsive disorder OFC Orbitofrontal cortex
PFC Prefrontal cortex S-R Stimulus-response SUD Substance use disorder
TMS Transcranial magnetic stimulation UNC University of North Carolina
Chapter 1: Introduction
Associative learning allows efficient interaction with our environment by using our previous experiences to adapt response selection. Initial associations between stimuli and responses are formed by goal-directed actions shaped by contingent outcomes of behavioral responses (Dickinson, 1985). These adaptable behavioral responses allow behavioral flexibility in response to changes in outcome value to maximize rewards obtained. Facilitation of behavioral autonomy occurs with repeated practice, thus leading to behaviors driven by stimulus-response (S-R) associations as opposed to action-outcome associations (Dickinson, 1985). Formation of S-R associations results in habit-based behaviors that are no longer under the control of an outcome or goal, and are instead stimulus-bound. The utility of both goal-directed and habit-based associations and the ability to switch between these learning systems enables rapid and automatic responses to familiar stimuli and facilitates cognitive flexibility to adjust responses in novel contexts. However, habit-based actions underlie behavioral patterns that are difficult to change and, in the context of addiction, theoretically promote compulsive drug use and susceptibility to relapse.
association that does not allow for updating changes in response value. While there is some existing research on human habit learning, the tasks employed to date limit the ability to study the neural processes governing the dynamic relationship between both goal and habit systems in learning over time. Prior human studies have measured immediate changes after devaluation, with little emphasis on measurement of within-subject change during adaptation of learned behaviors. Furthermore, evaluating multiple time points per person can extend our understanding of individual trajectory differences by producing growth curves that characterize the shape and rate of learning processes, which include both initial goal-directed behavior prior to and immediately after devaluation; this approach allows assessment of changes in the relative dominance of the neural systems that contribute to both goal-directed and habit-based behavioral output. Work from our lab using an S-R learning task (Boettiger and D'Esposito, 2005) demonstrates the utility of this task in measuring neural correlates of new R learning, S-R execution, and S-S-R “overwriting” processes, paralleling recent work in animals focused on the frontostriatal circuitry necessary for goal-directed and habit-based responding during learning. The use of a task in humans that can capture and assess the continuum of the learning process over time provides the opportunity to probe behavioral and neural contributions of associative learning mechanisms within an individual, as well as to further test between-person variables (e.g. group status) that may contribute to differences in learning behavior.
the medial prefrontal (PFC), a brain area that acts as an arbitrator. The key role of the mPFC in the flexible control of habits was demonstrated by showing that new behaviors could replace established habits, with perturbation of the mPFC facilitating a switch between previously- and newly-learned behaviors (Smith et al., 2012). A handful of human neuroimaging studies have examined the neural basis of goal-directed versus habitual responding (Valentin et al., 2007; de Wit et al., 2009). Although these studies parallel findings from the animal literature, the role of the PFC in goal-directed versus habitual responding has typically been assessed separately. The assumption of relative independence of associative learning systems during performance does not adequately capture cognitive flexibility, demonstrating the importance of task selection and development to address these concerns. Additional human neuroimaging studies have highlighted the concurrent use of neural circuits underlying goal-and habit-based response learning, disentangling both differential and additive function within frontostriatal circuitry (Boettiger et al., 2004; Daw et al., 2011). These studies have implemented behavioral tasks that examine the interaction between goal-and habit-based brain circuits to account for parallel activation of both systems throughout training as opposed to sequential activation of habit circuitry as training progresses. The development of methods to assess habit learning in humans combined with a better understanding of the neural circuitry involved in healthy individuals has motivated investigation of aberrant functioning of these brain areas in pathological behavior.
habitual responses and that extended substance abuse alters the circuits underlying S-R learning and replacement.
In contrast to the variety of experimental paradigms used to produce habitual responding in animal models, success in translating these paradigms to human subjects has been modest. The clinical application of studying compulsive drug use cited by many (Hogarth et al., 2013) has been met with limited success in human experimental methods. Behavioral studies in humans using outcome devaluation have shown goal-directed behavior to obtain cigarettes in young adult smokers, suggesting that in a less severe dependence state there is hyper-valuation of the drug reward where response selection is under the influence of the outcome and has not reached the opposite end of the continuum to become habitual (Hogarth and Chase, 2011; Hogarth, 2012). Additionally, non-contingent alcohol administration attenuated goal-directed control of food choice by rendering food selection insensitive to devaluation (Hogarth et al., 2012); these findings support the notion that exposure to drugs of abuse potentiates habit learning. Furthermore, a recent neuroimaging study in alcohol dependent patients demonstrated preferential habit-based responding during task performance at the expense of goal-directed behavior (Sjoerds et al., 2013). This is the first study to demonstrate the neural correlates of preferential habit-based responding in human addicts, although recruitment criteria indicated that participants were concurrently using psychoactive medications for depression and anxiety disorders, precluding the ability to attribute study outcome to alcohol use disorders. The studies in humans discussed above highlight the issues in measuring the acquisition of goal-directed versus habitual responding during experimental assessment of performance.
familiarity of cues in the natural environment and pre-exposure outside of the controlled lab setting. These issues represent pre-existing confounds that may account for individual differences in behavior that have not been adequately controlled for in human experimental studies. Additionally, several studies have used sensory specific satiety to test outcome devaluation, not only limiting the study sample to individuals presumed to enjoy these food options or drinks prior to study participation (e.g. fritos or chocolate), but also presenting an opportunity for previous taste aversion learning to accompany devaluation manipulations as well (Tricomi et al., 2004). As a control for these confounds, our task uses novel stimuli that can equate individuals on these factors that may bias learning. Moreover, previous studies of S-R learning in humans have been limited to simple one-to-one mapping of stimuli onto an equal number of manual response options (Deiber et al., 1997; Toni et al., 2001). Humans learn these associations very quickly, limiting their use for examining learning over time that requires higher order cognitive functions, including working memory faculties of the PFC. The task used in our behavioral study in individuals with a history of a substance use disorder (SUD) and control subjects measures both acquisition and execution of S-R learning over multiple time points to extend our understanding of habitual versus goal-directed response selection in humans. This research is critical to understanding whether general differences in S-R replacement ability occur in SUDs, as such deficits could hinder attempts to change habit-based responses to drug stimuli during recovery from addiction and thus promote relapse. Furthermore, findings from studies in addiction will promote testing of novel interventions designed to improve flexible control over response selection and potential identification of an intermediate phenotype for SUDs to help identify individuals at risk, ultimately improving SUD prevention.
Chapter 2: Materials and Methods
ParticipantsA total of 62 subjects were recruited from the University of North Carolina (UNC) at Chapel Hill and the surrounding community via advertisements. Subjects were recruited into one of two groups, based on whether they did (n=22 SUD) or did not (n=40 control subjects; CS) meet DSM-IV criteria for past drug or alcohol dependence in a structured clinical interview (Sheehan et al., 1998). SUD participants self-reported a minimum of 2 weeks of abstinence at the time of recruitment (M = 2 yrs
±
2.5 yrs). All subjects were healthy individuals 18-40 years old with no known history of neurological disorders, no current psychiatric diagnoses (n=5 SUDs met criteria for past depression) or psychoactive drug or medication use (excluding nicotine and caffeine), and reported an IQ within the normal range. Participants were screened for psychoactive drug use (Biotechnostix, Inc., Markham, ON), including alcohol (FC-10, Lifeloc Inc., Wheat Ridge, CO). Thirty-one additional participants were recruited, including 4 individuals meeting MINI criteria for a current psychiatric disorder, but were excluded from all analyses. Each subject provided written informed consent as approved by the UNC Office of Human Research Ethics.General Procedure
computerized S-R learning task (see “Behavioral Task”). Learning was then tested during Session 2.
Behavioral Inventories
We administered a number of standard questionnaires to quantify factors that could impact our results. We quantified alcohol use behavior with the Alcohol Use and Disorders Identification test (AUDIT) (Saunders et al., 1993) and substance use behavior with the Drug Use Screening Inventory, Domain I (DUSI-I) (Tarter, 1990) and the Drug Abuse Screening Test (DAST) (Skinner, 1982). We calculated density of familial alcohol abuse using the Family Tree Questionnaire (FTQ) (Mann et al., 1985). Neuropsychological questionnaires included the Barratt Impulsivity Scale (BIS-11) (Barratt, 1994), the Beck Depression Inventory (BDI) (Beck and Steer, 1987), Rotter’s Locus of Control scale (LOC) (Rotter, 1966), the State-Trait Anxiety Inventory (STAI) (Spielberger, 1985), the Thought Action Fusion scale (TAF) (Shafran et al., 1996) and the Antisocial Practices (APS) of the Minnesota Multiphasic Personality Inventory 2 (MMPI-2) (Butcher JN et al., 1990). Education and occupation were quantified with the Hollingshead Socioeconomic Status (SES) score (Hollingshead, 1975). We estimated IQ with the Shipley Institute of Living Scale (SILS) (Zachary, 1991).
Behavioral Task
participants first demonstrated retention of the previously learned (FAM) associations, then the learning task began. In the learning task, blocks of the two FAM sets were interspersed with blocks composed of two new (NOV) stimulus sets, to measure new S-R learning, and blocks of a control condition, consisting of novel, unrelated stimuli; blocks consisted of 15 randomly selected stimuli from the relevant set. Following 6 “runs” of 15 blocks each (3 per block type), subjects were informed that the correct responses for 2 sets (one FAM and one NOV set) had changed (response devaluation). Participants then learned the new correct S-R associations through trial and error. This response devaluation manipulation allows us to quantify habitual responding when attempting to overcome both well-learned (FAM) and freshly learned (NOV) S-R associations. Moreover, including FAM and NOV sets in which correct responses do not change allows us to account for effects of time and of context change.
Data Analysis
Our main index of performance was number of correct responses out of total responses across the twelve runs (6 runs each, pre- and post-devaluation) of the task. Our data structure is composed of 48 repeated measures, consisting of 4 stimulus set types (2 FAM, 2 NOV) that are measured within person over the 12 time points. We also collected reaction time data in each trial, and were able to assess error types (perseverative button press, other incorrect button press) post-devaluation to determine behavioral adaptation strategies utilized by participants. To test the significance of across group comparisons for demographic and psychological variables, we used unpaired two-tailed t-tests for continuous measures and 2 tests for categorical measures. All analyses include age and IQ as covariates. All data analyses were performed within SAS (Cary, NC).
Multilevel Modeling Strategy
post-devaluation yields increased power to detect within-subject change, with particular emphasis on the ability to compare pre-and post-devaluation trajectories and capture changes in performance. This analytical approach was used to determine changes in task performance parameters by adding SUD status to our model.
Multilevel modeling aims to account for variance at different levels within nested data. The first level unit of analysis is time, with 6 performance time points each during the pre-and post-devaluation phases. The second level unit of analysis is the person, and we assessed performance by the number of correct responses relative to the total number of responses. The second level estimates capture between-person variance in the rate of change of learning over time. Predictor variables are categorized into Level 1 (time-specific) and level 2 (person-specific) predictors based on the data structure. The models discussed below estimate two kinds of effects: fixed and random effects. Two models are fit to the data, and compared through changes in the -2log-likelihood to determine whether the addition of group status as a parameter improves model fit. Results for the models can be found in Table 2; fixed effects are presented in the top part of the table and random effects parameters are listed at the bottom. Significant parameters are marked with an asterisk.
We used a generalized linear mixed model to examine the change in the slope (
γ
10)
during performance throughout the S-R learning task prior to devaluation and changes in post-devaluation relative to pre-post-devaluation performance (
γ
20)
. The equation for this model can befound in Appendix 1. We centered the time variable at the sixth run to denote that the transition point would occur after this measurement; the intercept (
γ
00)
is therefore interpretable as thechanging S-R associations, and therefore added a predictor to establish the drop-off (
γ
30)
inperformance expected based on devaluation. To indicate that the stimulus set-type (FAM, NOV) varied across the task and that the correct response button changed post-devaluation, we created a variable to code for the set-type (
γ
40)
and a “newresponse” variable (γ
70)
to predictperformance based on whether the correct button response changed post-devaluation. In our task, response devaluation only occurred for one of each set type (1 FAM, 1 NOV), while the responses for the other FAM and NOV sets remained unchanged to control for general time and context effects.
We included age (
γ
01)
and IQ (γ
02)
at level 2, and these predictors were grand meancentered prior to being added to the model, to make the intercept and results interpretable as an individual at the average age and IQ for parameter estimates. We fit an initial model without group status as a predictor at level 2, and then added group status (
γ
03)
in the second model tocompute changes in the variance parameter estimates. The equation for this model can be found in Appendix 2. Model fit was assessed by comparing changes in the -2log-likelihood value between the two models that were fit. Additionally, we modeled 4 random effects: the intercept (
u
0j)
, the pre-devaluation learning period (u
1j),
the change in learning rate (u
2j)
post-devaluationrelative to pre-devaluation, and the drop-off (
u
3j)
in performance predicted to result fromdevaluation (Table 2).
To further characterize response selection after the post-devaluation manipulation, we fit a generalized linear mixed model to examine the change in the slope of incorrect, perseverative responses over time. The equation for this model can be found in Appendix 3. We defined perseverative errors as incorrect responses where participants selected the previously correct button as opposed to selecting a new button when response contingencies were changed post-devaluation. We centered the within-subject predictor of time (
γ
10) as the first time pointS-R replacement. At level 1 we also modeled the within subject factor of set-type (
γ
20) (FAM,NOV). At level 2, we included the between subject factors of grand mean centered age (
γ
01) andIQ (
γ
02) and group status (γ
03). Model fit was assessed by comparing changes in theChapter 3: Results
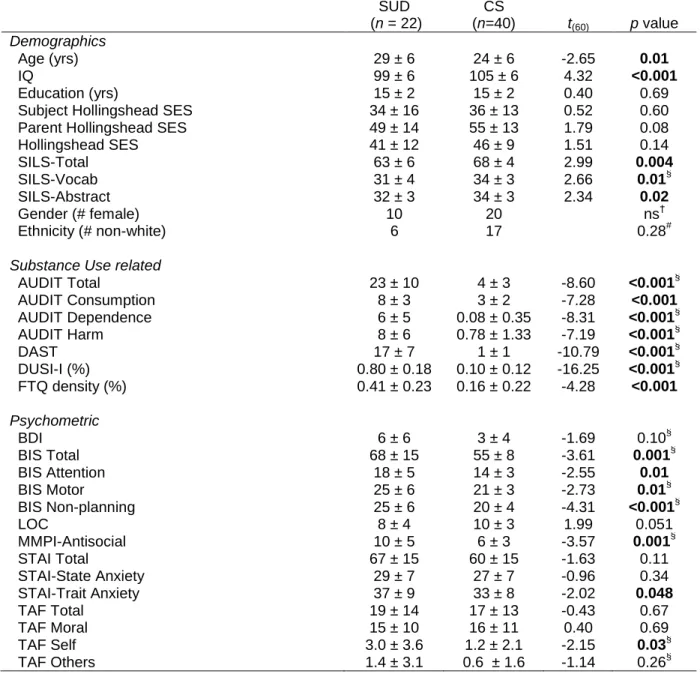
Demographic and Psychometric DataDemographic questionnaire measures demonstrate that there were no significant differences between the SUD and CS group in terms of education, SES, gender or ethnicity (Table 1). The two groups did, however, differ in terms of age and estimated IQ, with significantly lower average IQ and higher average age for the SUD group relative to the CS group. Between groups there were also significant differences in substance and alcohol use, such that SUD individuals had higher scores on all measures, including a higher family history of alcohol abuse (FTQ density; all p’s <0.001). Psychometric assessments demonstrated that
the SUD group was more impulsive (BIS), had higher antisocial scores (MMPI), was more likely to display trait anxiety (STAI-trait), and tended to be more focused on negative consequences for oneself (TAF).
Behavioral Performance during Training
Additionally, there were no significant differences between group in the amount of time between the initial training and testing study sessions (t(60)= 1.09, p=0.28).
Model 1: Initial Performance Model without SUD Status
A generalized linear mixed model with a binomial distribution to account for non-normally distributed data, with a logit link function to relate the linear predictor to the expected value of the response distribution, was specified to estimate the predicted number of correct responses out of total responses for each subject i at each time point j. In our initial model we found no significant main effects of age or IQ (Table 2). During learning of NOV sets and execution of FAM sets prior to devaluation, we observed significant main effects of set-type (t(2903)=10.41,
p<0.001) and time (t(2903)=15.34, p<0.001), and a significant interaction between set-type and time prior to devaluation (t(2903)=-11.78, p<0.001), demonstrating that, as expected, participants showed a greater rate of performance improvement in the NOV sets relative to FAM sets. A significant change in performance is evident after devaluation (t(2903)=-8.19, p<0.001), such that performance declines; this decline was specific to sets with devalued responses (t(2903)=-15.78,
p<0.001), requiring behavioral adaptation. Additionally, this drop-off effect is evident for FAM sets that change responses relative to NOV sets (t(2903)=5.45, p<0.001), suggesting less difficulty in overcoming FAM associations relative to more recently learned S-R associations.
Model 2: Final Performance Model with SUD Status
Group status was entered at level 2 to capture between groups differences within the analysis. The fixed effects from this model indicate similar results as demonstrated previously in model 1; adding group status did not qualitatively change the initial observations that occur for control subjects.
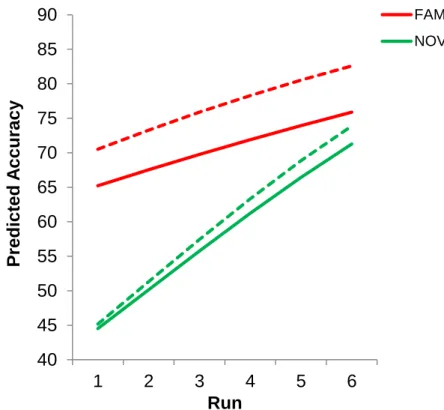
There was no significant interaction between pre-devaluation change in performance slope and group status (t(2892)=0.67, p=0.50), indicating that SUD subjects perform FAM sets and learn NOV sets similarly to the CS group (Figure 1; Table 2). Additionally, SUD individuals were predicted to perform better on FAM sets overall (t(2892)=4.14, p<0.001). Overall, this suggests that SUD participants are not impaired at this task, and are predicted to perform slightly better at well-established (FAM) S-R execution.
Perseverative Behavioral Indices
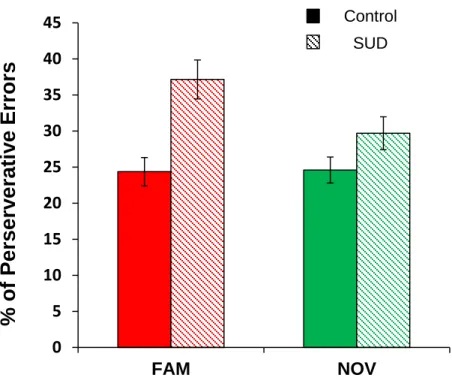
To further assess response selection post-devaluation, a one-way ANOVA between group for each set-type (FAM, NOV) indicated significant differences between groups for the overall percentage of perseverative errors for the FAM set-type. The SUD group made a higher percentage of perseverative errors during replacement of more well-established (FAM) S-R associations (F(1,58)=10.45, p=0.002; Figure 3). In contrast, no significant differences between groups for overall percentage of perseverative errors were evident for replacement of more recently established, NOV associations (F(1,58)=2.18, p=0.146; Figure 3). This indicates the habitual nature of FAM S-R associations in SUD participants.
Model 1: Initial Perseverative Model without SUD Status
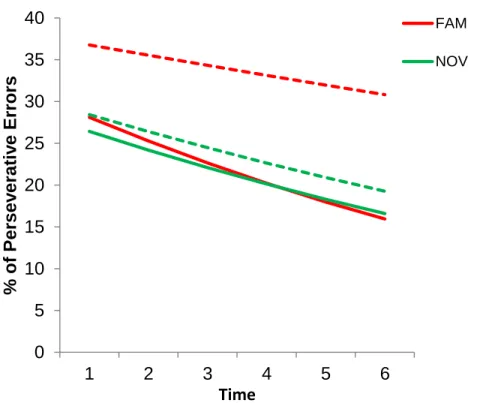
To further examine perseverative responding over time, we used a generalized linear mixed model with a binomial distribution and logit link function to predict the ratio of perseverative errors to total errors during performance in the post-devaluation phase. We found no significant main effects of age or IQ (Table 3). Significant main effects of set-type and time indicated that the number of perseverative errors in the FAM condition was significantly higher relative to the NOV condition (t(679)=2.81, p=0.005) and number of perseverative errors declined over time (t(679)=-5.37, p<0.001). There was no set-type by time interaction (t(679)=0.33, p=0.75). Model 2: Final Perseverative Model with SUD Status
Group status was entered at level 2 to account for between group differences within our analysis. For control subjects, there was no significant difference in the number of perseverative errors between sets (t(676) = 1.29, p=0.20) (Table 3). Additionally, the number of perseverative errors declined over time (t(676)=-4.42, p<0.001) and there was no set-type by time interaction (t(676)=-0.80, p=0.42), similar to the previously estimated model effects (Table 3).
The addition of group status did not result in a significant main effect of group (t(58)=0.61,
Chapter 4: Discussion
To the best of our knowledge, this is the first study providing behavioral evidence for perseverative responding for habit-based actions, with no overall global impairments in S-R association learning, in abstinent individuals with a history of a SUD. We demonstrate that this S-R task can measure learning over time and utilizes a devaluation manipulation that can distinguish habit-based from goal-directed responding for S-R associations. We further provide evidence that our task allows an examination of changes within learning trajectories over time, at the individual level as well as between groups. The data support our first hypothesis that the SUD group was not impaired at new learning relative to controls; interestingly, they were slightly better at executing learned FAM associations that were predicted to be habit-based. Furthermore, we examined error types during response replacement following devaluation, demonstrating that the SUD group is impaired in overwriting well-established (FAM) associations. The SUD group was more likely to show an increase in the percentage of perseverative errors overall during the post-devaluation phase specific to FAM associations, and a persistent increase in percentage of perseverative errors for FAM sets that was less likely to decline over time post-devaluation. Taken together, the data suggest a greater propensity to acquire S-R associations in SUD history participants that result in perseverative responding specific to over-trained, habit-based (FAM) associations, ultimately making replacement of habit-based responses most difficult.
study cannot determine whether habit-based action selection is a pre-existing risk factor for the development of addiction or whether this behavioral response strategy reflects a consequence of extended drug use. A further limitation of our study includes the SUD sample studied. Participants were recruited based on any history of drug or alcohol use, and therefore we are limited in extending our findings to a specific drug class or alcohol. It is unknown whether differences in poly-substance dependence history versus selective use of a particular drug type may result in differences in S-R learning and perseverative behavior based on this study; variation in disease severity may result in differences in perseverative responding. Finally, our SUD study group was limited to individuals not currently using psychoactive medications or actively seeking treatment. The use of pharmacotherapy treatment for SUDs may result in decreases in perseverative responding over treatment associated with medication status. These limitations point to future avenues of interest that will help parse differences in habit-based responding in addiction.
that atypical functioning in the circuits subserving S-R learning and replacement contribute to addictive behaviors.
Recent work aimed at understanding the role of the prefrontal cortex in goal-versus habit-based responding used transcranial magnetic stimulation (TMS) and biological assays of stress to show a relationship between working memory capacity requiring frontal brain regions and stress as important factors that underlie the contribution of goal-directed versus habit-based behavioral strategies. Smittenaar et al. (2013) demonstrated that disruption of the right DLPFC through TMS rendered performance habit-based, while disruption of the left DLPFC impaired goal-directed behavior in individuals with low working memory capacity. Working memory capacity has been further posited to relate to susceptibility of stress, such that acute stress attenuates goal-directed behavioral contributions in task performance (Otto et al., 2013). These results lend further support to previous literature demonstrating a stress-induced shift in behavior from goal-directed to habit-based responding (Schwabe and Wolf, 2010; Schwabe et al., 2011; Schwabe and Wolf, 2011), and highlights the potential underlying protective mechanism of working memory capacity. Understanding whether stress can potentiate habitual behaviors that may in turn promote drug use is important for identifying mechanisms that may predict relapse. Future work aimed at further delineating the factors within this relationship may have major implications in our understanding of treatment interventions for substance use disorders.
APPENDIX 1: MODEL 1 – INITIAL PERFORMANCE MODEL WITHOUT SUD STATUS
Response Distribution:
Linear Predictor:
= β
0j+ β
1jTrend1
ij+ β
2jChangetrend
ij+ β
3jDropoff
ij+ β
4jNovel
ij+
β
5jTrend1
ijNovel
ij+ β
6jDropoff
ijNovel
ij+ β
7jDropoff
ijNewResponse
ij+
β
8jDropoff
ijNovel
ijNewResponse
ij+ β
9jchangetrend
ijNewResponse
ij+
β
10jchangetrend
ijNovel
ij+ β
11jchangetrend
ijNovel
ijNewResponse
ij+ r
ij[
] ([
] [
])
Level 2:
β
0j= γ
00+ γ
01Age + γ
02IQ + u
0jβ
1j= γ
10+ u
1jβ
2j= γ
20+ u
2jβ
3j= γ
30+ u
3jβ
4j= γ
40β
5j= γ
50β
6j= γ
60β
7j= γ
70β
8j= γ
80β
9j= γ
90β
10j= γ
100APPENDIX 1 (CONT.)
Link Function:
= logit
Reduced form equation:
Accuracy
ij= γ
00+ γ
01Age + γ
02IQ
+ γ
10Trend1
ij+ γ
20changetrend
ij+ γ
30dropoff
ij+ γ
40Novel
ij+
γ
50Trend1
ijNovel
ij+ γ
60Dropoff
ijNovel
ij+ γ
70Dropoff
ijNewResponse
ij+
γ
80Dropoff
ijNovel
ijNewResponse
ij+ γ
100changetrend
ijNovel
ij+
γ
110changetrend
ijNovel
ijNewResponse
ij+ u
0j+ u
1jTrend1
ij+ u
2jchangetrend
ij+
APPENDIX 2: MODEL 2 – FINAL PERFORMANCE MODEL WITH SUD STATUS
Response Distribution:
Linear Predictor:
= β
0j+ β
1jTrend1
ij+ β
2jChangetrend
ij+ β
3jDropoff
ij+ β
4jNovel
ij+
β
5jTrend1
ijNovel
ij+ β
6jDropoff
ijNovel
ij+ β
7jDropoff
ijNewResponse
ij+
β
8jDropoff
ijNovel
ijNewResponse
ij+ β
9jchangetrend
ijNewResponse
ij+
β
10jchangetrend
ijNovel
ij+ β
11jchangetrend
ijNovel
ijNewResponse
ij+ r
ij[
] ([
] [
])
Level 2:
β
0j= γ
00+ γ
01Age + γ
02IQ
+ γ
03Group
j+ u
0jβ
1j= γ
10+ γ
11Group
j+ u
1jβ
2j= γ
20+ γ
21Group
j+ u
2jβ
3j= γ
30+ γ
31Group
j+ u
3jβ
4j= γ
40+ γ
41Group
jβ
5j= γ
50+ γ
51Group
jβ
6j= γ
60+ γ
61Group
jβ
7j= γ
70+ γ
71Group
jβ
8j= γ
80+ γ
81Group
jβ
9j= γ
90+ γ
91Group
jβ
10j= γ
100+ γ
101Group
jAPPENDIX 2 (CONT.)
Link Function:
= logit
Reduced form equation:
Accuracy
ij= γ
00+ γ
01Age + γ
02IQ
+ γ
10Trend1
ij+ γ
20changetrend
ij+ γ
30dropoff
ij+ γ
40Novel
ij+
γ
50Trend1
ijNovel
ij+ γ
60Dropoff
ijNovel
ij+ γ
70Dropoff
ijNovel
ij+
γ
80Dropoff
ijNovel
ij+ γ
90changetrend
ijNewResponse
ij+ γ
100changetrend
ijNovel
ij+
γ
110changetrend
ijNovel
ijNewResponse
ij+ γ
11Group
jTrend1
ij+
γ
21Group
jchangetrend
ij+ γ
31Group
jdropoff
ij+ γ
41Group
jNovel
ij+
γ
51Group
jγ
50Trend1
ijNovel
ij+ γ
61Group
jγ
60Dropoff
ijNovel
ij+
γ
71Group
jγ
70Dropoff
ijNewResponse
ij+
γ
81Group
jDropoff
ijNovel
ijNewResponse
ij+
γ
91Group
jγ
90changetrend
ijNewResponse
ij+ γ
101Group
jchangetrend
ijNovel
ij+
γ
111Group
jγ
110changetrend
ijNovel
ijNewResponse
ij+ u
0j+ u
1jTrend1
ij+ u
2jchangetrend
ij+
APPENDIX 3: FINAL PERSEVERATIVE MODEL WITH SUD STATUS
Response Distribution:
Linear Predictor:
= β
0j+ β
1jTime
ij+ β
2jNovel
ij+ β
3jTime
ijNovel
ij+ r
ij[
] ([
] [
])
Level 2:
β
0j= γ
00+ γ
01Age + γ
02IQ
+ γ
03Group
j+
u
0jβ
1j= γ
10+ u
1jβ
2j= γ
20β
3j= γ
30Link Function:
= logit
Reduced form equation:
PerseverativeErrors
ij= γ
00+ γ
01Age + γ
02IQ + γ
03Group
j+ γ
10Time
ij+ γ
20Novel
ij+
REFERENCES
Balleine BW, O'Doherty JP (2010) Human and rodent homologies in action control: corticostriatal determinants of goal-directed and habitual action.
Neuropsychopharmacology 35:48-69.
Barratt, ES (1994) Impulsiveness and aggression. In: Violence and mental disorder: Developments in risk assessment, pp 61-79. Chicago: University of Chicago Press.
Beck AT, & Steer RA (1987) Manual for the Revised Beck Depression Inventory. San Antonio, TX: Psychological Corporation.
Belin D, & Everitt BJ (2008) Cocaine seeking habits depend upon dopamine-dependent serial connectivity linking the ventral with the dorsal striatum. Neuron 57:432-441.
Boettiger CA, & D'Esposito M (2005) Frontal networks for learning and executing arbitrary stimulus - response associations. Journal of Neuroscience 25:2723-2732.
Boettiger CA, Singer AC, Sun FT, & D'Esposito M (2004) Identifying frontal networks for replacing well-established response associations. In: Society for Neuroscience Abstracts, San Diego .
Butcher JN, Graham JR, Williams CL, & YS B-P (1990) Development and Use of the MMPI-2 Content Scales. In, p pp 196. Minneapolis: University of Minnesota Press.
Corbit LH, Nie H, & Janak PH (2012) Habitual alcohol seeking: Time course and the contribution of subregions of the dorsal striatum. I 72:389-395.
Coutureau E, & Killcross S (2003) Inactivation of the infralimbic prefrontal cortex reinstates goal-directed responding in overtrained rats. Behavioural Brain Research 146:167-174.
Daw ND, Niv Y, & Dayan P (2005) Uncertainty-based competition between prefrontal and dorsolateral striatal systems for behavioral control. Nature Neuroscience 8:1704-1711.
Daw ND, Gershman SJ, Seymour B, Dayan P, & Dolan RJ (2011) Model-Based Influences on Humans' Choices and Striatal Prediction Errors. Neuron 69:1204-1215.
de Wit S, Corlett PR, Aitken MR, Dickinson A, & Fletcher PC (2009) Differential engagement of the ventromedial prefrontal cortex by goal-directed and habitual behavior toward food pictures in humans. Journal of Neuroscience 29:11330-11338.
de Wit S, Watson P, Harsay HA, Cohen MX, van de Vijver I, & Ridderinkhof KR (2012) Corticostriatal connectivity underlies individual differences in the balance between habitual and goal-directed action control. Journal of Neuroscience 32:12066-12075.
Deiber MP, Wise SP, Honda M, Catalan MJ, Grafman J, & Hallett M (1997) Frontal and parietal networks for conditional motor learning: a positron emission tomography study. Journal of Neurophysiology 78:977-991.
DePoy L, Daut R, Brigman JL, MacPherson K, Crowley N, Gunduz-Cinar O, Pickens CL, Cinar R, Saksida LM, Kunos G, Lovinger DM, Bussey TJ, Camp MC, & Holmes A (2013) Chronic alcohol produces neuroadaptations to prime dorsal striatal learning.
Proceedings from the National Academy of Sciences, U S A 110:14783-14788.
Dickinson A (1985) Action and habits – The development of behavioral autonomy. Philosophical Transactions of the Royal Society of London Series B-Biological Sciences 308:67-78.
Dickinson A, Wood N, &Smith JW (2002) Alcohol seeking by rats: action or habit? Quarterly Journal of Experimental Psychology B 55:331-348.
Ersche KD, Jones PS, Williams GB, Turton AJ, Robbins TW, & Bullmore ET (2012) Abnormal brain structure implicated in stimulant drug addiction. Science 335:601-604.
Fanelli RR, Klein JT, Reese RM, & Robinson DL (2013) Dorsomedial and dorsolateral striatum exhibit distinct phasic neuronal activity during alcohol self-administration in rats.
European Journal of Neuroscience 38:2637-2648.
Feltenstein MW, & See RE (2008) The neurocircuitry of addiction: an overview. British Journal of Pharmacology 154:261-274.
Hogarth L (2012) Goal-directed and transfer-cue-elicited drug-seeking are dissociated by
pharmacotherapy: evidence for independent additive controllers. Journal of Experimetnal Psychology: Animal Behavior Processes 38:266-278.
Hogarth L, Attwood AS, Bate HA, & Munafo MR (2012) Acute alcohol impairs human goal-directed action. Biological Psychology 90:154-160.
Hogarth L, Balleine BW, Corbit LH,& Killcross S (2013) Associative learning mechanisms underpinning the transition from recreational drug use to addiction. Annals of the New York Academy of Sciences 1282:12-24.
Hollingshead A (1975) Hollingshead's Four Factor Index of Social Status. New Haven, CT: Yale University Press.
Jackson ME, & Moghaddam B (2001) Amygdala regulation of nucleus accumbens dopamine output is governed by the prefrontal cortex. Journal of Neuroscience 21:676-681.
Jentsch JD, Olausson P, De la Garza R, &Taylor JR (2002) Impairments of reversal learning and response perseveration after repeated, intermittent cocaine administrations to monkeys. Neuropsychopharmacology 26:183-190.
Konova AB, Moeller SJ, Tomasi D, Parvaz MA, Alia-Klein N, Volkow ND, &Goldstein RZ (2012) Structural and behavioral correlates of abnormal encoding of money value in the
sensorimotor striatum in cocaine addiction. European Journal of Neuroscience 36:2979-2988.
Mann RE, Sobell LC, Sobell MB, & Pavan D (1985) Reliability of a family tree questionnaire for assessing family history of alcohol problems. Drug and Alcohol Dependence 15:61-67.
Olausson P, Jentsch JD, Krueger DD, Tronson NC, Nairn AC, &Taylor JR (2007) Orbitofrontal cortex and cognitive-motivational impairments in psychostimulant addiction. Annals of the New York Academy of Sciences 1121:610-638.
Ostlund SB, & Balleine BW (2008) On habits and addiction: An associative analysis of compulsive drug seeking. Drug Discovery Today: Disease Models 5:235-245.
Otto AR, Raio CM, Chiang A, Phelps EA, & Daw ND (2013) Working-memory capacity protects model-based learning from stress. Proceedings from the National Academy of Sciences, U S A 110(52):20941-20946.
Park SQ, Kahnt T, Beck A, Cohen MX, Dolan RJ, Wrase J, & Heinz A (2010) Prefrontal cortex fails to learn from reward prediction errors in alcohol dependence. Journal of
Rotter JB (1966) Generalized expectancies for internal versus external control of reinforcement.
Psychological monographs 80:1-28.
Saunders JB, Aasland OG, Babor TF, de la Fuente JR, & Grant M (1993) Development of the Alcohol Use Disorders Identification Test (AUDIT): WHO Collaborative Project on Early Detection of Persons with Harmful Alcohol Consumption--II. Addiction (Abingdon, England) 88:791-804.
Schwabe L, & Wolf OT (2010) Socially evaluated cold pressor stress after instrumental learning favors habits over goal-directed action. Psychoneuroendocrinology 35:977-986.
Schwabe L, & Wolf OT (2011) Stress-induced modulation of instrumental behavior: from goal-directed to habitual control of action. Behavioral Brain Research 219:321-328.
Schwabe L, Hoffken O, Tegenthoff M, & Wolf OT (2011) Preventing the stress-induced shift from goal-directed to habit action with a beta-adrenergic antagonist. Journal of Neuroscience 31:17317-17325.
Shafran R, Thordarson DS, & Rachman S (1996) Thought-action fusion in obsessive compulsive disorder. Journal of Anxiety Disorders 10:379-391.
Sheehan DV, Lecrubier Y, Sheehan KH, Amorim P, Janavs J, Weiller E, Hergueta T, Baker R, & Dunbar GC (1998) The Mini-International Neuropsychiatric Interview (M.I.N.I.): the development and validation of a structured diagnostic psychiatric interview for DSM-IV and ICD-10. The Journal of Clinical Psychiatry 59 Suppl 20:22-33;quiz 34-57.
Sjoerds Z, de Wit S, W van de Brink, Robbins TW, Beekman ATF, Penninx BWJH, & Veltman DJ (2013) Behavioral and neuroimaging evidence for overreliance on habit learning in alcohol-dependent patients. Translational Psychiatry 1-8.
Skinner HA (1982) The drug abuse screening test. Addictive Behaviors 7:363-371.
Smith, Virkud A, Deisseroth K, & Graybiel AM (2012) Reversible online control of habitual behavior by optogenetic perturbation of medial prefrontal cortex. Proceedings of the National Academy of Sciences of the United States of America 109:18932-18937.
Smittenaar P, FitzGerald THB, Romei V, Wright ND, & Dolan RJ (2013) Disruption of
Spielberger C (1985) Assessment of state and trait anxiety: conceptual and methodological issues. South Psychology 2:6-16.
Tarter RE (1990) Evaluation and treatment of adolescent substance abuse: a decision tree method. The American Journal of Drug and Alcohol Abuse 16:1-46.
Toni I, Ramnani N, Josephs O, Ashburner J, & Passingham RE (2001) Learning arbitrary visuomotor associations: temporal dynamic of brain activity. Neuroimage 14:1048-1057.
Tran-Tu-Yen DAS, Marchand AR, Pape JR, Di Scala G, &Coutureau E (2009) Transient role of the rat prelimbic cortex in goal-directed behaviour. European Journal of Neuroscience
30:464-471.
Tricomi EM, Delgado MR, & Fiez JA (2004) Modulation of caudate activity by action contingency. Neuron 41:281-292.
Valentin VV, Dickinson A, & O'Doherty JP (2007) Determining the neural substrates of goal-directed learning in the human brain. Journal of Neuroscience 27:4019-4026.
Volkow ND, Tomasi D, Wang G-J, Fowler JS, Telang F, Goldstein RZ, Alia-Klein N, & Wong C (2011) Reduced metabolism in brain "Control Networks" following cocaine-cues
exposure in female cocaine abusers. Plos One 6.
Yin HH, Knowlton BJ,& Balleine BW (2006) Inactivation of dorsolateral striatum enhances sensitivity to changes in the action-outcome contingency in instrumental conditioning.
Behavioural Brain Research 166:189-196.
Zachary R (1991) Shipley Institute of Living Scale: Revised Manual. Los Angeles: Western Psychological Services.
Table 1.Sample Demographics and Psychometric Data
SUD
(n = 22)
CS
(n=40) t(60) p value
Demographics
Age (yrs) 29 ± 6 24 ± 6 -2.65 0.01
IQ 99 ± 6 105 ± 6 4.32 <0.001
Education (yrs) 15 ± 2 15 ± 2 0.40 0.69
Subject Hollingshead SES 34 ± 16 36 ± 13 0.52 0.60
Parent Hollingshead SES 49 ± 14 55 ± 13 1.79 0.08
Hollingshead SES 41 ± 12 46 ± 9 1.51 0.14
SILS-Total 63 ± 6 68 ± 4 2.99 0.004
SILS-Vocab 31 ± 4 34 ± 3 2.66 0.01§
SILS-Abstract 32 ± 3 34 ± 3 2.34 0.02
Gender (# female) 10 20 ns†
Ethnicity (# non-white) 6 17 0.28#
Substance Use related
AUDIT Total 23 ± 10 4 ± 3 -8.60 <0.001§
AUDIT Consumption 8 ± 3 3 ± 2 -7.28 <0.001
AUDIT Dependence 6 ± 5 0.08 ± 0.35 -8.31 <0.001§
AUDIT Harm 8 ± 6 0.78 ± 1.33 -7.19 <0.001§
DAST 17 ± 7 1 ± 1 -10.79 <0.001§
DUSI-I (%) 0.80 ± 0.18 0.10 ± 0.12 -16.25 <0.001§
FTQ density (%) 0.41 ± 0.23 0.16 ± 0.22 -4.28 <0.001
Psychometric
BDI 6 ± 6 3 ± 4 -1.69 0.10§
BIS Total 68 ± 15 55 ± 8 -3.61 0.001§
BIS Attention 18 ± 5 14 ± 3 -2.55 0.01
BIS Motor 25 ± 6 21 ± 3 -2.73 0.01§
BIS Non-planning 25 ± 6 20 ± 4 -4.31 <0.001§
LOC 8 ± 4 10 ± 3 1.99 0.051
MMPI-Antisocial 10 ± 5 6 ± 3 -3.57 0.001§
STAI Total 67 ± 15 60 ± 15 -1.63 0.11
STAI-State Anxiety 29 ± 7 27 ± 7 -0.96 0.34
STAI-Trait Anxiety 37 ± 9 33 ± 8 -2.02 0.048
TAF Total 19 ± 14 17 ± 13 -0.43 0.67
TAF Moral 15 ± 10 16 ± 11 0.40 0.69
TAF Self 3.0 ± 3.6 1.2 ± 2.1 -2.15 0.03§
TAF Others 1.4 ± 3.1 0.6 ± 1.6 -1.14 0.26§
Values are reported as mean ± standard deviation. Reported p-values reflect the results of unpaired
two-tailed comparison between groups. SUD, History of substance use disorder subject; CS, Control subject; IQ, Intelligence Quotient; SES, Socioeconomic Status; AUDIT, Alcohol Use Disorders Identification Test; DAST, Drug Abuse Screening Test; DUSI-I, Drug Use Screening Inventory, Domain I; FTQ, Family Tree Questionnaire; BDI, Beck Depression Index; BIS, Barratt Impulsivity Scale; LOC, Locus of Control; MMPI, Minnesota Multiphasic Personality Inventory; SILS, Shipley Institute of Living Scale; STAI, State-Trait
Anxiety Inventory; TAF, Thought Action Fusion Scale. Boldface indicates significant values. §p-value
represents results from Satterthwaite method for unequal variances. †p-value represents results of 2 test.
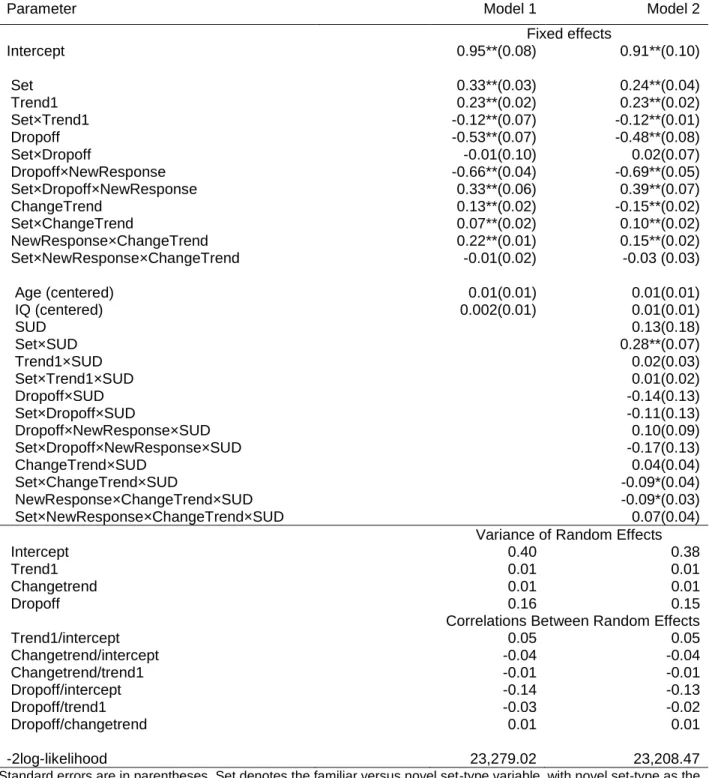
Table 2. Fixed Effect Estimates (Top) and Variance-Covariance Estimates (Bottom) for Models of the Predictors of Learning Behavior.
Parameter Model 1 Model 2
Fixed effects
Intercept 0.95**(0.08) 0.91**(0.10)
Set 0.33**(0.03) 0.24**(0.04)
Trend1 0.23**(0.02) 0.23**(0.02)
Set×Trend1 -0.12**(0.07) -0.12**(0.01)
Dropoff -0.53**(0.07) -0.48**(0.08)
Set×Dropoff -0.01(0.10) 0.02(0.07)
Dropoff×NewResponse -0.66**(0.04) -0.69**(0.05)
Set×Dropoff×NewResponse 0.33**(0.06) 0.39**(0.07)
ChangeTrend 0.13**(0.02) -0.15**(0.02)
Set×ChangeTrend 0.07**(0.02) 0.10**(0.02)
NewResponse×ChangeTrend 0.22**(0.01) 0.15**(0.02)
Set×NewResponse×ChangeTrend -0.01(0.02) -0.03 (0.03)
Age (centered) 0.01(0.01) 0.01(0.01)
IQ (centered) 0.002(0.01) 0.01(0.01)
SUD 0.13(0.18)
Set×SUD 0.28**(0.07)
Trend1×SUD 0.02(0.03)
Set×Trend1×SUD 0.01(0.02)
Dropoff×SUD -0.14(0.13)
Set×Dropoff×SUD -0.11(0.13)
Dropoff×NewResponse×SUD 0.10(0.09)
Set×Dropoff×NewResponse×SUD -0.17(0.13)
ChangeTrend×SUD 0.04(0.04)
Set×ChangeTrend×SUD -0.09*(0.04)
NewResponse×ChangeTrend×SUD -0.09*(0.03)
Set×NewResponse×ChangeTrend×SUD 0.07(0.04)
Variance of Random Effects
Intercept 0.40 0.38
Trend1 0.01 0.01
Changetrend 0.01 0.01
Dropoff 0.16 0.15
Correlations Between Random Effects
Trend1/intercept 0.05 0.05
Changetrend/intercept -0.04 -0.04
Changetrend/trend1 -0.01 -0.01
Dropoff/intercept -0.14 -0.13
Dropoff/trend1 -0.03 -0.02
Dropoff/changetrend 0.01 0.01
-2log-likelihood 23,279.02 23,208.47
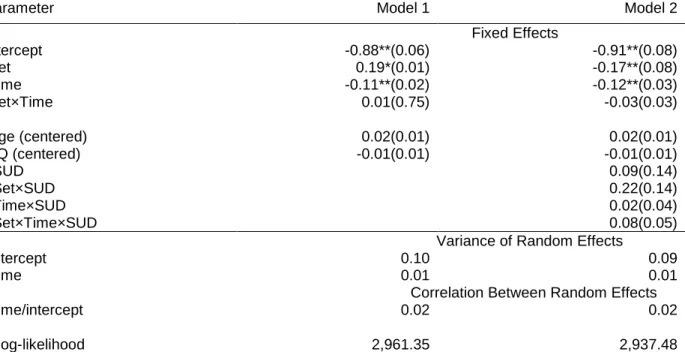
Table 3. Fixed Effect Estimates (Top) and Variance-Covariance Estimates (Bottom) for Models of the Predictors of Perseverative Behavior
Parameter Model 1 Model 2
Fixed Effects
Intercept -0.88**(0.06) -0.91**(0.08)
Set 0.19*(0.01) -0.17**(0.08)
Time -0.11**(0.02) -0.12**(0.03)
Set×Time 0.01(0.75) -0.03(0.03)
Age (centered) 0.02(0.01) 0.02(0.01)
IQ (centered) -0.01(0.01) -0.01(0.01)
SUD 0.09(0.14)
Set×SUD 0.22(0.14)
Time×SUD 0.02(0.04)
Set×Time×SUD 0.08(0.05)
Variance of Random Effects
Intercept 0.10 0.09
Time 0.01 0.01
Correlation Between Random Effects
Time/intercept 0.02 0.02
-2log-likelihood 2,961.35 2,937.48
Standard errors are in parentheses. Set denotes the familiar versus novel set-type variable, with novel
set-type as the reference category. Time indicates the slope of performance during post-devaluation time points.
SUD, substance use disorder. The random parameters represent the variance and covariance estimates generated from inclusion of random effects in the model. The -2log-likelihood demonstrates the value for
Figure 1. Predicted accuracy over time for FAM (red) and NOV (green) sets by group prior to devaluation. Solid lines represent the control group and dashed lines represent the SUD history group.
40
45
50
55
60
65
70
75
80
85
90
1
2
3
4
5
6
P
re
dic
ted
A
c
c
ura
c
y
Run
FAM
Figure 2. Predicted accuracy over time for FAM (red, top) and NOV (green, bottom) sets by group pre-and post-devaluation. Blue lines indicate sets for each set-type (FAM, NOV) that do not change response contingencies post-devaluation. Solid lines represent the control group and dashed lines represent the SUD history group.
40
45
50
55
60
65
70
75
80
85
90
1
2
3
4
5
6
7
8
9
10
11
12
P
re
dic
ted
A
c
c
ura
c
y
Run Deval NonDeval40
45
50
55
60
65
70
75
80
85
90
1
2
3
4
5
6
7
8
9
10
11
12
P
re
dic
ted
A
c
c
ura
c
y
Run Deval NonDevalPre-Devaluation
Post-Devaluation
Pre-Devaluation
Post-Devaluation
FAM Sets
Figure 3. Percentage of perseverative errors by group during the post-devaluation phase. NOV stimulus set is depicted in green and FAM stimulus set is depicted in red. Solid bars denote the control group and hatched bars denote the SUD history group. Errors bars represent standard error of the mean.
0
5
10
15
20
25
30
35
40
45
FAM
NOV
%
o
f
Per
ser
v
er
ati
v
e
Er
ro
rs
Figure 4. Predicted perseverative errors over time for FAM (red) and NOV (green) sets by group post-devaluation. Solid lines represent the control group and dashed lines represent the SUD history group.
0
5
10
15
20
25
30
35
40
1
2
3
4
5
6
%
of
P
e
rs
e
v
e
ra
tiv
e
E
rrors
Time
FAM