T
HEE
FFECT OFP
ARENTALI
NVOLVEMENT AND ITSA
SSOCIATEDP
OLICIESON
S
TUDENTO
UTCOMESKristina Vaughan
A dissertation submitted to the faculty of the University of North Carolina at Chapel Hill in par-tial fulfillment of the requirements for the degree of Doctor of Philosophy in the Department of
Economics.
Chapel Hill 2019
Approved by:
David K. Guilkey
ABSTRACT
KRISTINA VAUGHAN: The Effect of Parental Involvement and its Associated Policies on Student Outcomes.
(Under the direction of David K. Guilkey and Jane Cooley-Fruehwirth)
In an effort to get parents more involved in their child’s schooling, 14 states have implemented
a policy and a further four states have pending bills that would allow parents time off from their
place of work to participate in their child’s schooling. In the first chapter, I examine the effect
of these school-related leave policies on cognitive and non-cognitive outcomes, and identify some
potential mechanisms through which these policies can operate. I find evidence that the policy
affects math skills, whereby an additional hour off of work leads to a 0.005 standard deviation
increase in math skills. I identify increases in the probability of volunteering, attending a back
school night, and maternal employment and home inputs as potential mechanisms for this effect.
Despite recent state and federal initiatives emphasizing parental involvement in schools as a
way to improve child outcomes, there is little empirical evidence of the effects of parental
in-volvement, largely due to the empirical challenges involved in establishing causality. In the second
chapter, I study the effects of parental involvement on cognitive and non-cognitive outcomes as
stu-dents progress through school. I address key challenges in the literature such as the non-random
nature of parental involvement and the exclusion of related input decisions such as home inputs,
employment, and fertility decisions that have the potential to affect and be affected by parental
place of work to participate in their child’s schooling. I find that allowing parents the maximum of
40 hours off per year to participate in their child’s school leads to increases in non-cognitive skills
ACKNOWLEDGMENTS
This project would have never been completed without the guidance and support of my advisors,
David K. Guilkey and Jane Cooley-Fruehwirth. I am also grateful to my dissertation committee
members, Helen Tauchen, Luca Flabbi, and Ju Hyun Kim for their guidance and encouragement
and for helpful comments from participants in the UNC - Chapel Hill Applied Microeconomics
TABLE OF CONTENTS
LIST OF TABLES . . . x
LIST OF FIGURES . . . xiii
1 The Effect of State School-Related Leave Policies on Student Outcomes . . . 1
1.1 Introduction . . . 1
1.2 Data . . . 4
1.3 Empirical Framework . . . 6
1.3.1 Identification . . . 7
1.4 Results . . . 8
1.4.1 Heterogeneous Policy Effects . . . 11
1.4.2 Mechanisms . . . 16
1.5 Conclusion . . . 25
2 The Effect of Parental Involvement on Student Outcomes . . . 27
2.1 Introduction . . . 27
2.2 Data . . . 32
2.3.4 Dynamic Problem . . . 40
2.3.5 Approximation to the solution of the parent’s problem . . . 41
2.4 Empirical Framework . . . 42
2.4.1 Full Information Maximum Likelihood . . . 43
2.4.2 Identification . . . 45
2.5 Results . . . 50
2.5.1 Production Function Estimates . . . 50
2.5.2 Input Decisions . . . 56
2.5.3 Robustness Checks . . . 60
2.5.4 Heterogeneity Analysis . . . 62
2.5.5 Life-Cycle Effects . . . 62
2.6 Policy Simulations . . . 65
2.6.1 State School-Related Leave Policies . . . 65
2.6.2 Policy Simulations . . . 67
2.7 Conclusion . . . 74
Appendices . . . 76
A.1 Appendix for Chapter 1 . . . 76
A.1.1 Tables and Figures . . . 76
D.2.1 Robustness Checks . . . 87
E.2.1 Simulation Procedure . . . 89
F.2.1 Tables . . . 91
G.2.1 Figures . . . 106
LIST OF TABLES
1.1 Test of Equivalence of Means . . . 8
1.2 Effects of the State School-Related Leave Policy . . . 9
1.3 Effect of the Policy on Different Components of Non-Cognitive Skills . . . 9
1.4 Non-linearities in the Effects of the State School-Related Leave Policy . . . 10
1.5 Heterogeneous Effects of the Policy on Outcomes by Grade (Time) . . . 11
1.6 Logit Equation of the Determinants of Maternal Employment . . . 12
1.7 Heterogeneous Effects of the Policy on Outcomes by Education Status . . . 13
1.8 Heterogeneous Effects of the Policy on Outcomes by Race . . . 14
1.9 Heterogeneous Effects of the Policy on Outcomes by Language . . . 14
1.10 Heterogeneous Effects of the Policy on Outcomes by Household Income . . . 15
1.11 Heterogeneous Effects of the Policy on Outcomes by Family Structure . . . 15
1.12 Potential Parental Involvement Mechanisms . . . 17
1.13 Potential Alternate Mechanisms . . . 18
1.14 Heterogeneous Effects of the Policy on Mechanisms by Race . . . 19
1.15 Heterogeneous Effects of the Policy on Alternate Mechanisms by Race . . . 20
2.2 Math Skills under OLS and Full Information Maximum Likelihood . . . 54
2.3 Non-Cognitive Skills under OLS and Full Information Maximum Likelihood . . . 55
2.4 Mass Points and Probabilities-Baseline Model . . . 56
2.5 Math, Reading and Non-Cognitive Skills-School Correlated Random Effects . . . 61
2.6 Mass Points and Probabilities-School Correlated Random Effects . . . 61
2.7 Heterogeneous Effects of Parental Involvement on Outcomes . . . 63
2.8 Mass Points and Probabilities-Heterogeneity Analysis . . . 63
2.9 Life-Cycle Effects of Volunteering vs Not Volunteering . . . 64
2.10 Life-Cycle Effects of Conference vs No Conference . . . 65
2.11 Actual and Simulated Model Fit . . . 68
A.1.1 Mean and Standard Deviation of Select Characteristics . . . 76
A.1.2 Annual Hours of School-Related Leave by State . . . 77
A.1.3 Mean and Standard Deviation of Skills . . . 78
A.1.4 Mean and Standard Deviation of Select Inputs . . . 79
A.1.5 State-Level Characteristics . . . 80
C.2.1 Likelihood Function for Heterogeneity and No Heterogeneity Models . . . 86
F.2.1 Statistics for Attrition over the Waves for the Full Sample . . . 91
F.2.2 Select Mother, Child and Household Characteristics . . . 92
F.2.3 Child Outcome Variables . . . 93
F.2.8 Logit: Approximation to the Volunteering Decision . . . 98
F.2.9 Logit: Approximation to the Conference Decision . . . 99
F.2.10 Continuous: Approximation to the Home Input Decisions . . . 100
F.2.11 Logit: Approximation to the Maternal Non-Employment Decision . . . 101
F.2.12 Logit: Approximation to the Decrease Siblings Decision . . . 102
F.2.13 Logit: Approximation to the Increase Siblings Decision . . . 103
F.2.14 Logit: Attrition . . . 104
F.2.15 Continuous: Initial Reading Skills . . . 105
F.2.16 Continuous: Initial Math Skills . . . 105
LIST OF FIGURES
2.1 Timing of Decisions, Information Set and Stochastic Realizations . . . 40
2.2 Parental Reasons for Non-Participation . . . 66
2.3 Distribution of Number of Hours of School-Related Leave Across States . . . 67
2.4 Average Test Scores Before and After the Policy Change . . . 70
2.5 Volunteer, Conference, and Home Inputs Pre and Post Policy Change . . . 72
2.6 Not Employed, Decrease and Increase Siblings Pre and Post Policy Change . . . . 73
A.1.7 Distribution of Number of Hours of School-Related Leave Across States . . . 81
G.2.1 Parents’ Report on School Opportunities to Volunteer . . . 106
CHAPTER 1
THE EFFECT OF STATE SCHOOL-RELATED LEAVE POLICIES ON STUDENT OUTCOMES
1.1 Introduction
Recent federal acts such as the current 2015 Every Student Succeeds Act and the preceding
2001 No Child Left Behind Act emphasize interactions between parents and teachers as a means
to improving student outcomes. Given the national priority of fostering greater contact between
parents and teachers, states themselves have taken the initiative to find innovative ways to get
par-ents involved in their child’s schooling. One such way in which states have sought to facilitate
greater contact between parents and teachers is through the implementation of employment-based
policies that allow parents time off from their place of work to participate in their child’s schooling,
geared at alleviating potentially binding work constraints. At the time of writing, 14 states had the
policy in place and a further 4 states had pending bills to implement the policy. The impacts of
the policy are potentially far-reaching. In 2017, 33.6 million families, or approximately 45% of
all families had children under 18 and of these families, 90.7% had at least one employed parent,
indicating that the vast majority of parents with school-aged children were employed. Despite the
relatively widespread implementation of the policy and the potential wide reaching impacts, as yet,
the effects of the policy have not yet been formally quantified. Using a large nationally
represen-tative survey, this paper evaluates the total effects of these state school-related leave policies on
state characteristics by controlling for a rich set of state-level characteristics directly in the model.
Another concern with estimating the effect of the policy is the potential for states that have policy
to differ systematically in some unobserved way that causes these states to also have children with
higher or lower test scores, leading to inconsistent estimates of the effect of the policy. In lieu of
state fixed effects, I provide statistical evidence that this source of endogeneity is unlikely to be a
concern by evaluating average math and reading test scores in states that do and do not have the
policy in the pre-policy period and using a statistical test of the equality of means to determine that
these states do not have statistically different average test scores.
I find evidence of a positive total effect of the policy on math skills where a 1 hour increase
in the time parents are allowed off of work leads to a 0.005 standard deviation increase in math
skills. Interestingly, I find weak evidence of a negative effect of the policy on non-cognitive skills
where a 1 standard deviation increase in the policy leads to a decrease of 0.002 standard deviations
in non-cognitive skills, though only at the 10% level. I find some evidence of heterogeneity in the
effect of the policy on math skills, most notably lesser effects for Hispanic individuals for math
skills, and negative effects for individuals who do not speak English as the primary language at
home for reading and non-cognitive skills. Despite finding negative effects for individuals who do
not speak English as the primary language at home, I do not find evidence that the negative effects
are coming through the mechanisms explored in this paper. I also find evidence that the policy
matters more for individuals in later grades, and find some evidence to suggest that this is due to
the propensity for mothers to be more likely to be employed in these later grades. Interestingly,
whereas I do not find effects of reading scores in the baseline model, when I analyse differential
effects of the policy by grade, I find a positive effect of the policy on reading scores in grade 2.
I also examine some mechanisms through which the policy could be affecting outcomes based
in-probability of volunteering, attending a parent-teacher conference, and attending a back to school
night. Conversely, I find that the policy has a negative effect on the probability of attending a
PTA/PTO meeting. Given the theoretical evidence that parental involvement can affect the
quan-tity and quality of home inputs (Wherry (2004)), and the potential for maternal employment to be
affected by the policy through making work more attractive, or other indirect channels, I also
ex-amine whether the policy affects home inputs and maternal employment. I find positive effects of
the policy on both maternal employment and home inputs whereby a 1 hour increase in the number
of hours of school-related leave leads to a 0.006 per cent increase in the probability of maternal
employment and a 0.005 standard deviation increase in the level of home inputs. I also explore
heterogeneity in the effects of the policy on the above mechanisms but do not find much evidence
of heterogeneous effects.
My main contribution to the existing literature is providing the first evaluation of the effects of
these existing state school-related leave policies and examining some of the mechanisms through
which these policies can affect outcomes. To the best of my knowledge, I am aware of one other
paper that adopts a somewhat similar approach. Avvisati (2013) exploit a randomized experiment
in French middle schools that randomized parents of sixth graders into meetings at school with
the school head to discuss strategies on how best to support and monitor children with their school
work. The authors found that the intervention increased parent’s participation in both school-based
and home-based activities which translated into improvements in behaviour such as a reduction in
truancy and disciplinary sanctions, but did not find evidence of an improvement in test scores. My
research differs from the previous study along three dimensions: First, unlike the previous
inter-vention which only considered the effects of interactions between parents and the school head, the
on elementary school students. Previous research has shown that parental involvement matters
more earlier on in a child’s life, hence we might expect different effects in elementary and middle
school. Last, I evaluate the effect of an employment-based policy which may have different
mech-anisms than the randomized experiment. For instance, we might expect both interventions to affect
the level of parental involvement and possibly home inputs, but there might be additional effects
of the employment-based policy such as inducing women to work by making work more attractive
that may have additional effects on child skill formation.
The rest of the paper proceeds as follows, Section 1.2 discusses the data to be used in the
estimation and why it is well-suited for this analysis. Section 1.3 gives the empirical specification,
discussing estimation and identification. Section 1.4 gives results and Section 1.5 concludes.
1.2 Data
The dataset used for this analysis is the Early Childhood Longitudinal Study, Kindergarten
Class (ECLS-K), a nationally representative sample of kindergarteners in the United States who
began kindergarten in the fall of 2010. The ECLS-K is a longitudinal survey of children, including
detailed information on their parents, schools and teachers. The survey collects information on
home and school inputs, in addition to cognitive and non-cognitive measures for children, making
the dataset well-suited to this analysis. The restricted use ECLS-K dataset contains information
on the state of residence of the child, allowing the dataset to be merged with state employment
legislation that dictates the number of hours of school-related leave a parent is allowed off. There
are currently four main waves of data: the fall (2010) and spring (2011) of kindergarten, the spring
of grade 1 (2012),1 the spring of grade 2 (2013), and the spring of grade 3 (2014) with the spring
of grades 4 (2015) and 5 (2016) forthcoming. For the purposes of this analysis, I use the spring of
grade 1, the spring of grade 2 and the spring of grade 3 waves.
(PTA) meeting. Summary statistics for the variables are presented in Appendix table A.1.3.
I define home inputs as activities parents partake in with their children outside the realm of the
school.2 The construct of home inputs is the simple average of four variables: the frequency the
child reads books, whether the child participates in extra-curricular activities, whether the number
of hours of TV watched on a weekday is above or below the sample median, and how often the
family eats dinner together.3 The average of the standardized home input index and summary
statistics of the variables used to construct the index are presented in Appendix table A.1.3.
Non-cognitive skills are extracted as a latent factor from the following teacher-reported
mea-sures: Approaches to learning, Self-control, Inter-personal skills, Externalizing and Internalizing
problem behaviours, Inhibitory Control and Attentional Focus. I aggregate these measures into a
single index using polychoric analysis for convenience and to reduce the number of parameters to
be estimated. I outline the procedure used to aggregate the non-cognitive scores in section A.2.1
of the appendix. The factor loadings associated with these variables are shown in Appendix Table
F.2.5. Approaches to Learning and Self-control are the variables that load most highly onto the
non-cognitive factor across all four waves.
Cognitive skills are measured by Item Response Theory (IRT) math and reading scores based
on standardized cognitive tests collected as part of the ECLS-K survey. I discuss the advantages of
using IRT test scores in section A.2.1 of the appendix.
I present the summary statistics for the variables used in this analysis in Appendix tables
A.1.1-A.1.4, and present the states with the number of hours in appendix table A.1.2 and the distribution
2One concern is that parental inputs at home and parental involvement at school may be both proxying for
of the hours of school-related leave in figure A.1.7.
1.3 Empirical Framework
The primary interest of this study is quantifying the total effect of existing state-level
school-related leave policies on cognitive and non-cognitive outcomes. Of additional interest is the effect
of the policy on potential mechanisms. I begin my analysis by specifying production functions for
the cognitive and non-cognitive skills:
Acif t =γ1cPif t+γ2cXif t+γ3cWif t+δtc+ψ c
if t (1.1)
Anif t =γ1nPif t+γ2nXif t+γ3nWif t+δnt +ψ n
if t (1.2)
where iindexes individual,f indexes states, andt indexes year. The variables Ac
if t and Anif t
are the cognitive and non-cognitive outcomes of interest. The variable Pif t represents the hours
of school-related leave per state. The primary parameters of interest are γ1c and γ1n, which give
the direct effect of the policy on cognitive and non-cognitive skills, respectively. The vector
Xif t captures exogenous characteristics and includes household income, the mother’s age and
age squared, family structure, the primary language spoken at home, the child’s gender and race,
and the mother’s education status. The vectorWif t captures state-level characteristics such as the
expenditure per pupil, state GDP per capita, the unemployment rate, the average weekly welfare
benefit, and the average child tax credit. The termδtcaptures time/grade fixed effects andψif t is
an idiosyncratic error term.4
interest (Mif t):
Mif t =α1Pif t+α2Xif t+α3Wif t+δt+ζif t (1.3)
where the primary parameter of interest here isα1.
Standard errors are clustered at the school level in all specifications to account for correlation
in the error term across students in the same school.
1.3.1 Identification
As mentioned before, the primary parameters of interest areγc
1andγ1n, which give the total
ef-fect of the policy on cognitive and non-cognitive skills, respectively. One concern with estimating
these parameters is that the state school-related leave policies could be correlated with other related
state-level characteristics that can affect outcomes. For instance, one possibility is that states with
more generous school-related leave policies are states that spend more on education. If spending
more on education affects student outcomes, then the effect of the policy would be conflated with
the effect of increased educational spending. I argue that controlling for a rich set of state
char-acteristics, including education expenditure per pupil, in the term Wif t addresses this and other
related concerns. A more challenging concern is that policy generosity might be correlated with
unobserved state characteristics that are in turn correlated with child outcomes. For instance, states
with more generous policies could be states that systematically have students that perform better
or worse due to some unobserved state-level characteristics. Since the variation in the policy over
time within the sample is not sufficient to accommodate state fixed effects, in order to give some
probability that the difference is not equal to zero is rejected at conventional significance levels and
the probability that math and reading scores are lower in states that have the policy is not rejected
at the 10% level. The results indicate that if this form of bias is present, that the estimates would
be biased downwards as states that have the policy tended to have individuals with lower math and
reading test scores compared with individuals in states without the policy. Theoretically, the policy
should be tested the policy along the intensive margin, however, data limitations precludes this.
Analogous arguments can be made for recovering consistent estimates of the parameterα1.
Table 1.1: Test of Equivalence of Means for Math and Reading Test Scores for States With and Without the Policy in the Pre-policy Period
No Policy Policy Pr(diff<0) Pr(diff6=0) Pr(diff>0)
Math 219.70 215.08 0.93 0.15 0.05
(7.67) (9.35)
Reading 216.73 211.83 0.92 0.15 0.08
(7.19) (10.30)
1.4 Results
In table 1.2, I present the effects of the policies on the pooled sample of math, reading and
non-cognitive skills. I find that allowing parents an additional hour off of work leads to a 0.005
standard deviation increase in a child’s math skills. By contrast, I do not find direct effects of
the policy on a child’s reading skills and find weak evidence of a negative effect on the policy on
non-cognitive skills of the magnitude of 0.002 standard deviations at the 10% significance level.
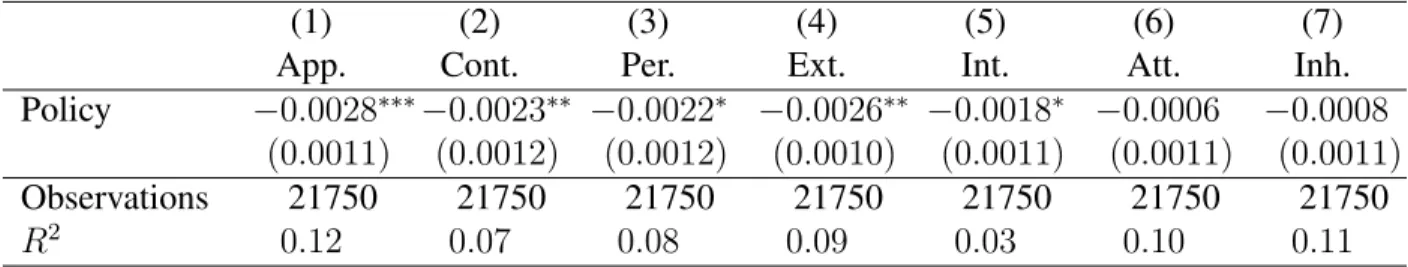
Since the index of non-cognitive skills could be masking differential effects of the policy by
the individual components in the index, in table 1.3, I replace the index of non-cognitive skills with
the individual skills comprising the index (See table F.2.5) and repeat the analysis. Column 1
re-ports approaches to learning, Column 2 rere-ports self-control, Column 3 rere-ports interpersonal skills,
Column 4 reports externalizing behaviour, Column 5 reports internalizing behaviour, Column 6
ap-Table 1.2: Reduced Form Effect of the State School-Related Leave Policy on Math, Reading and Non-Cognitive Scores
(1) (2) (3)
Math Reading Non-Cognitive
Policy 0.0046∗∗∗ (0.0015) −0.0007 (0.0015) −0.0019∗ (0.0011)
Observations 21750 21750 21750
R2 0.48 0.41 0.13
Notes: Observations have been rounded to comply with the requirements of using the restricted-use dataset. Standard errors clustered at the school level are reported in parentheses. The full set of controls have been suppressed for brevity. The full set of controls are child gender, mother’s age, mother’s age squared, mother’s education status, annual household income (000’s), child race, family structure, primary language spoken at home, state-level expenditure per pupil, GDP per capita, the unemployment rate, the average weekly welfare benefit, the maximum number of weeks of welfare benefits, and the average unemployment insurance claims, and year dummies. * refers to statistical significance at the 10% level, ** refers to statistical significance at the 5% level, *** refers to statistical significance at the 1% level.
problems, which are all statistically significant at the 5% level. I find weak evidence of a negative
effect of the policy on interpersonal skills and internalizing behaviours, and no effect of the policy
on attentional focus and inhibitory control. Previous findings in the literature have documented a
potential negative effect of parental involvement on non-cognitive skills through mechanisms such
as reducing children’s excitement about learning and psychological health, and increasing their
stress levels (Kohn (2013)), that could be reflected in the negative effect observed here.
Table 1.3: Reduced Form Effect of the State School-Related Leave Policy on Different Compo-nents of Non-Cognitive Skills
(1) (2) (3) (4) (5) (6) (7)
App. Cont. Per. Ext. Int. Att. Inh.
Policy −0.0028∗∗∗−0.0023∗∗ −0.0022∗ −0.0026∗∗ −0.0018∗ −0.0006 −0.0008 (0.0011) (0.0012) (0.0012) (0.0010) (0.0011) (0.0011) (0.0011)
Observations 21750 21750 21750 21750 21750 21750 21750
R2 0.12 0.07 0.08 0.09 0.03 0.10 0.11
Since it is possible that the policy could have positive effects that diminish as the number of
hours allowed off increases, in table 1.4 I check for potential non-linearities in the effect of the
policy by including the number of hours squared. I do not find any evidence to suggest that there
are non-linear effects of the policy. I also experimented with a cubic specification (not shown)
where I included the number of hours cubed, and did not find any evidence of non-linearities in
that specification.
Table 1.4: Non-linearities in the Effect of the State School-Related Leave Policy on Math, Reading and Non-Cognitive Scores
(1) (2) (3)
Math Reading Non-Cognitive
Policy 0.0052 (0.0054) 0.0018 (0.0042) 0.0018 (0.0032)
Policy squared −0.0000 (0.0001) −0.0001 (0.0001) −0.0001 (0.0001)
Observations 21750 21750 21750
R2 0.48 0.41 0.13
Notes: Observations have been rounded to comply with the requirements of using the restricted-use dataset. Standard errors clustered at the school level are reported in parentheses. The full set of con-trols have been suppressed for brevity. The full set of concon-trols are child gender, mother’s age, mother’s age squared, mother’s education status, annual household income (000’s), child race, family structure, pri-mary language spoken at home, state-level expenditure per pupil, GDP per capita, the unemployment rate, the average weekly welfare benefit, the maximum number of weeks of welfare benefits, and the average unemployment insurance claims, and year dummies. * refers to statistical significance at the 10% level, ** refers to statistical significance at the 5% level, *** refers to statistical significance at the 1% level.
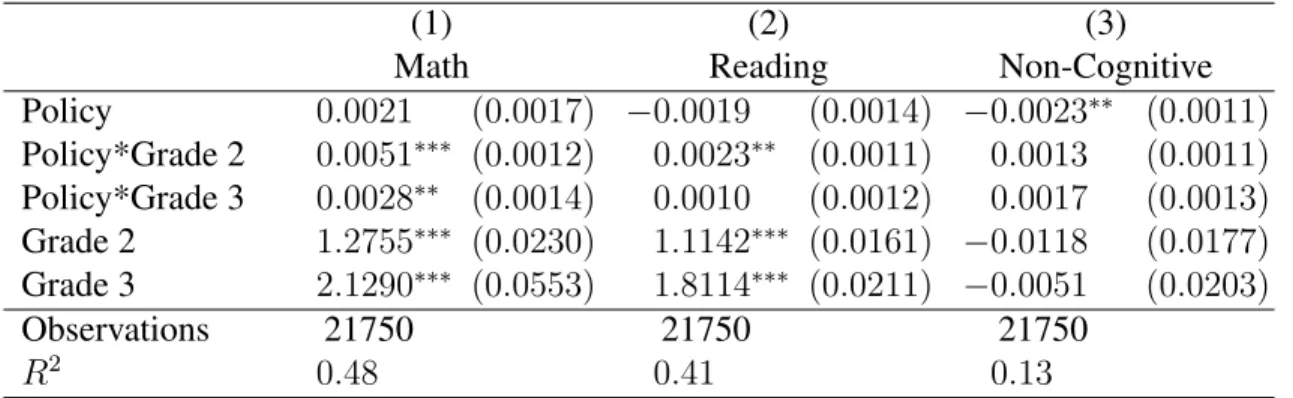
Pooling the sample could be masking important heterogeneity by grade (time). Such
hetero-geneity may be of interest to policy makers as it may reveal information about the effectiveness
and/or uptake of the policy in different grades. In table 1.6, I check whether the policy has
dif-ferential effects depending on the grade of the child by interacting the policy with grade fixed
effects. I find that the policy has positive effects on math skills in grade 2 and grade 3, relative
to grade 1. Interestingly, whereas I do not find an effect on reading skills in the baseline model,
I find that the policy has positive effects on reading skills in grade 2, relative to grade 1. I do
maternal employment in table 1.6 including grade (time) fixed effects. As can be seen from the
table, the mother is more likely to be employed, and thus potentially more time constrained, in
grades 2 and 3, compared with grade 1, providing some support for this hypothesis.
Table 1.5: Heterogeneous Effects of the Policy on Outcomes by Grade (Time)
(1) (2) (3)
Math Reading Non-Cognitive
Policy 0.0021 (0.0017) −0.0019 (0.0014) −0.0023∗∗ (0.0011)
Policy*Grade 2 0.0051∗∗∗ (0.0012) 0.0023∗∗ (0.0011) 0.0013 (0.0011)
Policy*Grade 3 0.0028∗∗ (0.0014) 0.0010 (0.0012) 0.0017 (0.0013)
Grade 2 1.2755∗∗∗ (0.0230) 1.1142∗∗∗ (0.0161) −0.0118 (0.0177)
Grade 3 2.1290∗∗∗ (0.0553) 1.8114∗∗∗ (0.0211) −0.0051 (0.0203)
Observations 21750 21750 21750
R2 0.48 0.41 0.13
Notes: Observations have been rounded to comply with the requirements of using the restricted-use dataset. Standard errors clustered at the school level are reported in parentheses. The full set of controls have been suppressed for brevity. The full set of controls are child gender, mother’s age, mother’s age squared, mother’s education status, annual household income (000’s), child race, family structure, primary language spoken at home, state-level expenditure per pupil, GDP per capita, the unemployment rate, the average weekly welfare benefit, the maximum number of weeks of welfare benefits, and the average unemployment insurance claims, and year dummies. * refers to statistical significance at the 10% level, ** refers to statistical significance at the 5% level, *** refers to statistical significance at the 1% level.
1.4.1 Heterogeneous Policy Effects
Prior to considering possible heterogeneous effects of the policy by different groups of
indi-viduals, it is first interesting to see which types of individuals could potentially disproportionately
benefit from the policy based on their propensity for employment. In table 1.6, I regress maternal
employment on a vector of exogenous characteristics to identify the most salient characteristics
for employment. Older mothers, more educated mothers, wealthier mothers, and black mothers
(compared with white mothers) are more likely to be employed. By contrast, mothers who do not
Table 1.6: Logit Equation of the Determinants of Maternal Employment
(1)
Maternal Employment
Female −0.0242 (0.0439)
Mother’s Age 0.8748∗∗∗ (0.1901)
Mother’s Age Sq. −0.1145∗∗∗ (0.0259)
Some College 0.4351∗∗∗ (0.0551)
Bachelors or Higher 0.7685∗∗∗ (0.0642)
Household Income 0.2148∗∗∗ (0.0612)
Black 0.1855∗∗ (0.0877)
Hispanic −0.1489∗∗ (0.0718)
Other 0.0510 (0.0811)
Single Parent −0.5917∗∗∗ (0.0631)
Non-English Home Language −0.3584∗∗∗ (0.0695)
Grade 2 0.1540∗∗∗ (0.0248)
Grade 3 0.2665∗∗∗ (0.0323)
Constant −1.3988∗∗∗ (0.3552)
Observations 21750
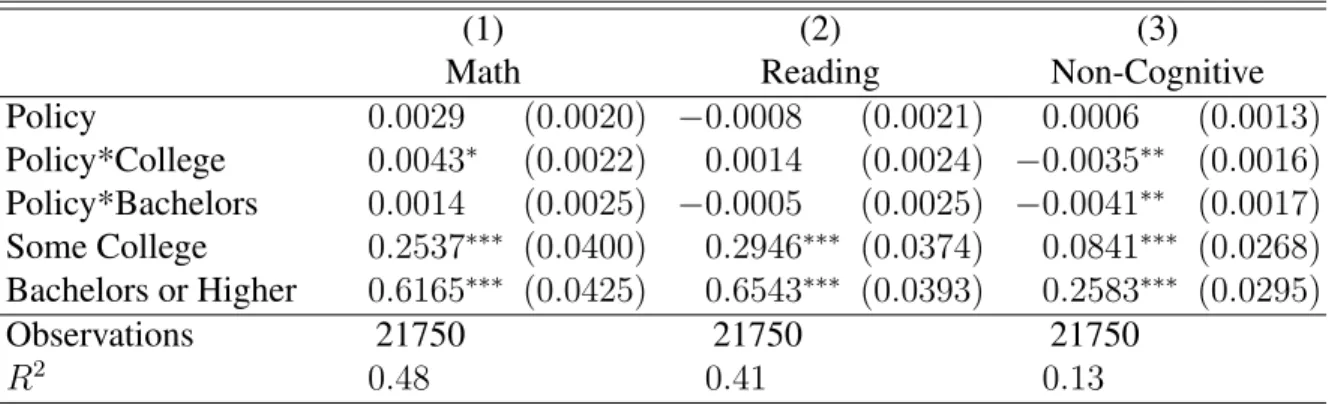
some college or a bachelors or higher education relative to high school or less than high school,
potentially due to the reasons discussed previously. By contrast, with the exception of a weakly
positive effect of the policy for mothers with some college education relative to high school or less
than high school, I do not find evidence of policy heterogeneity for math and reading test scores.
Table 1.7: Heterogeneous Effects of the Policy on Outcomes by Education Status
(1) (2) (3)
Math Reading Non-Cognitive
Policy 0.0029 (0.0020) −0.0008 (0.0021) 0.0006 (0.0013)
Policy*College 0.0043∗ (0.0022) 0.0014 (0.0024) −0.0035∗∗ (0.0016)
Policy*Bachelors 0.0014 (0.0025) −0.0005 (0.0025) −0.0041∗∗ (0.0017)
Some College 0.2537∗∗∗ (0.0400) 0.2946∗∗∗ (0.0374) 0.0841∗∗∗ (0.0268)
Bachelors or Higher 0.6165∗∗∗ (0.0425) 0.6543∗∗∗ (0.0393) 0.2583∗∗∗ (0.0295)
Observations 21750 21750 21750
R2 0.48 0.41 0.13
Notes: Observations have been rounded to comply with the requirements of using the restricted-use dataset. Standard errors clustered at the school level are reported in parentheses. The full set of controls have been suppressed for brevity. The full set of controls are child gender, mother’s age, mother’s age squared, mother’s education status, annual household income (000’s), child race, family structure, primary language spoken at home, state-level expenditure per pupil, GDP per capita, the unemployment rate, the average weekly welfare benefit, the maximum number of weeks of welfare benefits, and the average unemployment insurance claims, and year dummies. * refers to statistical significance at the 10% level, ** refers to statistical significance at the 5% level, *** refers to statistical significance at the 1% level.
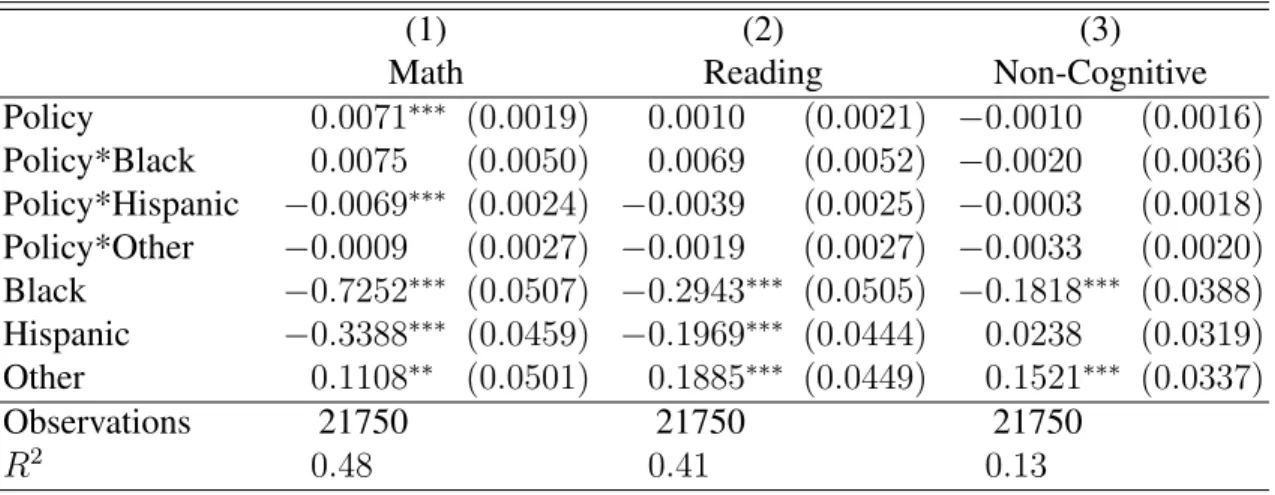
In table 1.8, I show that the effect of the policy is less effective for math skills for Hispanic
children but do not find differential effects by race for black children or children from other races.
A lesser effect of the policy by race could be explained by racial differences in the propensity to
be employed, barriers to involvement, perhaps linguistic, (Aronson (1996)) given the high degree
of correlation between Hispanic children and a not speaking English as the primary language at
home of about 0.51, preferences for child skill, and/or returns to child skill. Another potential
Table 1.8: Heterogeneous Effects of the Policy on Outcomes by Race
(1) (2) (3)
Math Reading Non-Cognitive
Policy 0.0071∗∗∗ (0.0019) 0.0010 (0.0021) −0.0010 (0.0016)
Policy*Black 0.0075 (0.0050) 0.0069 (0.0052) −0.0020 (0.0036)
Policy*Hispanic −0.0069∗∗∗ (0.0024) −0.0039 (0.0025) −0.0003 (0.0018)
Policy*Other −0.0009 (0.0027) −0.0019 (0.0027) −0.0033 (0.0020)
Black −0.7252∗∗∗ (0.0507) −0.2943∗∗∗ (0.0505) −0.1818∗∗∗ (0.0388)
Hispanic −0.3388∗∗∗ (0.0459) −0.1969∗∗∗ (0.0444) 0.0238 (0.0319)
Other 0.1108∗∗ (0.0501) 0.1885∗∗∗ (0.0449) 0.1521∗∗∗ (0.0337)
Observations 21750 21750 21750
R2 0.48 0.41 0.13
Notes: Observations have been rounded to comply with the requirements of using the restricted-use dataset. Standard errors clustered at the school level are reported in parentheses. The full set of controls have been suppressed for brevity. The full set of controls are child gender, mother’s age, mother’s age squared, mother’s education status, annual household income (000’s), child race, family structure, primary language spoken at home and year dummies. * refers to statistical significance at the 10% level, ** refers to statistical significance at the 5% level, *** refers to statistical significance at the 1% level.
Table 1.9: Heterogeneous Effects of the Policy on Outcomes by Primary Language Spoken at Home
(1) (2) (3)
Math Reading Non-Cognitive
Policy 0.0066∗∗∗ (0.0016) 0.0010 (0.0016) −0.0008 (0.0013)
Policy*Non-English −0.0059∗∗∗ (0.0021) −0.0049∗∗ (0.0020) −0.0033∗∗ (0.0015)
Non-English Home Language 0.0175 (0.0477) −0.1543∗∗∗ (0.0474) 0.1917∗∗∗ (0.0341)
Observations 21750 21750 21750
R2 0.48 0.41 0.13
Interestingly, despite the propensity for wealthier households to be more likely to be employed,
when analyzing the results in table 1.10, I do not find heterogeneous effects of the policy by
household income. In table 1.11, I also do not find evidence of heterogeneity in the policy by
family structure, despite single parents having a lower probability of being employed.
Table 1.10: Heterogeneous Effects of the Policy on Outcomes by Household Income
(1) (2) (3)
Math Reading Non-Cognitive
Policy 0.0046∗∗∗ (0.0015) −0.0007 (0.0015) −0.0019∗ (0.0011)
Policy*Income 0.0014 (0.0016) 0.0012 (0.0014) −0.0009 (0.0013)
Household Income 0.3233∗∗∗ (0.0314) 0.2671∗∗∗ (0.0298) 0.1497∗∗∗ (0.0227)
Observations 21750 21750 21750
R2 0.48 0.41 0.13
Notes: Observations have been rounded to comply with the requirements of using the restricted-use dataset. Standard errors clustered at the school level are reported in parentheses. The full set of controls have been suppressed for brevity. The full set of controls are child gender, mother’s age, mother’s age squared, mother’s education status, annual household income (000’s), child race, family structure, primary language spoken at home, state-level expenditure per pupil, GDP per capita, the unemployment rate, the average weekly welfare benefit, the maximum number of weeks of welfare benefits, and the average unemployment insurance claims, and year dummies. * refers to statistical significance at the 10% level, ** refers to statistical significance at the 5% level, *** refers to statistical significance at the 1% level.
Table 1.11: Heterogeneous Effects of the Policy on Outcomes by Family Structure
(1) (2) (3)
Math Reading Non-Cognitive
Policy 0.0033 (0.0026) −0.0004 (0.0027) −0.0024 (0.0017)
Policy*Single Parent 0.0015 (0.0025) −0.0003 (0.0024) 0.0006 (0.0016)
Single Parent 0.0942∗∗ (0.0401) 0.1433∗∗∗ (0.0392) 0.2577∗∗∗ (0.0289)
Observations 21750 21750 21750
R2 0.48 0.41 0.13
1.4.2 Mechanisms
The baseline results show a positive effect of the policy on math scores. In this section, I
eval-uate potential mechanisms through which these policies can affect math scores according to the
empirical specification in equation 1.3. Since the policy is specifically targeted at parental
partici-pation in school-based activities, I evaluate the effect of the policies on different types of parental
involvement, namely, the probability of volunteering, the probability of attending a parent-teacher
conference, the probability of attending a back to school night, the probability of attending a school
event, and the probability of attending a parent-teacher organization or association meeting. I also
consider other potential mechanisms such as the effect on home inputs and maternal employment to
assess the potential for spillovers to the home environment and to assess whether the policy could
induce mothers to work or affect maternal employment decisions through other indirect channels.
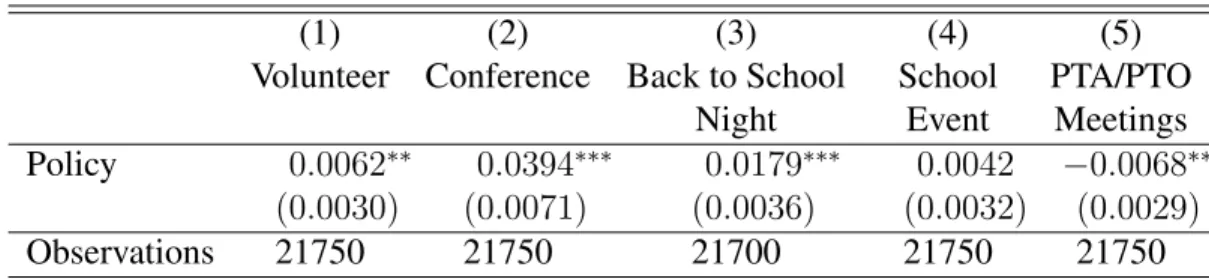
Table 1.12 reports the effect of the policy on various measures of parental involvement where
Column (1) reports the probability of volunteering, Column (2) reports the probability of attending
a parent-teacher conference, Column (3) reports the probability of attending a back to school night,
Column (4) reports the probability of attending a school event, and Column (5) reports the
proba-bility of attending a parent-teacher association or parent-teacher organization meeting. I find that
the school-related leave policy has positive effects on the probability of volunteering, attending a
parent-teacher conference and attending a back to school night, with the effect sizes statistically
largest for attending a parent-teacher conference. I do not find an effect on attending a school
event, but find a negative effect of attending a PTA or PTO meeting. The differences in the effect
of the policy across different types of parental involvement activities may speak to the propensity
for them to occur during traditional work hours, though the negative effect on attending a PTA or
PTO meeting is counter intuitive, and could possibly be coming through indirect mechanisms.
Table 1.12: Potential Parental Involvement Mechanisms
(1) (2) (3) (4) (5)
Volunteer Conference Back to School School PTA/PTO
Night Event Meetings
Policy 0.0062∗∗ 0.0394∗∗∗ 0.0179∗∗∗ 0.0042 −0.0068∗∗ (0.0030) (0.0071) (0.0036) (0.0032) (0.0029)
Observations 21750 21750 21700 21750 21750
Notes: Column (1) reports the probability of volunteering, Column (2) reports the probability of at-tending a parent-teacher conference, Column (3) reports the probability of atat-tending a back to school night. Column (4) reports the probability of attending a school event, Column (5) reports the prob-ability of attending a parent-teacher association or parent-teacher organization meeting and Column (6) reports the number of meetings at the school the parent attended. Observations have been rounded to comply with the requirements of using the restricted-use dataset. Standard errors clustered at the school level are reported in parentheses. The full set of controls have been suppressed for brevity. The full set of controls are child gender, mother’s age, mother’s age squared, mother’s education status, annual household income (000’s), child race, family structure, primary language spoken at home, state-level expenditure per pupil, GDP per capita, the unemployment rate, the average weekly welfare benefit, the maximum number of weeks of welfare benefits, and the average unemployment insurance claims, and year dummies. * refers to statistical significance at the 10% level, ** refers to statistical significance at the 5% level, *** refers to statistical significance at the 1% level.
in Avvisati (2013). I find evidence to suggest that the school-related leave policy matters for both
employment and home inputs with a 1 hour increase in the hours of school related leave allowed
off leading to a 0.006 per cent increase in the probability of employment and a 0.005 standard
Table 1.13: Potential Alternate Mechanisms
(1) (2)
Employment Home Inputs
Policy 0.0063∗∗ 0.0050∗∗∗
(0.0027) (0.0010)
Observations 21750 21750
R2 0.06
Notes: Observations have been rounded to comply with the requirements of using the restricted-use dataset. Standard errors clustered at the school level are re-ported in parentheses. The full set of controls have been suppressed for brevity. The full set of controls are child gender, mother’s age, mother’s age squared, mother’s education status, annual household income (000’s), child race, family structure, primary language spoken at home, state-level expenditure per pupil, GDP per capita, the unemployment rate, the average weekly welfare benefit, the maximum number of weeks of wel-fare benefits, and the average unemployment insurance claims, and year dummies. * refers to statistical icance at the 10% level, ** refers to statistical signif-icance at the 5% level, *** refers to statistical signifi-cance at the 1% level.
Heterogeneous Mechanisms
In this section, I explore whether heterogeneity in the effects of the policy on potential
mech-anisms can explain the lesser effects of the policy on outcomes for Hispanic individuals and the
negative effects on individuals who do not speak English as the primary language at home. I
present the results in tables 1.14 to 1.17 below.
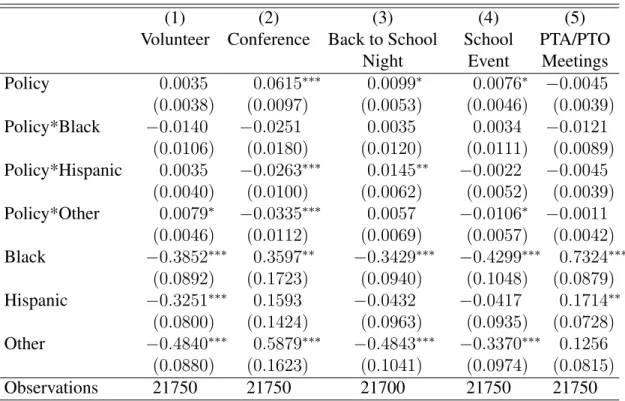
I first examine heterogeneity in the effect of the policy by race on the various types of parental
involvement in table 1.14. I find that the policy has a lesser effect of attending a parent-teacher
conference for Hispanic students. Seemingly counter to the lesser effect of the policy on outcomes,
I also find that the policy has larger effects for Hispanic students on the probability of attending
a back to school night. Without further information on the signs and magnitudes of the effect of
Table 1.14: Heterogeneous Effects of the Policy on Mechanisms by Race
(1) (2) (3) (4) (5)
Volunteer Conference Back to School School PTA/PTO
Night Event Meetings
Policy 0.0035 0.0615∗∗∗ 0.0099∗ 0.0076∗ −0.0045
(0.0038) (0.0097) (0.0053) (0.0046) (0.0039)
Policy*Black −0.0140 −0.0251 0.0035 0.0034 −0.0121
(0.0106) (0.0180) (0.0120) (0.0111) (0.0089)
Policy*Hispanic 0.0035 −0.0263∗∗∗ 0.0145∗∗ −0.0022 −0.0045 (0.0040) (0.0100) (0.0062) (0.0052) (0.0039)
Policy*Other 0.0079∗ −0.0335∗∗∗ 0.0057 −0.0106∗ −0.0011 (0.0046) (0.0112) (0.0069) (0.0057) (0.0042)
Black −0.3852∗∗∗ 0.3597∗∗ −0.3429∗∗∗ −0.4299∗∗∗ 0.7324∗∗∗ (0.0892) (0.1723) (0.0940) (0.1048) (0.0879)
Hispanic −0.3251∗∗∗ 0.1593 −0.0432 −0.0417 0.1714∗∗
(0.0800) (0.1424) (0.0963) (0.0935) (0.0728)
Other −0.4840∗∗∗ 0.5879∗∗∗ −0.4843∗∗∗ −0.3370∗∗∗ 0.1256 (0.0880) (0.1623) (0.1041) (0.0974) (0.0815)
Observations 21750 21750 21700 21750 21750
Table 1.15: Heterogeneous Effects of the Policy on Alternate Mechanisms by Race
(1) (2)
Employment Home Inputs
Policy 0.0111∗∗∗ 0.0050∗∗∗
(0.0043) (0.0012)
Policy*Black 0.0061 0.0001
(0.0115) (0.0041)
Policy*Hispanic −0.0112∗∗ −0.0002 (0.0050) (0.0015)
Policy*Other −0.0014 0.0002
(0.0052) (0.0018)
Black 0.2094∗∗ −0.2716∗∗∗
(0.0958) (0.0368)
Hispanic 0.0525 −0.1464∗∗∗
(0.0858) (0.0314)
Other 0.0706 0.0239
(0.0969) (0.0335)
Observations 21750 21750
R2 0.07
Table 1.16: Heterogeneous Effects of the Policy on Mechanisms by Primary Language Spoken at Home
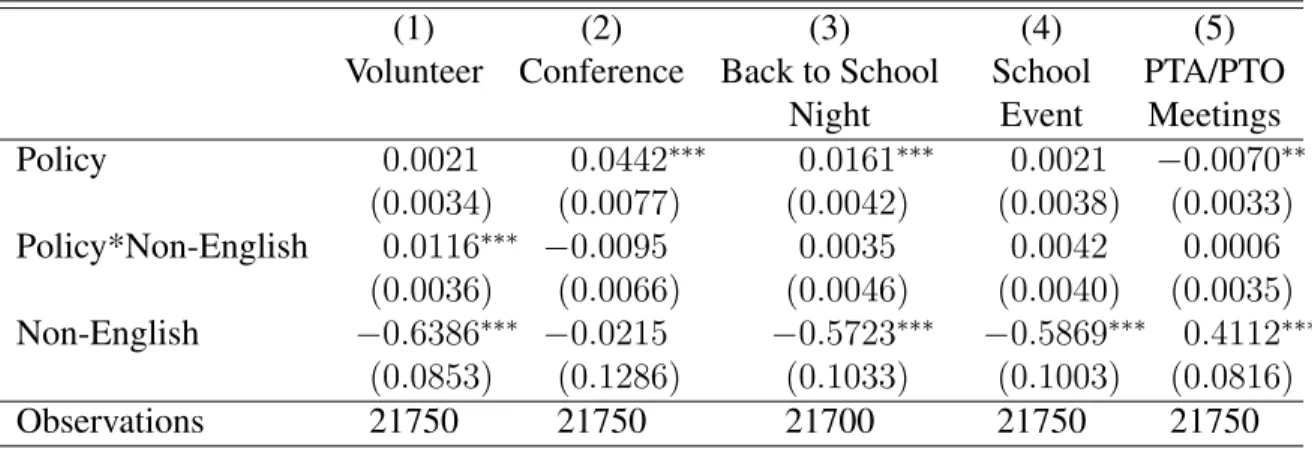
(1) (2) (3) (4) (5)
Volunteer Conference Back to School School PTA/PTO
Night Event Meetings
Policy 0.0021 0.0442∗∗∗ 0.0161∗∗∗ 0.0021 −0.0070∗∗
(0.0034) (0.0077) (0.0042) (0.0038) (0.0033)
Policy*Non-English 0.0116∗∗∗ −0.0095 0.0035 0.0042 0.0006 (0.0036) (0.0066) (0.0046) (0.0040) (0.0035)
Non-English −0.6386∗∗∗ −0.0215 −0.5723∗∗∗ −0.5869∗∗∗ 0.4112∗∗∗ (0.0853) (0.1286) (0.1033) (0.1003) (0.0816)
Observations 21750 21750 21700 21750 21750
Notes: Observations have been rounded to comply with the requirements of using the restricted-use dataset. Standard errors clustered at the school level are reported in parentheses. The full set of controls have been suppressed for brevity. The full set of controls are child gender, mother’s age, mother’s age squared, mother’s education status, annual household income (000’s), child race, family structure, primary language spoken at home, state-level expenditure per pupil, GDP per capita, the unemployment rate, the average weekly welfare benefit, the maximum number of weeks of welfare benefits, and the average unemployment insurance claims, and year dummies. * refers to statistical significance at the 10% level, ** refers to statistical significance at the 5% level, *** refers to statistical significance at the 1% level.
Counter to the negative effects of the policy for individuals who do not speak English as the
primary language at home, I find that the policy has a positive effect on volunteering at school
relative to individuals who do not speak English as the primary language spoken at home in table
1.16. I do not find any heterogeneous effects of the policy on the alternate mechanisms considered
Table 1.17: Heterogeneous Effects of the Policy on Potential Alternate Mechanisms by Home Language
(1) (2)
Employment Home Inputs
Policy 0.0074∗∗ 0.0044∗∗∗
(0.0033) (0.0010)
Policy*Non-English −0.0030 0.0016
(0.0040) (0.0014)
Non-English Home Language −0.3094∗∗∗ −0.0555 (0.0839) (0.0358)
Observations 21750 21750
R2 0.07
Notes: Observations have been rounded to comply with the requirements of using the restricted-use dataset. Standard errors clustered at the school level are reported in parentheses. The full set of controls have been suppressed for brevity. The full set of controls are child gender, mother’s age, mother’s age squared, mother’s education status, annual household income (000’s), child race, family structure, primary language spoken at home, state-level expenditure per pupil, GDP per capita, the unemployment rate, the average weekly welfare benefit, the maximum number of weeks of welfare benefits, and the average unemployment insurance claims, and year dummies. * refers to statistical significance at the 10% level, ** refers to statistical significance at the 5% level, *** refers to statistical significance at the 1% level.
I briefly discuss some of the heterogeneous effects of the policy on mechanisms along the
previous dimensions considered. For the sake of brevity, I only present the results where I find
evidence of heterogeneity in the effects of the policy on the mechanisms of interest.
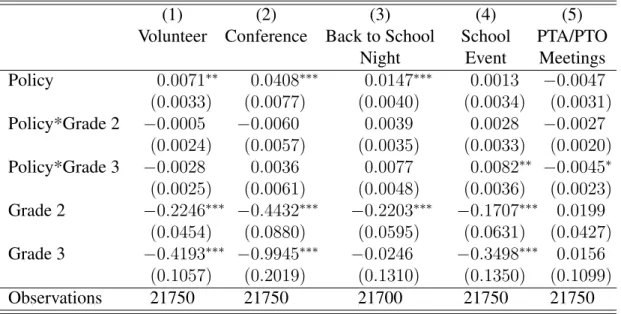
I find limited evidence that the policy has heterogeneous effects on the various types of parental
involvement by grade in table 1.18. Interestingly, whereas I do not find evidence of the policy in
the baseline model, I find that the policy has positive effects on the probability of attending a school
event in grade 3.
I also find limited evidence to suggest heterogeneity in the effect of the policy on mechanisms
by maternal education status, with the exception of a less negative effect of the policy on attending
Table 1.18: Heterogeneous Effects of the Policy on Mechanisms by Grade
(1) (2) (3) (4) (5)
Volunteer Conference Back to School School PTA/PTO
Night Event Meetings
Policy 0.0071∗∗ 0.0408∗∗∗ 0.0147∗∗∗ 0.0013 −0.0047
(0.0033) (0.0077) (0.0040) (0.0034) (0.0031)
Policy*Grade 2 −0.0005 −0.0060 0.0039 0.0028 −0.0027
(0.0024) (0.0057) (0.0035) (0.0033) (0.0020)
Policy*Grade 3 −0.0028 0.0036 0.0077 0.0082∗∗ −0.0045∗ (0.0025) (0.0061) (0.0048) (0.0036) (0.0023)
Grade 2 −0.2246∗∗∗ −0.4432∗∗∗ −0.2203∗∗∗ −0.1707∗∗∗ 0.0199 (0.0454) (0.0880) (0.0595) (0.0631) (0.0427)
Grade 3 −0.4193∗∗∗ −0.9945∗∗∗ −0.0246 −0.3498∗∗∗ 0.0156 (0.1057) (0.2019) (0.1310) (0.1350) (0.1099)
Observations 21750 21750 21700 21750 21750
Table 1.19: Heterogeneous Effects of the Policy on Mechanisms by Education Status
(1) (2) (3) (4) (5)
Volunteer Conference Back to School School PTA/PTO
Night Event Meetings
Policy 0.0061∗ 0.0345∗∗∗ 0.0199∗∗∗ 0.0059∗ −0.0107∗∗∗
(0.0034) (0.0078) (0.0041) (0.0034) (0.0032)
Policy*College 0.0041 0.0105 −0.0070 −0.0010 0.0074∗∗
(0.0037) (0.0066) (0.0048) (0.0045) (0.0034)
Policy*Bachelors −0.0032 0.0130 −0.0012 −0.0068 0.0051
(0.0042) (0.0083) (0.0055) (0.0049) (0.0036)
Some College 0.3202∗∗∗ 0.2156∗∗ 0.4851∗∗∗ 0.4916∗∗∗−0.0216 (0.0593) (0.0887) (0.0732) (0.0661) (0.0543)
Bachelors or Higher 0.7753∗∗∗ 0.6636∗∗∗ 0.7648∗∗∗ 0.9463∗∗∗ 0.1344∗∗ (0.0688) (0.1290) (0.0866) (0.0922) (0.0604)
Observations 21750 21750 21700 21750 21750
Notes: Observations have been rounded to comply with the requirements of using the restricted-use dataset. Standard errors clustered at the school level are reported in parentheses. The full set of controls have been suppressed for brevity. The full set of controls are child gender, mother’s age, mother’s age squared, mother’s education status, annual household income (000’s), child race, family structure, primary language spoken at home, state-level expenditure per pupil, GDP per capita, the unemployment rate, the average weekly welfare benefit, the maximum number of weeks of welfare benefits, and the average unemployment insurance claims, and year dummies. * refers to statistical significance at the 10% level, ** refers to statistical significance at the 5% level, *** refers to statistical significance at the 1% level.
I find limited evidence to suggest that there is heterogeneity in the effect of the policy by
household income on various forms of parental involvement in table 1.20. Specifically, I find that
the policy has negative effects on the probability of attending a school event for individuals in
higher income brackets.
Overall, despite finding evidence of heterogeneity in the effects of the policies on outcomes,
particularly for Hispanic individuals and individuals who do not speak English as the primary
language at home, I find limited evidence of heterogeneity in the effect of the policy on the various
potential mechanisms captured in the dataset. It is possible that the negative effects of the policy
could be operating through mechanisms not captured in the dataset, that disproportionately affect
Table 1.20: Heterogeneous Effects of the Policy on Mechanisms by Household Income
(1) (2) (3) (4) (5)
Volunteer Conference Back to School School PTA/PTO
Night Event Meetings
Policy 0.0058∗ 0.0410∗∗∗ 0.0164∗∗∗ 0.0020 −0.0068∗∗
(0.0030) (0.0073) (0.0036) (0.0033) (0.0029)
Policy*Income −0.0054∗ 0.0071 −0.0065 −0.0095∗∗ 0.0012 (0.0032) (0.0070) (0.0040) (0.0039) (0.0027)
Household Income 0.7058∗∗∗ 0.2642∗∗ 0.4751∗∗∗ 0.7075∗∗∗ 0.1783∗∗∗ (0.0564) (0.1076) (0.0770) (0.0808) (0.0516)
Observations 21750 21750 21700 21750 21750
Notes: Observations have been rounded to comply with the requirements of using the restricted-use dataset. Standard errors clustered at the school level are reported in parentheses. The full set of controls have been suppressed for brevity. The full set of controls are child gender, mother’s age, mother’s age squared, mother’s education status, annual household income (000’s), child race, family structure, primary language spoken at home, state-level expenditure per pupil, GDP per capita, the unemployment rate, the average weekly welfare benefit, the maximum number of weeks of welfare benefits, and the average unemployment insurance claims, and year dummies. * refers to statistical significance at the 10% level, ** refers to statistical significance at the 5% level, *** refers to statistical significance at the 1% level.
1.5 Conclusion
Facilitating increased contact between parents and teachers in an effort to improve outcomes
has been the cornerstone of United States education policy for the past two decades. Given the
centrality of parental involvement to national education policy, policy makers have expended a
considerable degree of effort to design and implement policies aimed at addressing the most salient
barriers to parental involvement, chief of which is an inability to get the time off of work. In
response to this, 14 states have implemented a policy and a further 4 states currently have pending
bills that would allow parents time off from their place of work to participate in their child’s
schooling. Despite the popularity of the policy, to the best of my knowledge, there is no empirical
of parental involvement such as volunteering, attending a parent teacher conference, and
attend-ing a back to school night. I additionally find positive effects on other inputs such as maternal
employment and home inputs.
In the context of the current policy climate with fourteen states currently having the policy in
place and a further four states proposing bills to introduce this policy, my research can serve as a
source of information to policy makers as well as a foundation from which further analysis of the
CHAPTER 2
THE EFFECT OF PARENTAL INVOLVEMENT ON STUDENT OUTCOMES
2.1 Introduction
Increasing the level of parental involvement in schools as a means to improving outcomes and
reducing achievement gaps has been central to United States education policy over the past two
decades. Recent federal education acts such as the current 2015 Every Student Succeeds Act and
the preceding 2001 No Child Left Behind Act have cemented parental involvement as a national
education priority by tying the receipt of federal funds to implementing parent involvement
activ-ities. Under the current act, districts in receipt of Title 1 funds are required to implement parental
involvement programs, activities and procedures, and those in receipt of in excess of $500,000 are
required to earmark 1% of these funds for parental involvement activities. In the year 2017, this
amounted to the federal government spending an estimated $133,000,000 on parental involvement
activities.1 Using a large nationally representative survey, this paper recovers the causal effect
of parental involvement on child outcomes by addressing the non-random nature of parental
in-volvement and accounting for the inter-dependence between parental inin-volvement and other input
decisions relevant to child skill production. This paper also studies the effects of existing
state-level policies that allow parents time off from their place of work to participate in their child’s
schooling.
estimate of the effect of parental involvement on child outcomes. For instance, parents of
inher-ently higher (unobserved) ability children may both have a higher level of parental involvement
and have higher skilled children leading to an upward bias in the effect of parental involvement.
Conversely, parents may compensate for having an inherently low (unobserved) ability child by
having a high level of parental involvement leading to a downward bias in the effect of parental
involvement. Similarly, failure to account for the effect of other related inputs may lead to an
over or understating of the effect of parental involvement. For instance, an increase in parental
involvement may lead to a reduction in other competing productive uses of the parents’ time such
as employment or home input decisions with ambiguous effects on child skill development. By
modeling parental involvement, maternal employment, fertility and home inputs as a set of
inter-related parental input decisions and using econometric techniques to correct for the non-random
nature of parental involvement and other related inputs, this paper is able to recover the causal
effect of parental involvement.
Policies designed to increase parental involvement can affect other inputs directly, as well as
indirectly through the effect of changing parental involvement on other inputs with ambiguous total
effects on child skill. For instance, the existing state-level policies that allow parents time off from
work to participate in their child’s schooling may lead to an increase in parental involvement, but
it may also directly lead to increases in maternal employment. Additionally, increasing the level of
parental involvement may lead to reductions in home inputs and employment due to parental time
constraints. Quantifying the total effect of these policies requires accounting for both these direct
and indirect channels. By specifying and estimating a sufficiently rich model that (1) captures the
inter-dependence of inputs, (2) models the dependence of these inputs on policies, and (3) recovers
causal effects of these inputs on child skill, this paper is able to evaluate the total effects of policies
non-cognitive skills in addition to their child’s human capital. I present the model from the
stand-point of a forward-looking utility maximizing household with the mother as the decision-making
agent making choices over parental involvement, home inputs, fertility and employment decisions
as inputs into child skill formation each period. I include home inputs, fertility and employment
decisions as these have the potential to both affect and be affected by parental involvement
de-cisions and have been shown to be relevant for child skill formation (Del Boca (2014); Bernal
(2008)). By treating parental inputs as sequential per period decisions made simultaneously within
each period, I am able to capture both the contemporaneous trade-offs parents face in terms of
competing productive uses of their time as well as the dynamic effects of parental input decisions.
From the theoretical model, I derive approximations to the parental involvement and other related
input decisions as a linear function of all information available to the mother at the time of her
making her input decisions.
In my empirical specification, I control for several sources of unobserved heterogeneity that can
potentially bias results including mother/child permanent unobserved heterogeneity, such as
unob-served child ability, mother/child time-varying unobunob-served heterogeneity, such as health shocks
to the child or mother, and show relative robustness to the inclusion of school-level permanent
unobserved heterogeneity. I account for these forms of heterogeneity by using a random effects
specification that categorizes mother/child permanent unobserved heterogeneity and mother/child
time-varying unobserved heterogeneity into a discrete number of family types and shocks,
respec-tively. I include these terms directly in the input decisions and skill equations and allow for
cor-relation in the error terms across equations and time. The direct inclusion of these terms resolves
the omitted variable bias problem stemming from the omission of these unobserved inputs that
plausibly exogenous variation in an employment-based law that allows parents time off from their
place of work to participate in their child’s schooling, in addition to labor market characteristics,
and state welfare, child-care, and taxation policies.
I find evidence of a positive and statistically significant effect of parental involvement, as
mea-sured by volunteering at school, on math, reading, and non-cognitive skills of 0.04, 0.04, and 0.05
standard deviations, respectively. To get an idea of these magnitudes, the effect sizes are
com-parable to 19%, 17%, and 64%, respectively, of the direct effect of a mother having a bachelor’s
degree or higher. The effect sizes are of the same sign but larger in magnitude when compared with
the baseline OLS model. By contrast, when analyzing parent-teacher conferences as the measure
of parental involvement, I find stark differences in math and reading skills between the baseline
OLS results and the results from the model that corrects for the endogeneity of parental
involve-ment and other input decisions. I find a negative and statistically significant effect of attending a
parent-teacher conference on reading skills in the baseline OLS model of 0.05 standard deviations,
however this effect becomes insignificant when the endogeneity of the parent-teacher conference
decision is accounted for. Similarly, I find an insignificant effect of attending parent-teacher
con-ferences on math skills in the baseline OLS model compared with a positive and statistically
sig-nificant effect of 0.04 standard deviations in the model correcting for selection, though only at
the 10% level. The results are consistent with a negative selection mechanism whereby parents of
lower ability children are more likely to attend parent-teacher conferences, leading to a downward
bias in OLS estimates. Conversely, I find negative effects of attending a parent-teacher conference
on non-cognitive skills for both specifications of 0.07 standard deviations in the baseline OLS
model and 0.06 standard deviations in the model that corrects for the endogeneity of the
parent-teacher conference decision. I additionally find evidence of a dynamic positive effect of lagged
I focus on existing state-level policies that allow parents time off from their place of work to
participate in their child’s schooling, providing the first evaluation of this policy. Quantifying the
effects of the policy is a timely and relevant exercise given that 14 states currently have the policy
implemented and a further four currently have pending bills.2 I find that allowing parents 40 hours
off of work in leads to increases in non-cognitive skills over the life cycle of the child primarily
through increasing the level of volunteering.
I make several important contributions to several strands of the literature. First, I contribute
to the literature on the effects of parental involvement by dealing with endogeneity due to
selec-tion on unobservables and accounting for the effect of other related input decisions allowing for
consistent estimates of the effect of parental involvement on child outcomes to be recovered. My
research complements prior papers that have implemented strategies to deal with the endogeneity
of parental involvement such as Avvisati (2013) who exploit a randomized experiment in French
middle schools and De Fraja and Zanchi (2010) who consider the effect of a construct similar to
parental involvement on the probability of the child obtaining a UK GCSE qualification at age
16-17 using a three-stage least squares approach. My research also builds upon prior work in
the education literature that has documented associations between parental involvement and child
outcomes with estimates ranging from positive (Domina (2005); Jeynes (2005); Stewart (2008);
Shumow and Miller (2001)), to negative (Izzo (1999)), to no effects (Domina (2005); Bobbett
(1995)).
Second, I contribute to the literature by providing, to the best of my knowledge, the first
evalu-ation of the effect of policies geared at facilitating parental involvement on child outcomes. Efforts
to facilitate greater contact between parents and schools have been made at the national, state,
parent-school contact highlighting increases in parental involvement as the primary mechanism.
Third, I contribute to the economics literature that has largely analyzed the effect of home
in-puts on child cognitive and non-cognitive skill development, by demonstrating the effect of parental
involvement on home inputs. For instance, Bernal (2008), Del Boca (2014), Fiorini and Keane
(2014), Del Bono (2016), Cunha and Heckman (2008), and Wolpin and Todd (2007) all
demon-strate the importance of various measures or proxies of home inputs to child skill development.
I complement the existing literature by considering an alternate form of parental inputs that has
been positively associated with child skill and an increase in home inputs, and is the subject of
recent national education policy. Prior papers have alluded to the changing nature of the child
skill production function when the child begins formal schooling, as the primary learning
environ-ment shifts from the home to the school and other agents become relevant to child skill formation
(Del Boca (2014); Bernal (2008)), but have not considered the effect of other parental inputs that
are relevant to this stage of the child’s life. My research extends the literature by demonstrating the
role parental involvement plays when the child comes of school age in addition to showing how
parental involvement can affect home inputs which have traditionally been the focus of study in
the literature.
The rest of the paper proceeds as follows, Section 2.2 discusses the data to be used in the
esti-mation and why it is well-suited for this analysis. Section 2.3 describes the theoretical model that
serves as a basis for the empirical section. Section 2.4 gives the empirical specification, discussing
estimation and identification. Section 2.5 gives results. Section 2.6 discusses the effects of policy
simulations and Section 2.7 concludes.
2.2 Data
The dataset used for this analysis is the Early Childhood Longitudinal Study, Kindergarten
on the state of residence of the child, allowing the dataset to be merged with other geocoded
datasets on welfare benefits, employment legislation, labor market conditions, tax rates, and child
care subsidies which are useful for identifying the parameters of interest and evaluating the effects
of policy. There are currently four main waves of data: the fall (2010) and spring (2011) of
kindergarten, the spring of grade 1 (2012),3 the spring of grade 2 (2013), and the spring of grade
3 (2014) with the spring of grades 4 (2015) and 5 (2016) forthcoming. The initial sample in the
fall of kindergarten consisted of approximately 18200 children, however there was attrition in the
survey with each additional wave (See Appendix Table F.2.1).
The sample I use for this analysis makes use of the spring of kindergarten,4 the spring of grade
1, the spring of grade 2, and the spring of grade 3. In constructing my estimation sample, I drop
individuals if they are missing data on outcome variables and key input variables such as math,
reading and non-cognitive scores in addition to data on home inputs, the number of other children,
parental involvement measures, and maternal employment decisions. Since part of my robustness
checks rely on variation within a school, I drop observations where I only observe one individual
per school.5 For individuals who are missing information on exogenous characteristics, I include
a dummy variable to indicate the presence of missing data for continuous variables, and include a
missing data category for categorical variables. I drop individuals who are not observed in the fall
of kindergarten, since key variables of interest are only asked in the fall. I also drop individuals
who are retained in any grade since I do not model the retention decision. Similarly, since I do not
model the decision to change schools each period, I retain individuals until they change schools
and consider them as having attrited after they change schools.6 I compare key variables from the