EFFECTIVENESS OF A NEW PROTOCOL FOR CARIES
MANAGEMENT IN HIGH RISK PATIENTS
Ayesha Swarn
A thesis submitted to the faculty of the University of North Carolina at Chapel Hill in partial fulfillment of the requirements for the degree of
Master of Science in the School of Dentistry (Operative Dentistry)
Chapel Hill 2012
Approved by
ii
© 2012
Ayesha Swarn
iii
ABSTRACT
AYESHA SWARN: Effectiveness of a New Protocol for Caries Management in High Risk Patients
(Under the direction of André V. Ritter)
Objective: To (1) examine the effectiveness of a home-care protocol (CariFree®
, Oral Biotech, Albany, OR) in reducing caries risk in high-risk adults compared to
conventional oral hygiene measures and (2) determine the agreement between a chairside ATP bioluminescence test (CariScreen) and laboratory Mutans Streptococci (MS) counts (CFU/mL of saliva). Methods: 24 high caries risk subjects were randomly assigned to intervention (CariFreetreatment protocol) or control (brush twice and floss once daily) groups. Plaque and stimulated saliva samples were evaluated at baseline, 1 and 3 months for ATP bioluminescence, buffering capacity, Lactobacillus and MS counts. Results: At all evaluation times, no statistically significant difference was observed within groups or between the intervention and control group. The CariScreen scores showed poor
iv
DEDICATION
To my brother
v
ACKNOWLEDGEMENTS
I take this opportunity to recognize all the people who made this thesis possible. First and foremost my sincerest gratitude to Dr. André Ritter, whose constant guidance and support has been extremely valuable in completing this work. I shall cherish his advice on all subjects, personal and professional.
I am indebted to my committee members Dr. Terence Donovan, Dr. Scott Eidson, Dr. Roland Arnold and Dr. Anne Sanders for their mentorship. Without their time and thoughtful inputs this work would not be accomplished.
I would like to thank the Department of Operative Dentistry faculty and staff for their encouragement and making my residency years a pleasure.
I am grateful to my colleagues Supawadee Naorungroj, Roopwant Kaur, Kristi Erickson, Fernando Astorga, Hiroko Nagaoka, Alex Delgado, Sumitha Ahmed and Silvia Amaya Pajares for their friendship and support. They helped transform graduate
education into a joyful experience that I shall treasure forever.
vi
TABLE OF CONTENTS
ACKNOWLEDGEMENTS ... v
LIST OF TABLES ... viii
LIST OF FIGURES ... ix
1 Introduction ... 1
2 Objectives ... 4
2.1Specific Aims ... 4
2.1.1 Primary Aim ... 4
2.1.2 Secondary Aim ... 4
2.2Hypotheses ... 5
3 Literature Review ... 6
3.1Caries Disease Process………...7
3.2Caries Risk Assessment and Management ... 11
3.2.1 CAMBRA (Caries Management by Risk Assessment) ... 13
3.3Motivational Interviewing, Diet Modification, and Oral Hygiene Practices ... 14
3.4Chemical Agents ... 15
3.4.1 Fluoride ... 16
3.4.2 Xylitol ... 17
vii
3.4.4 Sodium Hypochlorite ... 19
3.4.5 Arginine ... 19
3.4.6 Probiotics and Genetically Modified Bacteria ... 19
3.4.7 CariFree® ... 20
4 Materials And Methods ... 21
4.1Participant Selection ... 22
4.1.1 Caries Risk Assessment Form (CRA) ... 23
4.1.2 CariScreen Caries Susceptibility Testing ... 23
4.1.3 Plaque Sample Collection ... 24
4.2Subject Allocation and Randomization Schedule ... 25
4.2.1 CariFree Treatment Protocol ... 26
4.2.2 Control group ... 28
4.2.3 Stimulated Saliva Collection ... 29
4.3Risk Categorization ... 30
4.4Adherence to Protocol Evaluation ... 30
4.5Statistical Analysis ... 30
5 Results ... 32
6 Discussion ... 35
7 Conclusions ... 39
8 Appendices ... 60
viii
LIST OF TABLES
Table
1. Risk factors based on clinical examination ... 50 2. Risk factors based on history ... 51 3. Example of pre-prepared envelopes for randomization
of subjects ... 51 4. Risk categories based on accepted values in literature
and industry for ATP bioluminescence, buffering capacity, Mutans Streptococcus and Lactobacillus
counts ... 52 5. Age, clinical and salivary characteristics of eligible
patients in intervention and control groups at
enrollment ... 53 6. Clinical endpoints for subjects in intervention and
control groups at baseline ... 54 7. Change (difference from baseline) (a) in primary
endpoint and other clinical endpoints, one month
post-randomization ... 55 8. Clinical endpoints for patients in intervention and
control groups three months post randomization ... 56 9. Change (difference from baseline) (a) in primary
endpoint and other clinical endpoints, three months
post-randomization ... 57 10. Mean (95% confidence interval [CI]) change in
buffering capacity(a) at three months from baseline, according to compliance with home care regime,
intervention group (n=12) (b) ... 58 11. Correlation (a) of chairside ATP bioluminescence test
(CariScreen) and salivary Streptococcus mutans count (CFU/mL of saliva) test at three time points in two
ix
LIST OF FIGURES
Figure
1. Schematic simulating the behavior of similar bacterial cultures containing MS and LB, on addition of sugar and (a) controlling pH at 7.0 and (b) allowing pH to fall
for 6 hours ... 40 2. Adapted schematic of the balance between progressive
dental disease at one end and protective factors
maintaining a low risk [7]. ... 41 3. Schematic of chemical structure
(2R,3r,4S)-Pentane-1,2,3,4,5-pentol (Xylitol) ... 41 4. Flowchart depicting the Study Design ... 42 5. Plaque sample collection with CariScreen swabs from
lingual surface of mandibular anterior teeth (a and b). ... 43 6. Spiral PlaterTM (a) used for spiral plating process (b)
over a selective agar media (c) for 24h and bacterial
counts done by zones (d)... 44 7. Mean (s.e.) ATP bioluminescence scores for
intervention and control groups at baseline, and at one
month and three months post-randomization ... 45 8. Mean (s.e.) buffering capacity for intervention and
control groups at baseline, and at one month and three
months post-randomization ... 45 9. Mean (s.e.) Mutans streptococci (x 103) for
intervention and control groups at baseline, and at one
month and three months post-randomization ... 46 10. Mean (s.e.) Lactobacillus (x 103) for intervention and
control groups at baseline, and at one month and three
months post-randomization ... 47 11. Percentage (y axis) and number (table) of subjects in
control group classified in high, intermediate and low risk categories (Table 4) at visits 1, 2, and 3 based on (a) ATP bioluminescence scores, (b) buffering capacity , (c) Streptococcs Mutans counts and (d) Lactobacillus
x
12. Percentage (y axis) and number (table) of subjects in intervention group classified in high, intermediate and low risk categories (Table 4) at visits 1, 2, and 3 based on (a) ATP bioluminescence scores, (b) buffering capacity , (c) Streptococcs Mutans counts and (d)
1
INTRODUCTION
The global burden of oral disease and dental caries has been steadily rising even as improved and novel tools for reconstructing damaged dentition are rapidly evolving. Approximately 90% of the population in developed countries is affected by this
preventable disease[1]. Recent trends suggest an increase in incidence of dental caries amongst specific populations in the US [2]. Dentistry has traditionally managed dental caries through a “drill and fill” approach. This approach has served well to restore function and esthetics, however has failed to prevent the incidence of new carious lesions. The World Health Organization (WHO) through the Sixtieth World Health Assembly has passed a resolution that advocates integration of prevention and early intervention measures of dental caries for all the member nations [3]. Over the past decades, the health care organizations in many nations have still not implemented mandatory comprehensive caries prevention into routine dental practice [4]. The
increased burden of the disease worldwide may also be attributed to the fact that dentists as a majority both in dental schools and practices still focus on the treatment rather than prevention of the disease.
2
model must consistently identify high caries risk patients. These models base the caries risk analysis on a number of factors- both clinical and biological. Caries management by risk assessment (CAMBRA) is a system that focuses on treating and preventing the cause of the disease at an early stage, rather than waiting until it causes irreversible damage to tooth [6-8]. This system is being advocated as a standard of care for practicing dentistry within the dental community.
Studies comparing the appropriate preventive and interventional protocols for caries management following a caries risk assessment have been used for the validation of caries risk assessment models. A systematic review conducted on selected caries prevention methods concluded that enough evidence does not exist to determine the efficacy of new methods of caries prevention and management[9]. A recommendation has been made to increase the number of studies examining prevention among high risk individuals.
The purpose of this thesis is to compare a new protocol for caries management (CariFree®, Oral BioTech, Albany, OR) to conventional oral hygiene measures for treatment of high caries risk subjects. CariFree is a new caries assessment and treatment model based on CAMBRA and uses fluoride, xylitol and pH alteration for decreasing the individual’s risk for caries [10, 11].
3
2
OBJECTIVES
The purpose of this study was to examine the effectiveness of a new protocol for caries management in reducing caries risk when used in high risk adults. The treatment protocol consisted of using home care oral hygiene products (CariFree) for a period of 90 days. The study hypothesis was that the CariFree Treatment Protocol is more effective in reducing caries risk than conventional oral hygiene measures after a 90 day regimen in high risk adults.
2.1 Specific Aims
2.1.1 Primary Aim
To examine the effectiveness of a new home care protocol in reducing caries risk in high risk adults when compared with conventional (or usual) home care.
2.1.2 Secondary Aim
5
2.2 Hypotheses
Primary Aim: The use of CariFree home care protocol will reduce the caries risk in high caries risk adults after a 90 day regimen in comparison with those continuing with conventional oral hygiene practices.
3
LITERATURE REVIEW
Research over the past 50 years has established dental caries as a bacterial based chronic infectious disease. It presents with a time dependent complex etiology involving tooth substrate, bacterial flora, presence of a fermentable carbohydrate source, and access to minerals namely calcium, phosphate and fluoride. The bacteria present in the plaque or oral biofilm adherent to the tooth surface ferment carbohydrates contained in our diet and release acids. These acids diffuse into enamel and dentin, dissolving the mineral
components of the tooth. Under normal conditions the mineral lattice of the tooth behaves like a sieve and free ions such as Ca++ and PO4- present in the saliva migrate back into the lattice of the tooth once the acid is buffered by the saliva.
While this process of demineralization and remineralization is constantly occurring underneath the oral biofilm, under special conditions, a sub-surface carious lesion or break in the tooth surface can develop. These special conditions or risk markers
7
3.1 Caries Disease Process
Specific strains of bacteria such as Mutans Streptococcus (MS) and Lactobacilli (LB), associated with the initiation and progression of the disease, have consistently been isolated in oral plaque and salivary samples. These two strains MS and LB are aciduric and acidogenic with pH varying from 3.8-4.8. For many years it has been considered that the low pH products of metabolism from these two strains result in acid dissolution of tooth structure and further progression of disease [4, 13-15]. More recent research have suggested that while these two strains may be considered as markers for the disease, there are additional groups of organisms that are involved with the progression of the
disease[15, 16]. Since the traits associated with cariogenicity are not associated with a single species of bacteria, it is but evident that measures to combat caries initiation and progression must include other intervention factors.
8
biofilm [20]. The additional questions arising and yet unanswered entirely are whether the modification of the biofilm environment reduces caries.
Dental plaque consists of a film of polymers and bacteria over the tooth surface. These bacteria under stress team up and form a collective called oral biofilm which is attached to the tooth surface. Andre Levchenko mentions that biofilms are large
communities organized like cities with channels for nutrients to go in and waste to go out [21]. The role that Mutans Streptococcus and other organisms present in biofilms play is continuing to unfold methodically through dedicated research. Genetic analysis using genotypic methods such as 16S rRNA gene sequence analysis are being increasingly employed for the isolation of potential pathogens [22]. Interestingly, biofilm growth has shown both indirect and direct influences on gene expression by oral bacterial [23].
Other important virulence factors being investigated are the Streptococcus Mutans Glucosyltransferases. The glucans produced by this enzyme released from the
9
reasons for the increased biofilm tolerance to antimicrobials were elaborated upon by Stewart et al. They hypothesized poor antibiotic penetration, nutrient limitation and slow growth, adaptive stress responses, and formation of persister cells as reasons for the heightened antibiotic resistance [29]. Other confounding features of the biofilm include the heterogeneous distribution of the pH within the structure of the biofilm [30]. This facilitates the growth of different genera of bacteria within the community, which otherwise do not coexist. Consequently an extremely tenacious bio-community
impervious to antibiotics and permanent disruption develops around teeth in susceptible individuals. Meanwhile, the persistent aciduric and acidogenic colonies present in the underbelly of this multilayered film, continue to cause acid demineralization of the tooth structure in the absence of the protective functions of saliva.
10
salivary clearance of a patient and the pH changes of plaque. The Stephan Curve describes the change in dental plaque pH in response to a challenge.The slopes of Stephan curves vary for slow and fast clearance rates [33]. As the pH of the biofilm becomes more acidic, only those bacteria that can survive in a low pH grow. These bacteria are responsible for the demineralization of teeth and the caries process.
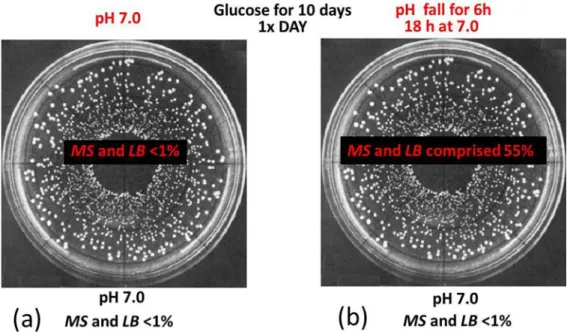
Bradshaw, McKee, and Marsh in 1989 described the effects of carbohydrate pulses and pH on population shifts within oral microbial communities [34]. The results of their experiments demonstrated that in presence of sugar, the SM and LB species multiplied only in the media in which pH changes were allowed to occur (Figure. 1). Hence control over the plaque pH through efficient buffering would seem key in preventing the caries process.
Salivary gland hypofunction is also contributory towards caries risk. While hyposalivation is an objective measure of the amount of salivary production and xerostomia is a subjective feeling of dry mouth, both terminologies are often used in place of each other erroneously. Average normal values of salivary flow rates are 1.5ml/min stimulated and 0.3ml/min unstimulated. However these values have a large variation based on age and sex. To be classified as abnormally low, the salivary flow rate for saliva must be equal to or less than 0.1ml/min for unstimulated and 0.5-0.7ml/min for stimulated. Nonetheless, the symptoms of dry mouth may be experienced even at higher salivary rates. Some of the common causes of hyposalivation include medication, radiation therapy, immune deficiencies, and salivary gland inflammations.
11
fluoride ions for potential remineralization of tooth and lubricants to keep mouth moist[35]. While buffering capacity of saliva is often employed as a measure of caries risk, the measure is not a precise assessment of the pH of the microflora within the depths of the biofilm.
3.2 Caries Risk Assessment and Management
Evidence based protocols for risk assessment and management of dental caries has gained momentum amongst the dental community in recent times [7, 36]. Caries risk assessment has over the past decade included a two pronged approach-evaluating
populations and individualized risk assessment [37]. The disproportionate distribution of caries by race, age, geographic area and socioeconomic status submits the need for individualized caries risk assessment [38]. Caries predictive models for pre-school and school age children have been reported [39, 40]. A review of microbiological factors concluded that while specific bacteria may not be a reliable risk indictor for caries risk for individuals but might be useful while evaluating high caries risk groups [41]. The review goes on to suggest that SM and LB counts may be more predictive in establishing low caries risk more consistently than high caries risk. The past caries experience of a patient has been adjudged as the variable with highest predictive value by others [36, 42]. Due to the multifactorial nature of caries etiology, it is expected that multivariate
12
Various attempts to group the etiological agents of the disease and caries risk predictors have been made in the past. For the purpose of this review, the causative factors which are predictive of disease but not necessarily etiologic variables are referred as “risk indicators”. Other terminologies include “risk factors” as causative variables. A recent review of the clinical studies looking at risk predictors for adult and adolescent dentition and out of 24 total studies found that all included past caries experience as an important predictor followed by “other variables”. Microbiology and host factors completed the list in both adults and children. While looking at root caries, the host factors were ranked higher than the microbiology. So the challenge is to better define how contributing factors interact and how this translates into a cost-effective strategy for
disease diagnosis, prevention, and management. In a recent review on the caries risk assessment for prosthodontic patients, a tabulation of the most common risk factors based on clinical exams were presented [8]. Tables 1 and 2 present an edited version of the same.
The validity of the various caries prediction models that are present to predict caries need to be studied in the context of their application within specific populations. All models are typically arithmetic calculations including a combination of the above mentioned risk factors and indicators. A high specificity for the model is desirable in case the instrument is used for a large population based survey in order to avoid false
13
3.2.1 CAMBRA (Caries Management by Risk Assessment)
CAMBRA was formed by an unofficial group called the Western CAMBRA Coalition and included representatives from education, research, industry, governmental agencies and private practitioners based in the western states of the US [43]. The
CAMBRA risk assessment tool divides risk of developing dental caries into the following subdivisions [7].
3.2.1.1 Caries risk indicators
Visible cavities or radiographic penetration of the dentin, radiographic proximal enamel lesions (not in dentin), white spots on smooth surfaces, restorations last 3 years.
3.2.1.2 Caries risk factors (Biological predisposing factors)
Mutans Streptococcus (MS) and Lactobacillus (LB) both medium or high (by culture), visible heavy plaque on teeth, frequent snack (> 3x daily between meals), deep pits and fissures, recreational drug use, inadequate saliva flow by observation or
14
3.2.1.3 Caries protective factors
Lives/work/school fluoridated community, fluoride toothpaste at least once daily, fluoride toothpaste at least 2x daily, fluoride mouthrinse (0.05% NaF) daily, 5,000 ppm F fluoride toothpaste daily, fluoride varnish in last 6 months, office F topical in last 6 months, chlorhexidine prescribed/used one week each of last 6 months, xylitol
gum/lozenges 4x daily last 6 months, calcium and phosphate paste during last 6 months, Adequate saliva flow (> 1 ml/min stimulated).
Figure 2 represents the interplay between the various factors. The caries balance must be maintained by appropriate use of therapeutic agents since surgically replacing the diseased part of the tooth does not decrease risk of future disease [44, 45]. The past experience of the disease itself being its most prominent risk indicator, an emphasis on a preventive approach to treat the disease needs to be investigated further. Since dental caries is a biofilm (or bacteria) mediated disease, the current evidence-based prevention methods include fluoride applications, diet modifications and good oral hygiene
practices.
3.3 Motivational Interviewing, Diet Modification, and Oral Hygiene Practices
15
therapy. Behavioral patterns need to be reviewed. Patient compliance is often the biggest factor reducing the success of caries control therapy [46]. Motivational interviewing, a patient-centered counseling technique, has been found to be effective in reducing caries in high-risk young children [47]. It was first described by Dr William Miller in 1983 in relation to his work with alcoholics. The approach includes techniques such as open-ended questions, reflective listening, affirmation, and summarization to help individuals express their concerns about change. Evidence of success using this technique in the health care setting is useful in improving patient adherence to treatment protocols.
Primary causative agents for caries being the resident oral flora, the goal of therapy is to reduce or control the number of bacteria and not eliminate the flora completely. Mechanical removal of plaque by itself has documented to be inadequate without use of adjunct chemical methods.
3.4 Chemical Agents
16
3.4.1 Fluoride
The evidence base for fluoride significantly decreasing caries risk is well
established [48, 49]. The mode of action of these products is via fluoroapatite formation, remineralization, antimicrobial action and prevention of ionic bonding of pellicle to tooth. This effect is however based on the patients overall burden of risk factors. Fluorides are available for topical applications mouthrinses, gels, or varnishes;
dentifrices, or systemic through milk and water fluoridation. Reports in literature suggests that topical fluorides used in addition to fluoride toothpaste achieve a modest reduction in caries compared to toothpaste used alone [50]. Toothpastes containing fluoride between 1000-1100 ppm have proven effective while anything below 600ppm have shown to be of limited value. The overall reduction in caries reported with their use is between 20-35% [51]. Fluoride containing oral rinses when used along with brushing twice daily with fluoridated toothpaste provided an increase in caries reduction by 10%. While both the above mentioned forms of fluoride delivery depend on patient compliance, professional application of the fluoride at regular intervals as varnishes (5% NaF) have proven to be efficacious [48, 52].
Fluoride containing products along with pit and fissure sealants and dietary management are considered as the mainstay of caries management. Other non-fluoride containing products are also available in the profession. The American Dental
17
effectiveness of various non-fluoride agents in preventing cavities. The review included the current available agents such as polyol sugars, chlorhexidine, arginine and probiotics. A brief review of these agents follows.
3.4.2 Xylitol
Xylitol by chemistry is a “polyol” or “sugar alcohol” (Figure 3). Xylitol along with sorbitol are non-fermentable sugars and are used as a sugar replacement in chewing gums.
The regular use of xylitol as mints or chewing gums is suspected to prevent caries by increasing salivary flow through mastication, reducing colonies of MS and reducing plaque acidogenesis [53]. This altered pH of the environment possibly aids in promoting remineralization of subsurface enamel lesions. Xylitol also has the unique ability to select for a MS population with weakened virulence factors [54, 55]. Recommended doses are 5-7 grams of xylitol at a frequency of at least three times per day [56], but a lack of consensus however regarding their dosage still exists.
Additionally, the primary therapeutic agent is available in many marketable forms such as sugar-free chewing gum, lozenges and hard candy including xylitol or polyol
18
3.4.3 Chlorhexidine
Chlorhexidine (CHX) has a well-established evidence base as an antiplaque agent and is used as a gold standard of treatment. It was first introduced in 1954 as an
antiseptic. CHX is a strong base with cationic properties and binds to the negatively charged bacterial wall causing disturbance of membrane functions. It is effective on both gram positive and gram negative bacteria. The effect on gram negative bacteria however is weak. The chemical agent is bacteriostatic in strong concentrations and immediately after application. Literature supports reduction in plaque microflora by 80-95% on single mouthrinse with 0.2% CHX solution. It also helps convert the pH of the plaque by
retarding the metabolism of bacteria in low doses by inhibiting bacterial enzymes such as glucosyltransferase and phosphophenolpyruvate phosphotransferase [58]. CHX displays very high substantive properties and maintains bacteriostatic potency even after
adsorption on tooth surface. Currently, only mouthrinses containing 0.12 percent CHX are marketed in the United States (US). Two independent reviews of literature concluded that the evidence behind efficacy of CHX rinses in reducing caries has been inconclusive [59, 60]. Hence CHX rinses alone cannot be recommended for caries control. A
19
3.4.4 Sodium Hypochlorite
Sodium hypochlorite solution is frequently used as a disinfectant or a bleaching agent. It has broad antimicrobial activity, rapid bactericidal action, relative non-toxicity at use concentrations and no staining. Hypochlorite is lethal to most bacteria, fungi and viruses. Hypochlorite solutions are extremely reactive and gradually lose strength, so fresh solutions should be prepared daily. At high concentrations however, irritation of mucous membranes is noticed. Hypochorite is also known to have deproteinization effect and has shown to increase the level of Ca+2 uptake by carious lesions in experimental in-vitro specimens [63]. More evidence regarding the anti-cariogenic effect of sodium hypochlorite is necessary at this time to validate its use as an effective anti-cariogenic agent.
3.4.5 Arginine
Recent research has shown the addition of the arginine within dentifrices and food products interferes with the initiation and progression of caries [64]. Tooth
remineralization has also shown to be positively stimulated. The interaction of arginine with other flora at this time needs to be investigated further before a definitive disease reduction benefit can be observed.
3.4.6 Probiotics and Genetically Modified Bacteria
Probiotics are usually live microrganisms (bacteria) which are similar to
20
their safety and effectiveness long term have not been tested satisfactorily. Genetically modified biomolecules aimed at preferentially targeting cariogenic species in biofilms have also been engineered. Ongoing research in these “smart molecules” against specific bacteria are encouraging; however further investigation is necessary before they can be introduced in the population [65, 66].
3.4.7 CariFree®
CariFree(Oral BioTech, Albany, OR) is a caries risk assessment and treatment model based on the CAMBRA approach. Caries risk is determined based on a
4
Materials And Methods
This study was a prospective randomized controlled clinical trial to evaluate the effectiveness of the CariFree Treatment protocol in reducing caries risk markers on high caries risk individuals. During the screening process, subjects were categorized as at risk or low risk on the basis of a Caries Risk Assessment (CRA) form and an ATP
bioluminescence score (CariScreen). Subjects were randomized and placed into either the intervention group (receiving CariFree products) or the control group (continued
conventional oral oral hygiene practices) and followed for 90 days to observe the change in their caries risk based on a set of predefined outcome variables, or caries risk markers. Saliva and plaque samples were collected at 3 time periods; baseline (visit 1), 30 days after baseline (visit 2) and 90 days after baseline (visit 3).
22
4.1 Participant Selection
All the participants selected for this study (n=24) were recruited from the UNC School of Dentistry Clinics patient pool and UNC student/employee population. Potential participants were only approached after IRB review and approval of the study protocol, consent forms, and other documents. IRB authorization (and waiver) to access clinic schedules and pre-screen patient records in advance of clinic appointments was also obtained, so that potential subjects that satisfy inclusion criteria and showed evidence of recent restorative work could be approached and invited to participate. Patients were screened at the UNC School of Dentistry clinics and only high caries risk subjects were recruited. Inclusion and exclusion criteria were as follows:
Inclusion criteria
Adults (18-80 years old) At least 12 teeth present
At risk (based on CariScreen scores > 1500 and CRA form) Agreement to comply with study protocol
Able to read, understand, and sign consent form
Exclusion criteria
Allergy to study materials components Periodontal disease Type IV
Undergoing antibiotic therapy Undergoing radiation therapy
23
A chair-side ATP bioluminescence measurement (CariScreen) and a caries risk assessment analysis (CRA form) were performed on all qualifying subjects willing to participate in the study. The first 24 subjects with a combined “at risk” reading with CariScreen and CRA form were enrolled. Details about using the tools and interpreting the reading are provided in the following sections.
4.1.1 Caries Risk Assessment Form (CRA)
The CRA form (Appendix A) is a simplified version of the risk assessment form developed by at the University of California, San Francisco. It has been further modified by others to make it less time consuming for the dental practice setting [7, 45]. The form covers disease indicators such as radiographic lesions and white spot lesions along with such risk factors as diet, dental hygiene, saliva flow, medications, bacterial population, and dental history to identify risk for decay. A subject was categorized as “at risk” with a CRA score of 1 or more risk indicators and 2 or more risk factors.
4.1.2 CariScreen Caries Susceptibility Testing
4.1.2.1 The CariScreen Caries Susceptibility Testing Swabs
24
physically breaking the seal after swabbing. The reactive agents combine with the plaque bacteria and a chemical reaction occurs. Chemical energy is converted to light energy once placed in the CariScreen Caries Susceptibility Testing Meter and the result is read as the intensity of light in Relative Light Units (RLU). The test must be read within 1
minute of activating. Reaction [69]:
ATP + Luciferin + O2 + Luciferase + Mg2+ ---> AMP +oxyluciferin + PPi + CO2 + light((560 nm)
4.1.2.2 The CariScreen Caries Susceptibility Testing Meter
The meter is a hand held device used to measure the chair-side ATP obtained from a sample of the subject’s plaque mass. The meter needs to be calibrated internally each time before making a measurement. This is done by turning it on and takes 60 seconds to be ready to receive a fresh swab sample.
The procedure for making the measurement is described below and was performed as per the manufacturer’s recommendations.
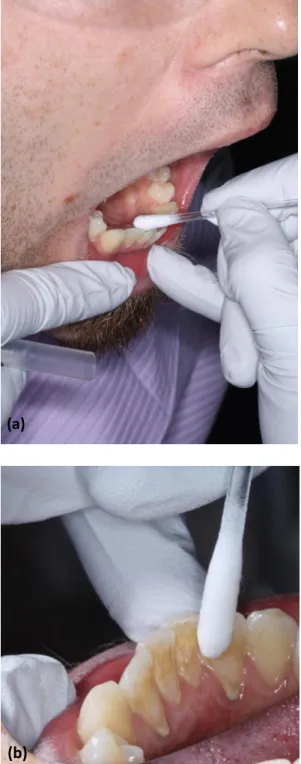
4.1.3 Plaque Sample Collection
25
4.1.3.1 Sample activation
The swab tube is secured with one hand, and the thumb and index fingers of other hand are used to snap the valve connecting shaft to bulb containing the enzymatic liquid. The liquid is squeezed into the tube shaft and allowed to bathe the swab for 10 sec. The swab is now activated and must be read in the meter within 1 min.
4.1.3.2 Meter reading
The activated CarieScreen device is inserted in to the CarieScreen meter and the lid is shut. The device is turned on and counts down till 15 sec. Readings appear on a screen in the form of Relative light units (RLU). The luciferase contained in the
CariScreen system is based on the “flash-type” luminescence signal, with RLU readouts peaking at 2 minutes [69]. According to manufacturer’s guidelines they are interpreted as: “low risk” 1-1500; “at risk” 1501-9999. This was done within 1 minute of swabbing for all samples collected. The swab was then removed and destroyed.
4.2 Subject Allocation and Randomization Schedule
26
with a computer random number generator ensured that equal numbers of subjects (n=12) were assigned to each arm. This is critical in trials with small numbers of subjects. The purpose of randomization was to balance the arms as much as possible with respect to known and unknown prognostic factors for dental caries. Within blocks, stratification ensured that both groups were balanced on salivary pH (low versus high pH), an
important characteristic influencing dental caries risk. The salivary pH was measured by placing pHion Diagnostic pH Test Strips (pHion Balance, Scottsdale, AZ) in the buccal vestibule for 15 seconds. The chairside pH was determined by color transition of the strips and read as numerical scores in increments of 0.25. Those subjects 6.5 and above were considered low risk and those below were considered as high risk. Overall, this design optimized conditions to test the efficacy of the CariFree intervention on risk of dental caries.
The intervention group received the CariFree Treatment products to be used for 3 months as per manufacturer recommendations and the control group continued oral hygiene practices. Both protocols are described in detail in the following sections.
4.2.1 CariFree Treatment Protocol
27
4.2.1.1 CariFree Treatment rinse
This rinse is used in the first 30 day of starting treatment. The rinse consists of sodium fluoride 0.05%, water, xylitol, menthol, natural flavors, sodium benzoate,
poloxomer 407, sodium hydroxide, sodium hypochlorite. Instructions include using rinse for two times daily for 30 days. Instructions- Mix 5mL from bottle A with 5ml from bottle B and rinse with solution for 1 minute and spit out. Wait 30 minutes before eating or drinking.
4.2.1.2 CariFree Maintenance rinse
The maintenance rinse is used after the 30 day use of the treatment rinse. It contains sodium fluoride 0.05%, menthol, natural flavors, polysorbate 20, potassium sorbate, sodium benzoate, sodium bicarbonate, water, xylitol. It must be used twice daily after brushing and flossing for 60 days. Instructions- Rinse with 10mL of the solution for 1 minute and spit out. Wait 30 minutes before eating or drinking.
4.2.1.3 CarieFree Oral neutralizer gel
The gel contains glycerin, hydrogenated starch hydrolysate, hydroxethyl
28
4.2.1.4 CariFree Boost
Boost is an oral spray with a pH close to neutral. It contains purified water, xylitol, glycerin, sodium benzoate, calcium hydroxide, natural flavors, and natural colors. Instructions-Use 2-3 sprays in mouth as often as needed to relieve dry mouth and
neutralize acids. Between meals and before bedtime recommended.
4.2.1.5 CariFree Xylitol gum
A small sample (6 parts) of chewing gum was included. This did not constitute the center of the intervention treatment, but was used more to introduce patients to a xylitol based chewing gum. It contains xylitol, gum base, natural flavors, glycerin, gum arabic, soy lecithin, calcium acetate, beeswax. Instructions- Chew 2 pieces, 3-5 times daily. Recommended after meals or when dry mouth/bad breath occurs.
4.2.2 Control group
The 12 subjects in the control group were asked to follow conventional oral hygiene practices for 90 days. This constitutes brushing 2 times daily with an over the counter fluoridated tooth paste and flossing once daily.
29
4.2.3 Stimulated Saliva Collection
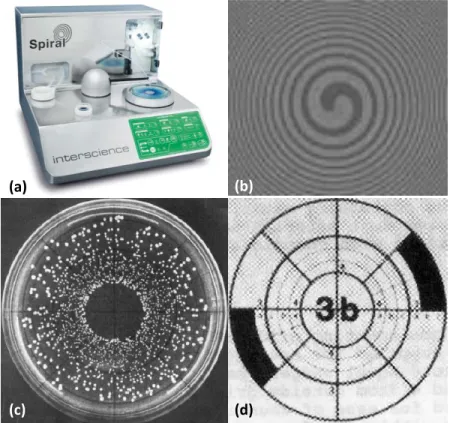
For the saliva collection, the participants were given a paraffin wax tablet and instructed to chew on it for 5 minutes and saliva was collected and expelled into a sterile calibrated collection container up to the 5 minute mark. All samples were collected at the same time of the day for each subject. The sample was coded with the unique participant identifier and transported on ice to the laboratory for determination of buffering capacity, the mutans streptococci (MS) and lactobacilli (LB) counts. The saliva was diluted four-fold in 0.005N HCl and the final pH determined after ten minutes. The pH values of 4.0 or less were considered high risk, 4.1 to 4.9 intermediate risk and 5.0 or greater were considered normal. Serial 10-fold dilutions of saliva were done and quantitatively plated (Spiral PlaterTM model DU2; Spiral Systems Inc.) to DifcoTM Mitis Salivarius Agar supplemented with Chapman Tellurite solution and with bacitracin for the selective enumeration of MS and to BBLTM
30
4.3 Risk Categorization
Categorization of participants into high, intermediate and low risk categories for both groups was done based on the ranges in outcome variables as provided in Table 4. This was done in order to observe the shift clinical risk categories as the treatment proceeded.
4.4 Adherence to Protocol Evaluation
At day 30 (visit 2) and day 90 (visit 3) subjects in both groups were questioned about their adherence to protocol via a questionnaire (Appendix B). Subject’s responses regarding frequency of oral rinsing, tooth brushing and flossing were recorded.
4.5 Statistical Analysis
Initial exploration using histograms and normal quantile diagnostic plots showed that counts of MS and LB at each visit were strongly skewed towards higher values. Zero values for LB were substituted with a “1” value prior to computation of base 10
31
and range for clinical endpoints were reported in descriptive tables and figures,
differences were tested for statistical significance using two-sample Wilcoxon rank-sum (Mann-Whitney) test; a nonparametric analogue of the independent samples t-test. Analytic analysis began with a baseline comparison of patient characteristics in intervention and control groups. Change from baseline for clinical endpoints was
5
RESULTS
The results of the study are focused on two aims. The primary aim was to
examine the effectiveness of the CariFree Treatment protocol in reducing caries risk. The outcome variables used to measure effectiveness of protocol were:
i. Plaque ATP bioluminescence scores read in Relative Light Units (RLU) ranging from 0-9999. Any score 1500 or below is considered low risk.
ii. Salivary Buffering capacity read as a laboratory pH measurement. pH
measurements obtained were ranging from 3.0-6.1 for the entire study population iii. Salivary Mutans Streptococcus (MS) counts
iv. Salivary Lactobacillus (LB) counts
The secondary outcome of interest was the correlation between the chairside ATP bioluminescence scores and MS counts.
33
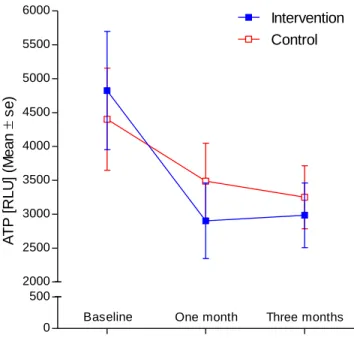
Tables 6 and 8 describe the clinical end points of the outcome variables at end of 1 month and 3 month respectively while Tables 7 and 9 describe the difference in the clinical end points at 1 month and 3 months from baseline respectively. The primary end point of ATP bioluminescence appears to have a larger variation from baseline in the intervention group than control group at both time periods. This change can also be appreciated in Figure 7. The mean values in both intervention and control group show a tendency to decrease at the 1 month time although both do not reach statistical
significance.
While mean values for buffering capacity remained unaltered in the control group between baseline and three-month follow-up, the corresponding values for the
intervention group showed a tendency to increase over time (Figure 8). However these differences failed to reach statistical significance.
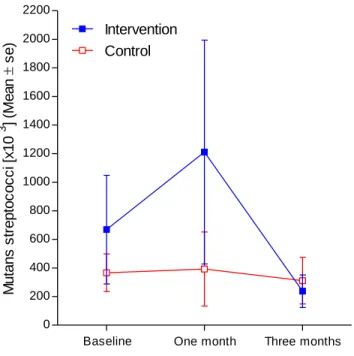
Figures 9 and 10 show the mean MS and LB counts values respectively at baseline, 1 month and 3 months for both groups. The mean values of MS and LB in the control group remained unaltered during the study, while those for the intervention group showed a tendency to increase from baseline at the 1 month measurement, and then appeared to decrease resulting in a negative change from baseline at the 3 month (Table 9).
34
the total number of subjects in the high risk category based on ATP scores reduced by 66.6% (4 out of 6) at visit 3 from baseline (Figure 12). A similar reduction in the high risk category of 42.8% in SM counts and 33.3% for buffering capacity from baseline to Visit 3 was observed. No remarkable change based on LB counts was observed.
The adherence to protocol questionnaire (Appendix B) showed that at visit 2 seven of the twelve subjects (58.3%) randomly assigned to the intervention group complied to brushing twice daily. This was a slight improvement from the visit 1
compliance of 50%. Compliance to rinsing two times daily also improved from 41.6% at visit 1 to 66.6 % at visit 2. All of the non-compliant subjects brushed and rinsed at least once daily. Flossing once daily had adherence rates of 83.3% at visit 1 and 100% at visit 2.
For the subjects assigned to the control group, compliance rates for brushing twice daily started at 91% at visit 1 but dropped to 63.6% at visit 2. Daily compliance for flossing dropped similarly from 75% to 46% at visit 2. No data was recorded for rinsing, since that was not part of protocol for the control group.
The correlation between the chairside ATP bioluminescence test and the
6
DISCUSSION
The results of this study show no significant difference between intervention and control groups at 3 months post initiation of treatment based on the study outcomes. The study outcomes under investigation were ATP bioluminescence scores, buffering
capacity, Mutans Streptococci and Lactobacillus counts.
The intervention group received CariFree treatment and maintenance
mouthrinses, neutralizing gel, boost oral spray and samples of xylitol gum. The treatment rinse contains sodium fluoride 0.05%, water, xylitol, sodium hydroxide and sodium hypochlorite. The amount of xylitol delivered per dose with this rinse is approximately 1gm (x 2 times daily). Efficacy of xylitol is dose-dependent, and the minimum amount needed to provide a beneficial effect on the plaque biofilm has been shown to be 5-6 grams/day, divided into three to four doses, for 5-10 minutes per exposure [70]. Hence the xylitol from the rinse by itself is insufficient to show therapeutic effect. It could be supplemented by oral xylitol mints/chewing gums after reviewing the amount of xylitol being delivered through them, since the effects of xylitol on MS plateau between 6.44 g and 10.32 g. xylitol/day [71].
36
ATP bioluminescence scores. The MS and LB scores appear to follow an opposite trend to the ATP scores. This may be explained by the following sequence of events. Sodium hypochlorite and its decomposition byproducts such as hypochlorous acid, by nature are highly reactive. They combine with the first surface they contact and lose their potency rapidly. Considering the inherent protective structure of the biofilm and reduced access to antimicrobials [72], there is a possibility that only the outer layers of the biofilm were penetrated by the rinse. This would then facilitate the MS and LB that were buried deeper in the tiers to become exposed and more susceptible to collection via the stimulated saliva collection technique, causing the apparent trend observed at visit 1. No such trend was observed in the control group with the bacterial counts. A small trend towards decline in the ATP scores was observed but that might be attributed to an improvement in oral hygiene measures in both groups since enrollment in the study.
At visit 2 (3 months), measurements were made after using the maintenance rinse for 60 days. The maintenance rinse contains sodium fluoride 0.05%, water, xylitol and sodium hydroxide. The general trend observed for both ATP scores and bacterial counts was a reduction in total number in the intervention group suggestive of possible efficacy of treatment; however the difference observed did not assume statistical significance. A similar trend but to a lesser degree was observed in the control group.
37
them in a position to support and motivate behavior change. During the counseling sessions a possible confounding factor came to light and was associated with the poor compliance to rinsing in the first month due to the unpleasant taste of the treatment rinse.
The Rapid ATP Bioluminescence Assays using luciferase enzymes as used in our study have been found to have a high correlation with the total plaque mass [10, 11, 67, 74]. A study looking at the assay of the plaque and saliva samples around orthodontic brackets in 14 individuals with ages 11-17 and concluded that ATP-driven
bioluminescence is highly predictive of the numbers of total oral bacteria and total oral streptococci, and by statistical extension, also reflective of the numbers of mutans streptococci [11]. The same core group further evaluated the correlation between mutans streptococci and ATP Bioluminescence for 33 subjects 7-12 years in age [69]. In this study the authors took plaque samples from the mixed dentition at 4 different sites- facial of right maxillary first molar, maxillary left central incisor and lingual of left mandibular premolar and anterior incisor followed by collection of a stimulated saliva specimen. Pearson correlation coefficients of 0.682, 0.611, and 0.548 were identified for total oral bacteria, total oral streptococci, and MS, respectively. In our study we were looking specifically at the correlation between the total MS counts in saliva and ATP
Bioluminescence of the plaque mass. Contrary to the findings of the previously
38
from only one site as per the manufacturer instructions (the mandibular incisal lingual surface) as opposed to different areas around the mouth. Thirdly, no correlation was established in this study with the total bacterial counts, which is also a limitation of our study.
While the outcomes have not shown any statistically significant difference
between the two groups or between the starting and end point of treatment, there is a shift in the individual risk categories of the 24 patients observed through the course of the treatment suggestive that perhaps the time frame of this study was insufficient to determine the efficacy of treatment statistically.
Due to limitations in time and cost, the total number of subjects in each group was 12, out of which 1 was lost to follow up in the control group at the third visit. While the total sample population was randomized using stratified block randomization, all subjects were high caries risk and displayed a wide range in their ATP and bacterial count scores, reducing the power of the sample. All attempts were made to motivate the subjects to improve their oral hygiene and remain adherent to the protocol but making an objective assessment such as recording plaque indices at each visit would have provided useful information. Additionally, as a prelude to the 3 month treatment, a run-in phase, to monitor the compliance of the subjects might have helped eliminate non-compliant subjects. As opposed to some previous studies, the total bacterial counts were not calculated as a measure of the effectiveness of the CariFree treatment rinses; only the cariogenic species MS and LB were monitored over a period of 3 months [11, 69]. Lastly, if this study could be extended to follow the progress of these subjects for a longer
7
CONCLUSIONS
Within the limitations of this study the following conclusions were drawn: 1. The CariFree home care protocol did not statistically reduce the caries risk in
“high” caries risk adults after a 90 day regimen when compared with traditional oral hygiene practices.
2. There was poor agreement between CariScreen ATP bioluminescence assay and laboratory streptococcal counts, thereby implying that the reduction in overall plaque mass did not correlate with the reduction in percentage MS. The CariScreen chair side measurement tool though may prove to be a usual adjunct in patient motivation and monitoring progress in plaque control. 3. While a statistically significant reduction in caries risk was not obtained, there
was a noticeable shift in the number of subjects in the intervention group from a higher risk category to a lesser risk category in all outcomes evaluated except LB counts. A similar trend, but to a lesser degree was noticed for the control group.
FIGURES
41
Fig. 2. Adapted schematic of the balance between progressive dental disease at one end and protective factors maintaining a low risk [7].
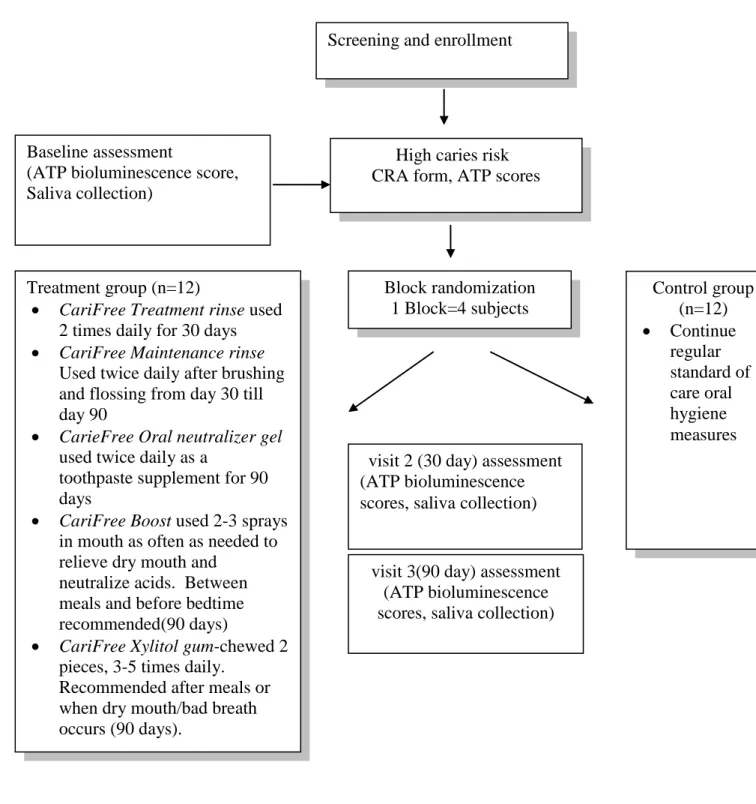
Fig. 4. Flowchart depicting the Study Design
visit 3(90 day) assessment (ATP bioluminescence scores, saliva collection) Screening and enrollment
Treatment group (n=12)
CariFree Treatment rinse used 2 times daily for 30 days
CariFree Maintenance rinse
Used twice daily after brushing and flossing from day 30 till day 90
CarieFree Oral neutralizer gel
used twice daily as a
toothpaste supplement for 90 days
CariFree Boost used 2-3 sprays in mouth as often as needed to relieve dry mouth and
neutralize acids. Between meals and before bedtime recommended(90 days)
CariFree Xylitol gum-chewed 2 pieces, 3-5 times daily.
Recommended after meals or when dry mouth/bad breath occurs (90 days).
Control group (n=12) Continue regular standard of care oral hygiene measures High caries risk
CRA form, ATP scores subjects (n=24) Baseline assessment
(ATP bioluminescence score, Saliva collection)
visit 2 (30 day) assessment (ATP bioluminescence scores, saliva collection)
43 (a)
(b)
44 (a)
(d)
(c)
(b)
45 0 500 2000 2500 3000 3500 4000 4500 5000 5500 6000
Baseline One month Three months
Control Intervention A T P [ R L U ] (M e a n
s
e
)
Fig. 7. Mean (s.e.) ATP bioluminescence scores for intervention and control groups at baseline, and at one month and three months post-randomization
0.0 0.5 3.5 4.0 4.5 5.0 5.5 6.0
Baseline One month Three months
Intervention Control B u ff e ri n g c a p a c ity ( M e a n
s
e
)
[p
H
]
46 0 200 400 600 800 1000 1200 1400 1600 1800 2000 2200
Baseline One month Three months
Control Intervention M u ta n s s tr e p to c o c c i [ x1 0 3 ] (M e a n s e )
47 0 500 1000 1500 2000 2500 3000 3500 4000 4500 5000
Baseline One month Three months
Intervention Control L a c to b a c ill u s [ x1 0 3 ] (M e a n s e )
Fig. 11. Percentage (y axis) and number (table) of subjects in control group classified in high, intermediate and low risk categories (Table 4) at visits 1, 2, and 3 based on (a) ATP bioluminescence scores, (b) buffering capacity , (c) Streptococcs Mutans counts and (d) Lactobacillus counts.
Visit 1 Visit 2 Visit 3
HIGH 5 4 3
INTERMEDIATE 7 6 8
LOW 0 2 0
0% 20% 40% 60% 80% 100% ATP(Control)
Visit 1 Visit 2 Visit 3
HIGH 5 3 2
INTERMEDIATE 0 3 4
LOW 6 5 5
0% 20% 40% 60% 80% 100% Buffering Capacity (Control)
Visit 1 Visit 2 Visit 3
HIGH 8 6 3
INTERMEDIATE 3 6 5
LOW 1 0 3
0% 20% 40% 60% 80% 100% Streptococcus Mutans (Control)
Visit 1 Visit 2 Visit 3
HIGH 8 6 7
INTERMEDIATE 1 1 1
LOW 3 5 3
49
Visit 1 Visit 2 Visit 3
HIGH 6 2 2
INTERMEDIATE 6 8 8
LOW 0 2 2
0% 20% 40% 60% 80% 100% ATP (Intervention)
Visit 1 Visit 2 Visit 3
HIGH 6 5 4
INTERMEDIATE 1 5 3
LOW 5 2 5
0% 20% 40% 60% 80% 100% Buffering Capacity (Intervention)
Visit 1 Visit 2 Visit 3
HIGH 7 7 4
INTERMEDIATE 5 2 5
LOW 0 3 3
0% 20% 40% 60% 80% 100% Streptococcus Mutans (Intervention)
Visit 1 Visit 2 Visit 3
HIGH 9 9 7
INTERMEDIATE 1 1 3
LOW 2 2 2
0% 20% 40% 60% 80% 100% Lactobacillus (Intervention) (a) (d) (c) (b)
Fig. 12. Percentage (y axis) and number (table) of subjects in intervention group classified in high, intermediate and low risk categories (Table 4) at visits 1, 2, and 3 based on (a) ATP bioluminescence scores, (b) buffering capacity , (c)
Streptococcs Mutans counts and (d) Lactobacillus counts.
50
TABLES
Table 1. Risk factors based on clinical examination
(1) Intermediate or High Streptococcus Mutans and Lactobacillus counts (2) Inadequate saliva flow (<0.07ml/min stimulated)
(3) Large number of filled teeth (4) Visible heavy plaque
(5) Recession with exposed
(6) Defective restorations with open margins (7) Fixed/Removable dental prostheses (8) Deep pits and fissures
(9) Noncavitated Lesions
\
51 Table 2. Risk factors based on history
(1) Existing or recent history of caries (2) No dental visit in the past 6 months
(3) Limited lifetime exposure to water fluoridation (4) Brushes once a day or less
(5) Salivary reducing factors (medication, radiation) (6) Frequent snacking between meals (>3 times) (7) Health behavior risks (smoking, eating disorders) (8) Low socio-economic status
(9) Low education levels (10) Impaired cognitive ability
Table 3. Example of pre-prepared envelopes for randomization of subjects
Envelope 1 Envelope 2 Envelope 3 Envelope 4 Envelope 5 Envelope 6
Intervention Intervention Control Intervention Control Control
52
Table 4. Risk categories based on accepted values in literature and industry for ATP bioluminescence, buffering capacity, Mutans Streptococcus and Lactobacillus counts
Low Risk Intermediate Risk High Risk
ATP (RLU) 0-1500 1501-4500 4500-9999
Buffering capacity- final pH (diluted 1
to 4 in 0.005N HCl): 5.0-7.0 4.1-4.9 ≤4.0
Mutans streptococci (MSB counts) < 104 CFU/ml 2x10⁴ to 9x10⁴ CFU/ml 1x10⁵ or greater CFU/ml
Lactobacillus (Ragosa SL) < 103 CFU/ml 1x10³ to 9x10³ CFU/ml 1x10⁴ or greater CFU/ml
53
Table 5. Age, clinical and salivary characteristics of eligible patients in intervention and control groups at enrollment
Characteristics Total sample
N=24
Intervention group n=12
Control group
n= 12 P-value
(a)
Mea n
Std.
Dev. Min Max Mean
Std.
Dev. Min Max Mean
Std.
Dev. Min Max
Age (years) 37.5 10.1 22.0 58.0 38.4 9.6 22.0 51.0 36.5 10.9 23.0 58.0 0.543
Buffering capacity final pH 4.5 1.2 3.0 6.1 4.2 1.4 3.0 5.8 4.8 1.1 3.0 6.1 0.272
Chair-side pH 6.5 0.4 5.5 7.0 6.5 0.5 5.5 7.0 6.5 0.4 5.5 7.0 0.881
ATP (RLU) 4613
.8 2770.5 1638.0 9972.0 4824.7 3025.6 1792.0 9832.0 4402.8 2607.3 1638.0 9972.0 0.603
Mutans streptococci (MSB) (x 103) 517.
4 975.5 0.5 4600.0 668.6 1315.5 0.5 4600.0 366.2 457.7 0.8 1300.0 0.885
Lactobacillus (Ragosa SL) (x 103)
485.
7 1735.1 0.0 8600.0 853.1 2443.5 0.0 8600.0 118.3 171.0 0.0 490.0 0.340
Salivary flow rate (mL/minute) 1.4 1.1 0.0 5.0 1.5 1.2 0.5 5.0 1.2 1.0 0.0 3.4 0.644
(a)
P-values test null hypothesis of equivalence between intervention and control groups using two-sample Wilcoxon rank-sum (Mann-Whitney) test
54
Table 6. Clinical endpoints for subjects in intervention and control groups at baseline
Characteristics Intervention group
n=12
Control group
n= 12 P-value
(a)
Mean Std. Dev. Min Max Mean Std. Dev. Min Max
Buffering capacity final pH 4.1 1.0 3.0 5.8 4.4 1.1 3.0 5.8 0.531
Chair-side pH 6.6 0.4 5.8 7.0 6.3 0.4 5.5 6.8 0.063
ATP (RLU) 2902.8 1931.8 467.0 7470.0 3489.1 1934.1 467.0 6521.0 0.488
Mutans streptococci (MSB) (x 103) 1211.3 2711.1 0.0 9700.0 393.1 897.6 22.0 3200.0 0.603
Lactobacillus (Ragosa SL) (x 103) 2277.8 7160.6 0.0 25000.0 89.8 241.0 0.0 850.0 0.067
Salivary flow rate (ml/minute) 1.3 0.7 0.0 2.3 1.2 0.6 0.2 2.3 0.751
(a) P-values test null hypothesis of equivalence between intervention and control groups using two-sample Wilcoxon rank-sum (Mann-Whitney) test
55
Table 7. Change (difference from baseline)(a) in primary endpoint and other clinical endpoints, one month post-randomization
Characteristics Intervention group
n=12
Control group
n= 12 P-value
(b)
Mean
difference(b) Std. Dev. Mean difference
(b)
Std. Dev.
Buffering capacity final pH -0.15 1.48 -0.34 1.10 0.620
Chair-side pH 0.10 0.34 -0.15 0.45 0.248
ATP (RLU) -1921.92 2275.04 -913.75 1531.34 0.356
Mutans streptococci (MSB) (x 103) 542.66 3177.34 26.93 712.81 0.773
Lactobacillus (Ragosa SL) (x 103) 1424.65 7721.89 -28.42 169.13 0.419
Salivary flow rate (ml/minute) -0.19 1.17 -0.07 1.21 0.840
(a)
Change was computed by subtracting the one month value from the baseline value; positive numbers indicate an increase from baseline.
(b) P-values test null hypothesis of equivalence between intervention and control groups using two-sample Wilcoxon rank-sum (Mann-Whitney) test
56
Table 8. Clinical endpoints for patients in intervention and control groups three months post randomization
Characteristics Intervention group
n=12
Control group
n= 12 P-value
(a)
Mean Std. Dev. Min Max Mean Std. Dev. Min Max
Buffering capacity final pH 5.0 1.8 3.1 10.0 4.9 0.9 3.7 6.1 0.782
Chair-side pH 6.5 0.5 5.5 7.3 6.3 0.5 5.3 6.8 0.193
ATP (RLU) 2984.6 1655.1 780.0 5800.0 3250.8 1544.6 1605.0 5609.0 0.601
Mutans streptococci (MSB) (x 103) 237.5 395.5 2.8 1200.0 311.8 542.8 0.0 1700.0 0.902
Lactobacillus (Ragosa SL) (x 103) 170.6 366.2 0.0 1300.0 46.2 83.5 0.0 290.0 0.369
Salivary flow rate (ml/minute) 1.8 1.3 0.4 5.4 1.4 0.6 0.4 2.2 0.926
(a) P-values test null hypothesis of equivalence between intervention and control groups using two-sample Wilcoxon rank-sum (Mann-Whitney) test
57
Table 9. Change (difference from baseline) (a) in primary endpoint and other clinical endpoints, three months post-randomization
Characteristics Intervention group
n=12
Control group
n= 11 P-value
(b)
Mean
difference(b) Std. Dev. Mean difference
(b)
Std. Dev.
Buffering capacity final pH 0.80 2.28 0.06 0.73 0.339
Chair-side pH 0.04 0.54 -0.09 0.41 0.489
ATP (RLU) -1840.08 2263.85 -1161.36 2223.82 0.242
Mutans streptococci (MSB) (x 103) -431.11 1081.82 -83.63 797.48 0.806
Lactobacillus (Ragosa SL) (x 103) -682.50 2492.20 -81.18 212.65 0.902
Salivary flow rate (ml/minute) 0.28 1.51 0.16 0.93 0.877
(a)
Change was computed by subtracting the three month value from the baseline value; positive numbers indicate an increase from baseline.
(b) P-values test null hypothesis of equivalence between intervention and control groups using two-sample Wilcoxon rank-sum (Mann-Whitney) test
58
Table 10. Mean (95% confidence interval [CI]) change in buffering capacity(a) at three months from baseline, according to compliance with home care regime, intervention group (n=12) (b)
Sum of compliant
behaviors N subjects
Mean change in
buffering capacity 95% CI
0 0 -- --
1 1 -0.80 --
2 7 0.47 -0.61, 1.55
3 4 1.77 -2.24, 5.79
(a)
Change was computed by subtracting the three month value from the baseline value; positive numbers indicate an increase from baseline.
(b) Compliant behaviors were: tooth brushing 2x daily; CariFree-rinse 2x daily, use of dental floss 1x daily
59
Table 11. Correlation (a) of chairside ATP bioluminescence test (CariScreen) and salivary Streptococcus mutans count (CFU/mL of saliva) test at three time points in two treatment groups
Time Treatment group Rho P-value
Baseline Intervention 0.105 0.746
Baseline Control -0.559 0.059
One month Intervention -0.406 0.190
One month Control -0.098 0.762
Three months Intervention -0.406 0.190
Three months Control -0.098 0.762
(a) Spearman's rank-order correlation tests the null hypothesis that the ranks of one variable do not covary with the ranks of the other variable
8
APPENDICES
61
Appendix B
Adherence to Protocol Questionnaire
How often do you brush your teeth in a day
Not at all
Once
Twice or more
How often do you rinse with CariFree mouth rinse in a day
Not at all Once
Twice or more
How often do you floss your teeth in a day
62
9
REFERENCES
1. The World Oral Health Report 2003, in Continuous improvement of oral health in the 21st century - the approach of the WHO Global Oral Health Programme, World Health Organization.
2. Dye, B., et al., Trends in oral health status: United States, 1988–1994 and 1999– 2004. Vital Health Stat 2007. 11 (248): p. 1-92.
3. Petersen, P., World Health Organization global policy for improvement of oral health - World Health Assembly 2007. Int Dent J, 2008. 58: p. 115-121.
4. Selwitz, R., A. Ismail, and N. Pitts, Dental Caries. 2007: Lancet.
5. Caries diagnosis and risk assessment. A review of preventive strategies and management. J Am Dent Assoc., 1995. 126 p. 1S-24S6. Kutsch, V., C. Kutsch, and B. Nelson, A clinical look at CAMBRA. DPR 2007. 41(8): p. 62-67. 7. Featherstone, J., et al., Caries risk assessment in practice for age 6 through adult.
J Calif Dent Assoc. , 2007 35(10): p. 703-7, 710-3.
8. Featherstone, J., S. Singh, and D. Curtis, Caries Risk Assessment and
Management for the Prosthodontic Patient. Journal of Prosthodontics, 2011. 20 (1): p. 2–9.
9. Bader, J., D. Shugars, and A. Bonito, A systematic review of selected caries prevention and management methods. Community dentistry and oral epidemiology, 2001. 29: p. 399–411.
10. Pellegrini, P., et al., Plaque retention by self-ligating vs elastomeric orthodontic brackets: Quantitative comparison of oral bacteria and detection with adenosine triphosphate-driven bioluminescence. American Journal of Orthodontics and Dentofacial Orthopedics, 2009. 135(4): p. 426.e1-426.e9.
11. Sauerwein, R., et al., ATP Bioluminescence: Quantitative Assessment of Plaque Bacteria Surrounding Orthodontic Appliances, in IADR 86th General Session & Exhibition 2008: Metro Toronto Convention Centre
12. Goodacre, C., et al., Clinical complications in fixed prosthodontics. J Prosthet Dent, 2003. 90: p. 31-41.
13. Hardie, J., The microbiology of dental caries. Dent Update. , 1982. 9(4): p. 199-208.
![Fig. 2. Adapted schematic of the balance between progressive dental disease at one end and protective factors maintaining a low risk [7]](https://thumb-us.123doks.com/thumbv2/123dok_us/8328773.2208890/51.918.180.755.134.388/adapted-schematic-balance-progressive-disease-protective-factors-maintaining.webp)