© 2018, IRJET | Impact Factor value: 6.171 | ISO 9001:2008 Certified Journal | Page 1964
SVM AND RANDOM FOREST CLASSIFICATION METHODS FOR
FINGERPRINT LIVENESS DETECTION
Jeena Sara Viju
1, Sruthy S
21PG Scholar, Computer Science and Engineering, Sree Buddha College of Engineering, Kerala, India 2Assistant Professor, Computer Science and Engineering, Sree Buddha College of Engineering, Ayathil, Kerala
---***---Abstract -
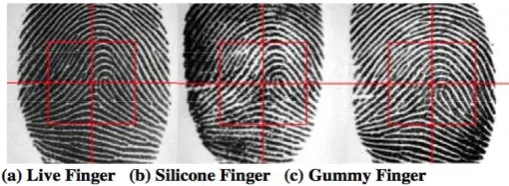
The progress in biometric systems in the recentyears leads to the importance in distinguishing a fake fingerprint from a real fingerprint. The system's security can be violated by providing a spoof physical biometric. When compared with other biometric traits, fingerprint can be spoofed easily by using certain materials like gelatin, silicon, wood glue, etc. In this paper an efficient Fingerprint Liveness Detection is proposed. Fingerprint Liveness Detection is performed by using both Support Vector Machine (SVM) and Random Forest classification methods. The detection performance is improved by using Histogram of Oriented Gradients (HoG) along with Local Binary Pattern (LBP) feature extraction method. An analysis is carried out by comparing both SVM and Random Forest Method.
Key Words: Fingerprint Liveness Detection, Support Vector machine, Random Forest, Feature Extraction, Local Binary Pattern, Histogram of Gradient.
1. INTRODUCTION
Biometrics refers to "metrics related to human characteristics". Biometric authentication is used in computer science as a part of identification, to spot individuals in groups that are under supervision. Fingerprint Identification System is the widely and frequently used biometric technique. Apart from other biometric traits like iris, face, palm, etc., fingerprint recognition is preferred due to the distinctive characteristics of fingerprint of every individual. This attribute makes it most dependable and chosen procedure amongst all other mechanisms. The fundamental intention of biometrics is to inevitably identify and distinguish threads in a genuine methodology. Biometric technology introduces many benefits over classical security methods. Spoofing is a destructive procedure in which artificial objects are presented to biometric detection system that mimics biological and behavioural characteristics. Therefore, the systems security can be violated by issuing a fake physical biometric. In specific, fingerprints can be effortlessly spoofed from materials like gelatin, silicone and wood glue.
"Fingerprints cannot lie, but liars can make fingerprints", the quote is accredited to Mark Twain and is confirming correct in many situations. Years after years technology is growing at a faster rate and people are becoming user friendly with the upgraded technology. Now a day it is not hard to find detailed explanations or instructions on how to
[image:1.595.308.563.329.422.2]develop spoofed fingerprints. Distinguishing a real fingerprint from a spoofed fingerprint is known as "Spoof Detection". Due to the vulnerabilities, many fingerprint liveness detection algorithms have been proposed and are classified into two categories: hardware and software. In the hardware approach, a particular device will be added to the sensor to recognise the properties like blood pressure, skin distortion or odor. In the software approach, features used to discriminate between real and spoof fingerprints are extracted from the fingerprint image.
Fig-1: Real fingerprints and Spoofed fingerprints
Convolutional Neural Networks (CNN) with random weights, and Local Binary Patterns (LBP), achieves reliable outcome in fingerprint liveness detection. A convolutional network consists of alternating layers of convolutional and local pooling. The target of convolutional layer is to obtain patterns found within local regions of the inputted images that are common throughout the dataset. It is performed by convolving a template over the inputted image pixels.
In this paper, a fingerprint liveness detection procedure using SVM and Random Forest classification methods is proposed to identify a real fingerprint from a spoofed fingerprint. The advantages of the system are three fold.
• No particular manual technique for the purpose of fingerprint liveness detection was used. Transfer Learning is achieved. Transfer Learning is the research problem in machine learning. The knowledge acquired while solving a specific problem will be stored and it will be applied to a different but related problem.
• Pre-trained Deep networks require less labelled data to achieve good accuracy in a new task.
• Greater accuracy is obtained.
© 2018, IRJET | Impact Factor value: 6.171 | ISO 9001:2008 Certified Journal | Page 1965 2. RELATED WORK
Nikam and Agarwal proposed several methods based on the use of statistical analysis of the fingerprint scans, particularly, they propose the use of Local Binary Patterns (LBP) along with the wavelet transform. It is known that an LBP's histogram can be a powerful texture feature and thus can be used to determine whether a fingerprint is real or fake. The same authors published several works proposing the use of Gray Level Co-occurrence Matrices (GLCMs) combined with diversified methods such as Gabor filters, wavelet transform and curvelet transform. In a recent work, Nogueira propose two different methods, one performing the feature extraction with LBP and another using Convolutional Networks (CN) for the first time in this task. The methods perform dimension reduction using Principal Component Analysis (PCA) and use a Support Vector Machines (SVM) with Radial Basis Function (RBF) kernel to perform classification. Ghiani have proposed a method for liveness detection by using Local Phase Quantization (LPQ). The LPQ is a blur insensitive texture classification method. As it is able to represent all spectrum characteristics of images in a compact feature representation, avoiding redundant or blurred information, the authors believe that it could be used in this field.
The above mentioned authors used the four data sets collected for the Second International Fingerprint Liveness Detection Competition (LivDet11) to test the algorithm. Ghiani also proposed the use of Binarized Statistical Image Features (BSIF) to detect the vitality of fingerprints. This approach has already been tested for face recognition and texture classification. Their goal is to obtain statistically meaningful representation of the fingerprint data by learning a fixed set of filters from a small set of images. They also claim that through learning, it is possible to adjust the descriptor length to the unusual characteristics of a fingerprint. Ghiani tested this algorithm with the four LivDet2011 datasets, obtaining promising results. However, there are still some problems with this algorithm, such as finding the right window size or the length of the binary string that results from the application of the filters to the image.
Manivanan proposed a method to detect pores as a sign to fingerprint vitality using only one fingerprint image then applying two filtering techniques: highpass and correlation. The main reason of using highpass filter was to extract active sweat pore, then a correlation filter was used to locate the position of pores. Recently, Johnson and Shuckers proposed a pore analysis method which still classifies the pores using their perspiration activity even if they are well represented in high quality fake fingers.
3. PROPOSED SYSTEM
Various methods are used for fingerprint liveness detection. It is very difficult to distinguish a fake fingerprint from a real fingerprint. The convolutional methods lack
accuracy. The features extracted are insufficient to perform the test. The proposed system is a new approach for distinguishing a spoof fingerprint from a real fingerprint. In the proposed system, LBP feature extraction method along with HOG feature extraction improves the accuracy. Mostly it is observed that SVM is used commonly for training and classification. Apart from SVM, in this paper the Random Forest method is also used. The system accuracy is checked by performing training and classification using both SVM and Random Forest method. It is observed that Random Forest method provides more accuracy than using SVM. The proposed system is evaluated on the datasets provided by LivDet (Liveness Detection Competition).
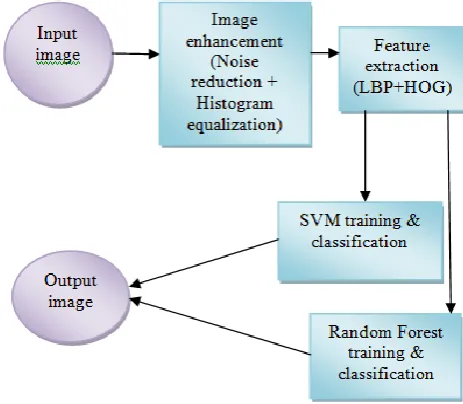
The proposed system consists of mainly four modules
Image enhancement
Feature Extraction
SVM training and classification
Random Forest training and classification
[image:2.595.322.554.369.571.2]The basic working of the proposed system is as depicted in the following figure.
Fig-2: Proposed System Architecture
3.1 Image Enhancement
The method of adjusting digital images to make the results more suitable for display is known as image enhancement and is used for further image analysis. For example, removal of noise, sharpens, or brighten an image etc.
3.1.1 Noise Reduction
© 2018, IRJET | Impact Factor value: 6.171 | ISO 9001:2008 Certified Journal | Page 1966 Generally this type of noise will only affect a small number of
image pixels. The image consists of dark and white dots when viewed, hence the term salt and pepper noise. In the proposed system, median filter is used for noise reduction.
3.1.2 Median Filter
It is a nonlinear digital filtering technique, commonly used to remove noise. A typical pre-processing step used to improve the results of later processing. Median filtering is widely used in digital image processing and the reason is that under certain conditions, while removing noise from the image it preserves edges. The main idea behind median filter is to run through the signal entry by entry, replacing each entry with the median of neighbouring entries. The steps in median filter are as follows:
1. Read a 2d image
2. Pad the matrix with zeros on all sides
3. Copy the original image matrix to the padded matrix 4. Form a window matrix of size 3-by-3 with the
elements of input matrix
5. Copy window matrix into an array and sort it 6. Find the middle element
7. Place the median element in the output matrix 8. Convert the output matrix to 0-255 range image
type
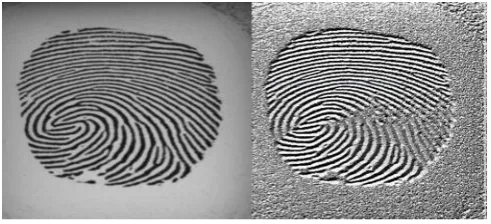
[image:3.595.48.276.429.519.2]The output after performing median filter will be:
Fig- 3.a: Input Image Fig -3.b: Noise Reduced
3.1.3 Histogram Equalization
A histogram can be defined as “a graphical representation of the distribution of numerical data”. In other words it is an estimate of the probability distribution of a continuous variable. Histogram is represented as a bar graph. To construct a histogram, firstly divide the entire range of values into a series of intervals and then count how many values fall into each interval. Histogram equalization is a method in image processing of contrast adjustment using the image's histogram. Histogram equalization can be done in three steps:
1. Compute the histogram of the image 2. Calculate the normalized sum of histogram 3. Transform the input image to an output image
3.2. Feature Extraction
This performs reducing the amount of resources that is essential to describe a large set of data. Feature extraction is
a type of dimensionality reduction and it represents all the interesting parts of an image as a compact feature vector. In the proposed system, Local Binary Pattern(LBP) and Histogram of Oriented Gradients(HOG) feature extraction methods are used.
3.2.1 Local Binary Pattern (LBP)
LBP is visual descriptor and is used for classification in computer vision. The algorithm is implemented as follows:
1. Divide the examined window into cells (e.g. 16x16 pixels for each cell).
2. For each pixel in a cell, compare the pixel to each of its 8 neighbors (on its top, middle, left-bottom, right-top, etc.). Follow the pixels along a circle, i.e. clockwise or counter-clockwise.
3. Where the center pixel's value is greater than the neighbor's value, write "0". Otherwise, write "1". This gives an 8-digit binary.
4. Compute the histogram, over the cell, of the frequency of each number. This histogram can be seen as a 256-dimensional feature vector.
5. Optionally normalize the histogram.
6. Concatenate (normalized) histograms of all cells. This gives a feature vector for the entire window.
The output after performing local binary pattern filter will be:
Fig- 4.a: Input Image Fig- 4.b: LBP Image
3.2.2 Histogram of Oriented Gradients (HOG)
It is used for object detection and is used in computer vision and image processing. HOG counts the occurrences of gradient orientation in the localized portion of the image. The importance of the method is that the appearance of object and shape within the image can be explained by the distributions of intensity gradients or edge directions. The HOG feature extraction method consists of four steps. They are as follows:
Gradient Computation
Orientation Binning
Descriptor Blocks
[image:3.595.311.557.434.546.2]© 2018, IRJET | Impact Factor value: 6.171 | ISO 9001:2008 Certified Journal | Page 1967 Gradient Computation
The computation of the gradient values is performed. Apply the 1-D centered, point discrete derivative mask in one or both of the horizontal and vertical directions.
Orientation Binning
The second step of calculation is creating the cell histograms. Corresponding to each pixel within the cell, it casts a weighted vote for an orientation based histogram channel based on the values found in the gradient computation.
Descriptor Blocks
The HOG descriptor is the concatenated vector of the components of the normalized cell histograms from all of the block regions.
Block Normalization
The equation used is
F = v / sqrt (norm (vk) ^ 2 + .001)
where v is the non normalized vector containing all histograms in a given block and vk is the k-norm for k=1,2.
3.3 Support Vector Machine (SVM) Training and Classification
SVM classifies by finding out the best hyper plane that separates all the data points of one class from those of another class. The best hyper plane will be the one with the largest margin between the classes.
3.4 Random Forest
The random forest algorithm can be summarized as follows:
1. Draw bootstrap samples from the original data.
2. For each of the bootstrap samples, grow an unpruned classification or regression tree, with the following modification: at each node, rather than choosing the best split among all predictors, randomly sample of the predictors and choose the best split from among those variables.
3. Predict new data by aggregating the predictions of the trees (i.e, majority of votes for classification, average for aggregation).
4. EXPERIMENTAL RESULT AND ANALYSIS
The experimental results of the proposed technique for fingerprint liveness detection using SVM classification is discussed in this section. An application is created using MATLAB application to implement this technique.
4.1 Results
[image:4.595.307.560.270.403.2]The algorithm discussed above is implemented using MATLAB R2013a. In the proposed method implemented by using many modules and sub modules, the input image is a fingerprint image. Based on this input image, the system works and finally produces a result whether the given image is spoof or real. In the first module, image enhancement is performed by noise reduction and histogram equalization. Features of the images are found by LBP and HOG in the second module. SVM training is performed on the dataset in third module. Finally, in the fourth module SVM classification is performed and the input image is identified as either fake or real. The following represents the final output of the system.
Fig -5: Output of the proposed system
4.2 Analysis
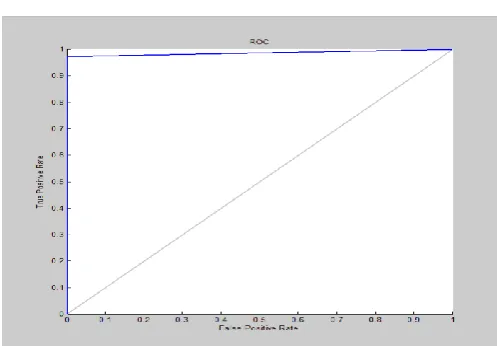
The analysis of the proposed system is performed on the basis of accuracy. Accuracy is computed by comparing the results obtained with the ground truth images. The analysis is performed by using two classification methods- SVM classification and Random Forest Classification method. The SVM classification works as mentioned in module four of the proposed system. The Random Forest on the other hand is described below. The accuracy obtained by SVM is 93.05 and for Random Forest is 97.22. The graph for SVM classification(1) and Random Forest(2) is shown below.
[image:4.595.303.560.592.743.2]© 2018, IRJET | Impact Factor value: 6.171 | ISO 9001:2008 Certified Journal | Page 1968 Fig-5.2: Graph for Random Forest
5. CONCLUSION
SVM classification for fingerprint liveness detection to distinguish spoof fingerprints from real fingerprints is presented in the proposed system. The main goal of this method is that to perform liveness detection and also to compare SVM and Random Forest method. The conventional methods have low accuracy and feature extractions may not be sufficient for performing the test. Proposed system introduced the SVM classification, which is a supervised learning method for the detection. LBP along with HOG feature extraction improves the performance of the proposed system. With the analysis performed, it is observed that Random Forest will be a better method than SVM since it has greater accuracy in the analysis when compared with SVM. This also opens new possibilities for future work, including:
Design a fingerprint liveness detection using Random Forest
REFERENCES
[1]. Rodrigo Frassetto Nogueira, Roberto de Alencar Lotufo, and Rubens Campos Machado, “Fingerprint Liveness Detection Using Convolutional Neural Networks”, In IEEE Transactions On Information Forensics And Security, Vol. 11, No. 6, June 2016
[2]. V. Mura, L. Ghiani, G. L. Marcialis, F. Roli, D. A. Yambay, and S. A. Schuckers, “Livdet 2015 fingerprint liveness detection competition 2015,” in Proc. IEEE 7th Int. Conf. Biometrics Theory, Appl. Syst., Sep. 2015, pp. 1–6.
[3]. J. Galbally, F. Alonso-Fernandez, J. Fierrez, and J. Ortega-Garcia, “A high performance fingerprint liveness detection method based on quality related features,” Future Generat. Comput. Syst., vol. 28, no. 1, pp. 311–321, 2012.
[4]. Y. Chen, A. Jain, and S. Dass, “Fingerprint deformation for spoof detection,” in Proc. Biometric Symp., 2005, p. 21.
[5]. B. Tan and S. Schuckers, “Comparison of ridge- and intensity-based perspiration liveness detection methods in fingerprint scanners,” Proc. SPIE, vol. 6202, p. 62020A, Apr. 2006.
[6]. P. Coli, G. L. Marcialis, and F. Roli, “Fingerprint silicon replicas: Static and dynamic features for vitality detection using an optical capture device,” Int. J. Image Graph., vol. 8, no. 4, pp. 495–512, 2008.
[7]. P. D. Lapsley, J. A. Lee, D. F. Pare, Jr., and N. Hoffman, “Anti-fraud biometric scanner that accurately detects blood flow,” U.S. Patent 5 737 439, Apr. 7, 1998.
[8]. A. Antonelli, R. Cappelli, D. Maio, and D. Maltoni, “Fake finger detection by skin distortion analysis,” IEEE Trans. Inf. Forensics Security, vol. 1, no. 3, pp. 360–373, Sep. 2006.
[9]. D. Baldisserra, A. Franco, D. Maio, and D. Maltoni, “Fake fingerprint detection by odor analysis,” in Advances in Biometrics. Heidelberg, Germany: Springer, 2005, pp. 265– 272.
[10]. A. K. Jain, Y. Chen, and M. Demirkus, “Pores and ridges: Highresolution fingerprint matching using level 3 features,” IEEE Trans. Pattern Anal. Mach. Intell., vol. 29, no. 1, pp. 15– 27, Jan. 2007.
[11]. D. Gragnaniello, G. Poggi, C. Sansone, and L. Verdoliva, “Fingerprint liveness detection based on weber local image descriptor,” in Proc. IEEE Workshop Biometric Meas. Syst. Secur. Med. Appl. (BIOMS), Sep. 2013, pp. 46–50.
[12]. D. Gragnaniello, G. Poggi, C. Sansone, and L. Verdoliva, “Local contrast phase descriptor for fingerprint liveness detection,” Pattern Recognit., vol. 48, no. 4, pp. 1050–1058, 2015.
[13]. R. F. Nogueira, R. de Alencar Lotufo, and R. C. Machado, “Evaluating software-based fingerprint liveness detection using convolutional networks and local binary patterns,” in Proc. IEEE Workshop Biometric Meas. Syst. Secur. Med. Appl. (BIOMS), Oct. 2014, pp. 22 29.
[14]. D. Menotti et al., “Deep representations for iris, face, and fingerprint spoofing detection,” IEEE Trans. Inf. Forensics Security, vol. 10, no. 4, pp. 864–879, Apr. 2015.
BIOGRAPHY