Munich Personal RePEc Archive
Why Guyana’s self discovery is the
missing link in its development strategy
constantine, collin
University of Guyana
January 2013
Online at
https://mpra.ub.uni-muenchen.de/44205/
WHY GUYANA’S SELF DISCOVERY IS THE MISSING LINK IN ITS DEVELOPMENT
STRATEGY
Collin Constantine1
University of Guyana
ABSTRACT
The paper attempts to indentify the constraints to growth in Guyana using the Hausmann et al (2005) methodology. Although
Guyana suffers from low domestic savings and high interest rate spreads, the paper argues that high cost of finance is a
non-binding constraint on entrepreneurial activity. The paper concludes that market failures such as information externalities is a
binding constraint on growth in Guyana. It explains the country’s static economic structure and why the composition of its
export basket has not changed in 46 years. The paper recommends non-competitive policies to stimulate structural
transformation and to internalise the information externalities.
Keywords: Economic Growth, Growth Diagnostics, Information Externalities, Imperfect Competition.
JEL classification: O40, O11, O12.
1 I thank Tarron Khemraj, Sharon Roopchand-Edwards and Dhanraj Singh for their guidance and comments on earlier versions of this essay. I also extend gratitude to my colleagues who had been
1. INTRODUCTION
The process of development has primarily been about structural/sectoral change (Lewis 1954, Kaldor 1966,
Chenery and Taylor 1968 and Rodrik 2004), which encompasses the production of new goods/services
with new technology and moving from traditional economic activities to new ones. This process entails
information and coordination externalities (Rodrik 2004) and requires credit into economic ventures that
are non-existent and new; creating an environment that may prove to be too risky for private lenders.
Information externalities reduce the private appropriability of economic returns in a new business activity
(that was discovered by an entrepreneur) by providing valuable information to competing entrepreneurs
about the profitability of the new economic venture. This information spillover facilitates market entrants
as other entrepreneurs seek to capitalize on the newly discovered enterprise. This competitive environment
erodes the economic rents from the discovery of any new business activity.
If one were to consider the early years of Guyana’s taxi industry for instance, one would realise that it was
less competitive and more lucrative than it is at present. Although this surge in competition is beneficial to
the end user, it would certainly leave an adverse impression on those entrepreneurs who risked their capital
at the genesis of the industry, only to witness the growth of an industry (due to market entrants who
benefited from the information externalities) that offers little rent. When this happens often enough with
different industries and discoveries, entrepreneurs have insufficient incentive to seek out new business
activities. Further, ventures into new industries will require the training of human capital that would be free
to move to competitors and copycats. Any businessman who contemplates diversification or the risk of
new investment is soon discouraged and abstains from investment– thus, if the market is left to its own
devices economic development through structural transformation would be elusive. This paper defines
structural transformation as sectoral change into higher value added production and uses structural and
The author contends that it is information externalities that bind entrepreneurial activity in Guyana and
results in a static economic structure and export basket. This is Guyana’s greatest threat to its national
security as its foreign exchange earners are commodity goods, which have been battered in world markets,
save and except for gold. The paper sets out to answer two fundamental questions: what is the binding
constraint to private entrepreneurship in Guyana? And what policies could be pursued to stimulate
structural transformation?
Hausmann et al (2006) conclude that a country’s exports matter since it has significant implications for its
growth prospects and the rate of structural change in its economy. Hidalgo et al (2007) emphasized the
importance of a country’s productive structure within the context of the product space2. Structural
transformation is easier for countries that produce within the dense part of the product space because at
this point there is a wide range of goods that could be produced with similar capabilities or existing
technologies. On the contrary, if a country’s exports are situated on the periphery3 of the product space,
then the redeployment of existing capabilities to other products is difficult, since existing technologies have
few auxiliary uses. It is at this periphery that Guyana’s productive base is located.
The researcher calculates the Herfindahl index for Guyana’s export basket and finds that it is highly
concentrated since 1973-2011. Only in the year 2000 was its export portfolio considered moderately
concentrated. Its export basket is made up of natural resources (gold, bauxite and diamonds) and other
commodity products such as rice and sugar.
The literature on structural change simply features the growth implications of what a country produces and
exports. Fast growing countries such as: China, Singapore and those in South East Asia all produce goods
that are densely populated within the product space. And although the colonial origins and the natural
2 A network representation of the relatedness and proximity of goods traded in the global economy. Countries that produce
within the dense part of the product space must necessarily have advanced capabilities and technologies that could further produce other similar goods nearby the product space that utilises basically the same technologies. Thus, structural change is easier and the production of goods associated with higher productivity levels are more realistic.
3 The peripheral part of the product space consists mostly of commodity products (which are associated with lower per capita
endowments of a country determine to a large extent the degree of specialisation of a nation, policy
intervention aimed at correcting the right market failures would allow a nation to make transformative
changes to the structure of its economic base.
The Hausmann, Rodrik and Velsaco (HRV) Growth Diagnostics Framework (Hausmann et al 2005) was
used to determine the principal constraint to private investment at this juncture of Guyana’s growth story
and it reveals that low levels of self discovery has significant explanatory power for Guyana’s stationary
economic structure and export portfolio. Poor self discovery is a direct consequence of information
externalities as the social gains exceed private rewards for the discovery of new economic activities in a
competitive environment.
Although the HRV framework is usually an analytical approach to determine the impediments to growth
acceleration (a short run occurrence), in Guyana’s particular case, correcting for the information
externalities is both a short and long run solution to Guyana’s growth story. Higher levels of self discovery
will allow domestic market niches to be filled and new sectors to be developed (short run), which facilitates
the growth of a wider range of potential exportables – this will reduce the country’s external vulnerability
through export diversification (long run). The colonial origins of Guyana could explain why its productive
technologies are at the periphery of the product space and its socialist past explains why individuals in
society were not involved in self discovery. This history is a burden on the country’s development
aspirations as technologies, culture and institutions are not easily changed to facilitate private sector growth.
Hausmann and Rodrik (2003) identifies the subsidization of the first investor in a new business activity as a
way to internalize the information externalities, and allow copycats that follow to brave the economic
realities of the new market on their own. This subsidization is to compensate the investor for the social
service of information provision (via information externality) that is inevitable in the process of self
discovery. However, poor and developing states can rarely afford continuous subsidization at early stages of
Temporary monopoly rights over the production of a newly discovered good/service (a new commodity in
the product space that could be produced profitably in Guyana) will generate sufficient incentives for
private sector interests to get involve in self discovery. This is done through cost discovery, which requires
entering the production process to determine the profitability of a particular venture. Temporary monopoly
rights is an attempt to reward private interest for taking risk as the discovery of a profitable venture is no
guarantee in the cost discovery process. The rationale behind this is that an economic agent would engage
in cost discovery and its accompanying risks, if they are afforded sufficient time to recover their
investments and extract abnormal profits. Thus, a country’s production function is determined by its
natural endowments and the number of entrepreneurs involved in cost discovery (Hausmann et al 2006).
Great emphasis on competitiveness policy is seen as essential to the prevailing development agenda since
productivity and efficiency is enhanced with improved competition. In 2006, Guyana’s parliament passed
the Competition and Fair Trading Bill which protects domestic competition. This paper delineates how
strong support for competitiveness policy is indeed growth enhancing for established industries through the
channels of increased productivity and efficiency. But is argues that commitment to competition will stifle
structural transformation and perpetuate Guyana’s external vulnerability. These policies do little to jolt
entrepreneurial ingenuity into new and emerging sectors even if the coordination problems are resolved in areas
where Guyana has potential. The paper draws a clear distinction between the necessity of competitiveness
policy for the strengthening of established industries and the need for monopoly/oligopoly profits for the creation of
new ones.
Feasibility studies are required before any investment is made into a new sector and economic agents may
be unable or unwillingly to undertake any comprehensive study. This poses a significant threat to the self
discovery process. Information externality explains why private sector interest would be unwilling to
embark on feasibility studies and the paper recommends that the state undertakes this responsibility, which
The remainder of the paper is organized as follows. Section 2 presents the methodology used and section 3
describes Guyana’s growth story which motivates later sections. Section 4 outlines the growth diagnostics,
while section 5 concludes and offers recommendations.
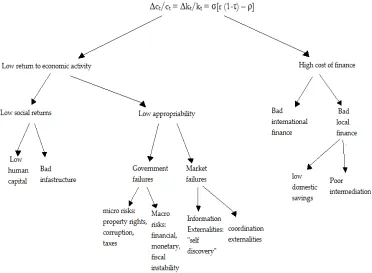
2. METHODOLOGY
The Researcher employs the Hausmann et al (2005) growth diagnostics framework to determine the most
binding constraint on entrepreneurial activity in Guyana. The HRV model defines growth as a function of
the expected returns to capital accumulation and the cost of accumulation (interest rate). The following
model4 illustrates this:
g= ∆ct/ct = ∆kt/kt= σ[r (1-τ) – ρ]
Where g is the rate of growth, c and k are consumption and capital per capita respectively, r is the expected
rate of return, τ is the tax5 on capital,
σ is elasticity of intertemporal elasticity in consumption and ρ is the
opportunity cost of capital (world interest rate). The model above explains that the rate of return to capital
accumulation depends on its cost (ρ) and the amount of returns that are privately appropriated (1-τ). This
explains why the growth diagnostics decision tree (see figure 1) depicts high cost of finance and low return
to economic activity as the two principal sources of low levels of private investment.
If a country has a multitude of investible ideas where private returns could be satisfactorily appropriated but
growth is less than sterling, the HRV growth model argues that high cost of finance is the binding
constraint. The decision tree helps the analyst determine which particular distortion increases the cost of
finance and causes it to be binding. Conversely, the cost of capital accumulation could be low in a
particular country, yet growth is elusive. In this scenario the HRV model posits that low return to economic
activity is the binding constraint to economic growth. Again, the decision tree assists the researcher to
4 The model was adopted from HRV 2005
5 This tax could be explicit and implicit; the latter includes corruption and/or poor protection of property
determine whether economic returns to investment are low because of poor appropriability or simply
because social returns are low.
The growth diagnostics framework begins with the description of the growth story of a particular country
and the formation of a relevant question to be answered using the HRV model. The diagnostic approach
involves going down the decision tree by asking whether high cost of finance could explain low levels of
private investment. Careful analysis of the evidence should highlight which particular distortion (e.g. bad
international finance or low domestic savings etc) causes this constraint to be binding. This is determined
through a differential diagnosis that will be discussed below. If this constraint proves to be non-binding
then the analyst would move to the other branch of the decision tree and follow the same procedure.
The differential diagnosis (Hausmann et al 2008) is the procedure used to determine whether a particular
problem or constraint is of a binding nature. It identifies four primary principles of a binding constraint: a
high shadow price (e.g. if poor savings is a binding constraint high deposit rates should be evident),
relaxation of the constraint should be growth intensive, economic agents should attempt to bypass or
overcome the constraint and economic agents less intensive in the constraint should be the ones who are
more likely to thrive and vice versa.
The idea of removing the most binding constraint to accelerate growth comes from the investigation of
Hausmann et al (2004). They discovered eighty-three instances of growth accelerations6 in the world
between 1957-1992 and concluded that only small policy changes preceded each acceleration. They posited
that these small policy changes relaxed the most binding constraint to economic growth in each particular
country. The paper goes on to explain that wider and comprehensive policy changes are required to sustain
economic growth, a stark difference to the ingredients of growth acceleration (small policy changes).
Figure 1: HRV Growth Diagnostics Decision Tree
3. GUYANA’S GROWTH STORY
Much of Guyana’s growth history could be divided into three periods: a socialist period with monumental
nationalisations, rampant growth decline and stagnation and liberalisation of markets and trade along with a
democratic political economy.
Guyana was a sugar colony and much of its history could be analysed within the context of sugar and
bauxite. These were its major exports up until 1979. In 1970, Guyana adopted socialist policies as part of its
development agenda and it was during the 1970s that the world suffered from an oil price shock, from
which Guyana suffered immense losses. During its first period which included independence (1966),
Guyana had nationalized both its sugar and bauxite industries in 1975 and 1976 from foreign ownership.
During the second period between 1976 and 1988, Guyana’s growth story becomes a dim one. State
controlled policies intensified with extensive price controls and further nationalisations. As a consequence
the size of the underground economy increased to unprecedented numbers, 62.7% of Gross Domestic
Product (GDP) as estimated by Faal (2003). This period was also characterized with massive debt build ups,
labour strikes and shortages of basic necessities. In 1988 the government of the day launched the Economic
Recovery Program (ERP) and was voted out of office in 1992, by the new government, Peoples Progressive
Party/Civic (PPP/C), who continued the ERP agenda. Massive and extensive market liberalization took
place and positive growth ensued.
The period of 1992-1997 was the longest period of positive growth in Guyana, and then growth collapsed
post 1997. Growth averaged 7.1% during this period and plummeted to 0.1% between 1998-2006.
Weisman (2003) sought to determine why growth had collapsed post 1997 in Guyana and concluded that
massive government debt, deficits and adverse terms of trade were the constraints to continued growth.
Another interpretation surfaced by Staritz et al (2007), who contended that political instability, crime and
poor rates of foreign and domestic investments are the reasons for the growth decline. However, research
done by Faal (2003) sought to determine the size of the underground economy in Guyana between 1989 –
2000 and found that 51.6% of business activity was not part of the official economy. After the liberal
reforms that started in 1988, this statistic declined to 35.3% during 1995-2000, indicating that Guyanese
were now willing to participate within the legitimate parts of the economy. This could be on account of the
change in government policy to more market friendly arrangements and private sector interests. This
becomes critical as part of Guyana’s growth analysis because it turns the investigation of Guyana’s growth
success (1992-1997) on its head, since there was a simultaneous decline in the underground economy,
indicative of better recording of growth data and not necessarily growth.
However, Guyana benefited from debt relief in 2006 and it was this year that it rebased its GDP from 1988
now considered a lower middle income country (LMC). In 2007 gold prices skyrocketed and instigated a
massive gold rush in the country with unprecedented production levels making gold Guyana’s number one
export to date.
It is worthy to note that the greatest exodus of human capital in Guyana was during the period 1976-1988,
which coincides with economic contractions and stagnation. This extensive and continuous human capital
flight is of no surprise since this period was one of shortages of basic necessities, accumulation of debt and
economic decline. Mishra (2006) concluded in his paper that migration rates for the tertiary educated in
Guyana was 89%, with 86% going to the United States of America, indicating the continuation of human
capital flight..
The international finance component of Guyana’s growth history was made up of a fixed exchange rate
regime until the market liberalisation policies in 1988. The implementation of the ERP dismantled the fixed
exchange rate regime to freely floating and eliminated interest rate controls on deposits and loans. Khemraj
(2008) pointed out that at the end of the year 2006 in Guyana, 90% of total banking assets were owned by
the largest three banks out of a total of six. The author elucidates that the oligopolistic nature of the
banking industry is because of the smallness of Guyana’s real economy, which causes banks to place a high
mark up on their lending rates and as a consequence decrease the demand for loans. High risk investments
the paper added is an additional reason for the high mark up of lending rates over deposit rates.
Throughout much of Guyana’s growth history interest rates spread had been on the rise until it flattened
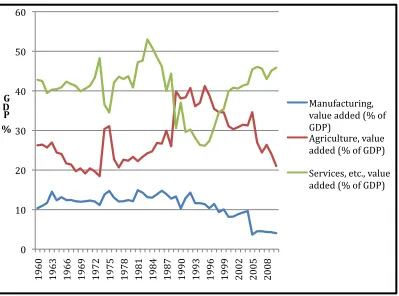
Figure 2: Guyana’s Economic Structure (1960-2008)
Figure 2 above illustrates Guyana’s economic structure from 1960-2008 and it quickly becomes obvious
that the economy has undergone little to no structural change. Though the services sector had a notable
decline in 1993, the sector rebounded in 2008. Both the agricultural and manufacturing sectors declined
from their 1960 levels, the services industry is the only sector that exhibits an increase from its 1960 level.
An obvious question is why has Guyana undergone such little structural change? The goal of this paper is
to answer this question using the Growth diagnostics approach.
The services sector activities in Guyana are non-exportable and are mostly trading services (wholesale &
retail). Construction is an increasing sector followed by the information, communication and technology
sector and transportation and storage. Though services are the biggest component of Guyana’s GDP it is
the slowest growing sector, and much of Guyana’s growth is accounted for within the mining and quarrying
industries.
0 10 20 30 40 50 60
1960 1963 1966 1969 1972 1975 1978 1981 1984 1987 1990 1993 1996 1999 2002 2005 2008
G D P %
Manufacturing, value added (% of GDP)
Agriculture, value added (% of GDP)
4. GROWTH DIAGNOSTICS
4.1 Poor Savings
Following the Second World War, poor growth performance in the newly independent nations was
attributed to low domestic savings. Development theorists argued that the opening of markets to foreign
direct investment and acquiring loans could close the savings gap and manifest itself in rapid growth. Could
poor growth performance in Guyana be explained by low domestic savings?
If we assume that the returns to domestic investments are high and that the only thing that binds
investment is poor savings, then for the savings story to be plausible, we should expect to see high deposit
rates offered in Guyana’s banking system. The economy should be willing to reward savings at
exceptionally high rates since the supply of investible funds are scarce. Further, the interest rate spreads are
expected to be low. The case in Guyana tells a different story as interest rate spreads are high and deposit
rates are low. Figure 3 below illustrates this, where LR, DR, and SPREAD are lending rates, deposit rates
[image:13.612.146.472.475.675.2]and interest rate spread respectively.
Figure 3: Interest rates and Interest rate spread for Guyana (1974-2010)
From the mid 1970s to 2010 the current account balance as a ratio to GDP has experienced a tremendous
decline, although still in deficit – an indication of fewer external borrowing. In fact, this matches the sterling
0 5 10 15 20 25 30 35 40
1974 1977 1980 1983 1986 1989 1992 1995 1998 2001 2004 2007 2010
DR
LR
decline in external debt stocks as a ratio to Gross National Income (GNI) from levels as high as 800% of
GNI to less than 100% in 2010. These noteworthy improvements relax any constraint finance would have
in the development process and certainly does not harm a country’s international credit rating or
perceptions of investment climate. Poor access to international finance would strengthen the point that low
domestic savings increase the costs of domestic finance and as a consequence binds growth. But this
argument falls short as workers’ remittances to Guyana is as high as 13% and foreign direct investment
averaging approximately 12% of GDP, which by far offsets the decline in domestic savings. The case for
bad international finance is simply not plausible in Guyana. Qayyum et al (2008) explained that the
following criteria must be met if poor domestic savings were indeed a binding constraint on private sector
investment:
‐ High foreign debt and large current account deficit
‐ Greater willingness to remunerate savings through high interest rate to depositors
‐ Any exogenous increase in investible funds, foreign investment, aid or remittances will primarily
push investment and other productive economic activities rather than fuel consumption or
investment in real estate.
A careful reading of the evidence above would reveal that Guyana’s debt and current account deficits had
declined tremendously in recent years – an indication of prudent macroeconomic management. As
indicated by figure 2 above, savers are remunerated at extremely low rates of interest (1.73% at the end of
August 2012), and there has been a surge in consumption post 2006 and investment in real estate. Thus,
according to the criteria outlined in Qayyum et al (2008), Guyana’s poor domestic savings is not a binding
constraint to private sector entrepreneurship.
If one were to increase domestic savings would Guyana’s economy experience notable improvements in its
investment function? The answer has to be yes if the case of poor savings to high borrowing costs is to be
confirm this story and in fact argues that there is little relationship between savings and investment in
Guyana (see figure 4 below where GS and PRIVN are gross savings as a ratio to GDP and private
investment as a ratio to GDP respectively). These observations indicate that investment levels are less than
desired not because of the inability of the economy to mobilize investible funds, but perhaps because of
low returns to investment and higher utility for consumption.
Even if one were to ignore the entire analysis above, a case of poor savings as a constraint to private sector
investment would still be difficult to make as the banking system in Guyana is flushed with excess liquidity.
Khemraj (2008) explains that the excess reserves persist because banks in Guyana have a minimum rate of
interest where excess reserves and interest earning loans become perfect substitutes. He estimates this rate
to be approximately 16% and contends that it is a function of transaction costs, borrower specific risk
premium and a mark-up equivalent to a suitable foreign interest rate.
He argues that at any rate above this minimum rate banks will choose to lend and reduce their excess
reserves, but as rates approach this minimum rate they will choose to hold excess reserves. This position is
a forced one, however, as excess reserves in the banking system falls when foreign currency is available in
the economy to facilitate foreign investment by banks. The Central Bank of Guyana purchases most of the
foreign currency within circulation to ensure that it has sufficient import cover and creates a foreign
currency shortage that causes banks to postpone their foreign investment, hence the excess reserves. Thus,
foreign assets are preferable to Guyana based banks over local assets. This could explain the non-existent
relationship between savings and private investment, and sheds light on why increases in domestic savings
would most likely find its way into vaults as opposed to interest earning loan assets. Additionally, it could
explain why banks offer savers low interest rates, since banks have excess reserves there is little reason to
reward increased savings. In fact, they might even begin to charge savers a fee for banking their money!
This minimum rate hypothesis as it is known is a consequence of the oligopolistic nature of the banking
on an alternative explanation of the high cost of finance in Guyana – poor financial intermediation, to
[image:16.612.146.473.159.352.2]which we now turn.
Figure 4: Gross Savings vs. Private Investment as a ratio to GDP (1961-2009)
4.2 Financial Intermediation
Just as high deposit rates and low interest rate spreads indicate lack of liquidity (poor savings) as a binding
constraint to investment, high interest rate spreads would be the first indication of problems with financial
intermediation. Figure 3 above highlights this divergence between deposit and lending rates and is
consistent with Khemraj’s (2008) contention.
‐15 ‐10 ‐5 0 5 10 15 20 25 30 35 40
0 10 20 30 40 50 60
GS
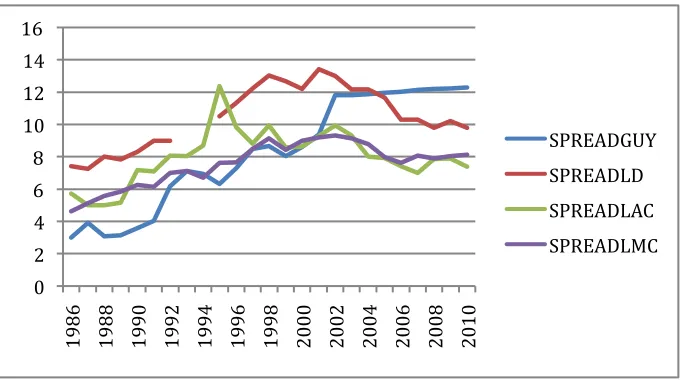
Figure 5: Comparison of interest rate spreads for GUY, LAC, LDC and LMC
(SPREADGUY – Guyana interest rate spread, SPREADLAC – LAC interest rate spread, SPREADLD – Least developed countries interest rate spread and
SPREADLMC – LMC interest rate spread).
Figure 5 depicts the movement of the interest rate spreads for Guyana, the Least Developed countries,
Latin America and the Caribbean (LAC) and Lower middle income (LMC) countries. In 1983, Guyana had
the lowest spread and in 2010 the highest above the entire said regions, at a rate of 12.3%! High spreads
could be indicative of high transaction costs, high risk or high profits and high taxation on financial
intermediation. But ultimately, if high interest rate spread is the underlying reason for poor private
investment, then reductions in these spreads would result in massive movement in the investment function
and emanate itself in increased investment.
The spreads could fall because of a decline in lending rates or an increase in deposit rates. The latter is
unlikely because banks already have excess funds on their hands and would have little reason to raise
deposit rates to attract higher savings. Therefore, a reduction in the spreads is only possible with a decrease
in lending rates. It is important to note that even if a bank’s transaction costs and reserve required ratios
were to substantially decline, lending rates could remain substantially higher than deposit rates if the risks
banks face are incredibly high or if the spreads perpetuate banks’ abnormal profits.
0 2 4 6 8 10 12 14 16
1986 1988 1990 1992 1994 1996 1998 2000 2002 2004 2006 2008 2010
SPREADGUY
SPREADLD
SPREADLAC
What then would be the impact on private investment if the wedge between deposit and lending rates were
to narrow? Figure 6 below illustrates the relationship between lending rates (LR) and private investment as
a ratio of GDP in Guyana (PRIVN) for the period 1974-2010. Since the relationship is a positive one, any
reductions in the lending rate would result in a subsequent decline in private investment. This contradicts
the well established negative relationship between interest rate and investment. Khenmraj (2008) minimum
rate hypothesis could explain this anomaly as interest rates rise above 16%, banks reduce their excess
[image:18.612.127.491.294.477.2]reserves and vice versa – a reduction in excess reserves is equivalent to increased lending and investment.
Figure 6: Lending rate vs. Private Investment as a ratio of GDP
Thus, if the high interest rate spread is a binding constraint to private entrepreneurship, then reductions in
the lending rates should accompany improvements in investment, but the evidence does not support this.
Khemraj (2008) depicts the deviation of Guyana’s interest rates from the natural rate of interest which
equilibrates the desired savings and investment in the loanable funds model of interest rate determination.
The banks mark-up rate and a risk premium would result in a rate equivalent to r2 in figure 7 below and
result in I2 level of investment, below the optimal level of I*. The analysis above explains why the lending
rate would not decline to the natural rate of r* and why such reductions, even if it were possible would not
result in greater investments. What then binds investment if not the high cost of domestic finance? Or
alternatively, how can higher levels of private entrepreneurship be achieved? Using the diagrammatical
0 5 10 15 20 25 30 35 40
0 10 20 30 40 50 60
LR
analysis below (figure 7), it is easy to see why an outward shift in the investment demand function (D) could
[image:19.612.168.388.155.366.2]increase investment, so what prevents such a shift is perhaps low returns to economic activity.
Figure 7: Diagrammatical depiction of Savings and Investment
4.3 Low Appropriability
Could it be that excessive taxation is the binding constraint on private investment in Guyana? In 2010 the
Global Competitiveness Report ranked tax rates as the number one most problematic factor for doing
business in Guyana, but this rank was dropped to number three in 2012. Prior to 2011, the corporate tax
rate was 45% and subsequently declined to 40% and the income tax threshold annually increases and
averages $250.00 USD per month in 2012. Increases in the income tax threshold acts as a reduction in tax
rates since it reduces the taxable income. Further, Guyana’s total tax rate (% profit) of 36.1% is lower than
both the Organization of Economic Cooperation and Development (OECD) and Latin American countries
according to the World Bank Doing Business Report 2012. Although this analysis casts doubt on the
excessive taxation story, there is significant room for improvement in tax collection and harmonization in
4.4 Weak Institutions?
Kaufmann et al (2010) measures six dimensions of institutional quality and ranks them from 0-100
percentile, these include: voice and accountability, rule of law, control of corruption, government
effectiveness, political stability and regulatory quality. When Guyana was compared to the rankings of the
average of middle income countries in 2010, it was performing better than its peers in three indicators
(voice and accountability, government effectiveness and rule of law). Lower middle income countries
averaged 38.3 for political stability while Guyana scored 33.5, for regulatory quality Guyana ranked 28 and
the lower middle income countries averaged 34.1 and for control of corruption Guyana lags behind and
scored 33.2 while the LMC scored 34.3. These comparisons tell a compelling story of the improvements in
the quality of Guyana’s institutions. Although the gap between Guyana and the LMC is sizeable for political
stability and regulatory quality, LMC only have a narrow margin over Guyana for the control of corruption.
In fact these improvements coincide with the Heritage Foundation’s rating of Guyana as mostly unfree in
2012, an improvement from 2008-2011 when Guyana was considered as repressed.
Institutional strength is critical for growth and private investment because they improve the expected
appropriability of private returns. The Washington Consensus and the governance agenda of the World
Bank and other International Financial Institutions place high premiums on improving institutional quality
as new evidence emerges about the positive role institutions play in the growth process. Among these
institutions protection of property rights is seen as the one essential to ensure market efficiency and provide
sufficient incentive for the private sector to undertake business activities.
The International Property Rights Index (IPRI) seeks to compute an aggregate measure of how strongly a
country protects private property, a measure of 0 indicates the absence of protection and a measure of 10
means full protection of private property. The aggregate measure has three components: legal and political
environment (LP), physical property rights (PPR) and intellectual property rights (IPR). Guyana’s IPRI
and Caribbean of 4.57, it’s quite impressive. Guyana lags behind North America and Western Europe who
scors 5.23 and 5.19 respectively. Thus, it would be difficult to make the case that the poor protection of
property rights binds private investment in Guyana, especially since the LAC has a healthier growth story
and a lower IPRI grade.
The case for the protection of private property can be equally applied to the control of corruption – as
corrupt government officials could fast track government procedures in exchange for money and this will
increase transaction costs for the private sector and as a result reduce the amount of profits that they could
appropriate. Transparency International Corruption Perception Index 2012 ranks Guyana 133rd out of 176
countries and labels Guyana as the most corrupt country in the English speaking Caribbean. Figure 8 below
illustrates the annual change in the Kaufmann, Kraay and Masruzzi indicators from 1996-2011 and it is
[image:21.612.102.518.409.666.2]evident that the control of corruption has been deteriorating.
Figure 8: The annual change of Kaufmann, Kraay and Masruzzi indicators for Guyana (1996-2011)
The Global Competitiveness Index Report of 2012 ranks corruption as the number two most problematic
factor for doing business in Guyana. But the extent to which this binds growth depends on how growth
responds to the steady decline in the control of corruption post 2003. The evidence tells a different story
since positive and continued growth has returned to Guyana since 2006, while the control of corruption has
being deteriorating – this does not mean one must ignore such weakening in this institution as it could
become binding in the future!
Guyana’s constitution bestows enormous power to the president of Guyana as he/she is protected from
prosecution for crimes committed in office. The constitution ensures that a winner takes all, which explains
why the combined opposition who has majority in parliament was unable to form a government. This
constitution is hardly sensitive to the social dynamics of this multicultural society and certainly would
engender less than stable societies. The constitution needs to be amended to be more inclusive, but given
these constraints the country was still able to grow during 1992-1997 and post 2006. Something else must
be binding.
4.5 Macroeconomic Stability
A stable macroeconomic environment had long been established as a precursor for accelerated and
sustained growth – could macro risks prove to be binding constraints in Guyana? The answer is a definitive
no, although it certainly was a constraint in the late 1970s and during the 1980s in Guyana. But since the
implementation of the Economic Recovery Program in 1989, Guyana has gotten its macroeconomic
fundamentals in order. Inflation rates are low in their single digits and the Global Competitiveness Report
2012 records it as 3.7%.
Guyana was once considered a highly indebted poor country and actually defaulted on its debt in 1982
during the Third World Debt Crisis, however, in 2006 Guyana benefitted from the Multilateral Debt Relief
Initiative that resulted in massive debt write offs. As of 2011 Guyana’s domestic bonded debt and external
public debt were 20.9% and 46.2% of GDP respectively. Although Guyana’s Current Account balance is in
deficit, as a ratio to GDP in 2011 it is much smaller when compared to Guyana’s history as can be seen in
exchange rate. Although over the years the exchange rate has depreciated, it has been stable in recent years
[image:23.612.147.472.159.351.2]at $202GY to $1 USD – this is also evident in figure 10 below.
Figure 9: Guyana’s Current account balance as % of GDP
Figure 10: Guyana’s Official exchange rate (LCU per US$, period average)
Over the last five years Guyana had experienced positive growth even in light of the global financial
meltdown, this is noteworthy as many Caribbean countries are still struggling to recover from their hard hit
tourism sector. The government of the day boasts of its prudent macroeconomic management and the
‐40 ‐35 ‐30 ‐25 ‐20 ‐15 ‐10 ‐5 0
1977 1979 1981 1983 1985 1987 1989 1991 1993 1995 1997 1999 2001 2003 2005 2007 2009
0 50 100 150 200 250
[image:23.612.147.471.409.595.2]International Monetary Fund (IMF) often joins this chorus of praise. The question then is, why hasn’t
growth been sustained with such prudent macro management?
4.6 Political Economy
Many of Guyana’s economic and social problems are plagued with political overtones as a consequence of
deep rooted social cleavages. The two major political parties predominantly represent two major ethnic
groups – Afro and Indo Guyanese. An extensive survey of this history is beyond the scope of this paper,
but what is imperative to note is that in 1992 the predominantly Indo Guyanese party (PPP/C) took office
for the first time since 1953 through free and fair elections. Up until November 2011, the PPP/C enjoyed
the parliamentary majority, in 2012, the combined opposition holds majority by a mere one seat. According
to Kaufmann, Kraay and Masruzzi’s political stability indicator, political instability in Guyana has been
rampant from 2000-2006 as can be seen in figure 8. After the death of the leader of the PPP/C in 1997, his
wife (who was not a born Guyanese) assumed power and the opposition did not recognize her presidency
as legitimate. Political posturing on both sides continued as opposition supporters took to the streets.
In 2006, the PPP/C invited international observers to oversee the general elections and they emerged as the
victor. General elections were considered free and fair in 2011 and were monumental as the PPP/C became
a minority government for the first time. The introduction of the government’s budget set the political tone
for the remainder of the year as the opposition sought to cut the budget and the government objected on
grounds of constitutionality. Much of the year had been a battle over the constitutionality of the rulings and
motions of the speaker and joint opposition respectively.
In Guyana’s case political uprising through riots seem to be in five year cycles and the extent to which this
binds growth depends on how long the private sector expects this to continue and to what extent it
postpones investment in Guyana. Over the past five years the country witnessed a surge in retail outlets and
private sector is in the stability of the political climate. One would have to wait and see what unfolds in the
remaining four years and what impression politicians send to the private sector and the country at large.
4.7 Why Market Failures Could Explain The Lack of Dynamism in Guyana’s Economy?
Summers (2003) argued that any country that has sound money, is open to trade and protects private
property is well on its way for accelerated and sustained growth. This may well be true for the OECD
countries that have already established sufficient economic dynamism and structural change. But for
countries with static economic structure, stagnant export basket and rampant market failures that results in
sub-optimal levels of self discovery, such policies would prove ineffective. Certainly they are necessary
conditions but insufficient alone to accelerate growth. Based on the analysis presented in this paper,
Guyana is a strong protector of private property when compared to LAC and is only slightly behind North
America and Western Europe. Further, Guyana boasts about its careful macroeconomic management and
invites international observers to oversee its general elections – indicative of its commitment to
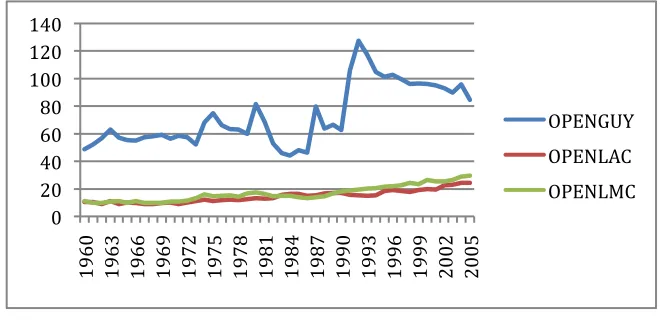
international transparency. Guyana is also highly open (summation of exports and imports as a % of GDP)
when compared to LAC and LMC. Between the period 1960-2005 Guyana’s openness index approximates
[image:25.612.142.475.530.690.2]154% of GDP as compared to 28% and 36% of GDP for LAC and LMC respectively. See figure 11 below.
Figure 11: Openness Index for GUY, LAC and LMC
(OPENGUY – Guyana openness index, OPENLAC – LAC openness index and OPENLMC – LMC openness index).
0 20 40 60 80 100 120 140
1960 1963 1966 1969 1972 1975 1978 1981 1984 1987 1990 1993 1996 1999 2002 2005
OPENGUY
OPENLAC
Such openness becomes necessary for small economies as the domestic market is too small to afford local
firms the opportunity to benefit from economies of scale. Openness could be growth enhancing through
technology transfer and because it presents an enlarged market for domestic firms to exploit. However, it
also increases a country’s external vulnerability and a static/highly concentrated export basket will
[image:26.612.143.473.239.413.2]exacerbate this harsh reality – this is the position Guyana finds itself in. See figure 12.
Figure 12: Guyana's Major exports for the period 1973-2011
Figure 12 highlights Guyana’s major exports since 1973-2011. The researcher employed the Herfindahl
index (a common measure of industrial concentration) to Guyana’s export basket and concluded that
Guyana’s export portfolio is highly concentrated and only moderately concentrated in year 2000. The
decision criteria are as follows:
An HHI index below 0.15 indicates an unconcentrated index.
An HHI index of 0.15 to 0.25 indicates moderate concentration.
An HHI index greater than 0.25 indicates high concentration.
HERFINDAHL INDEX:
0.0 10.0 20.0 30.0 40.0 50.0 60.0
1973 1979 2000 2006 2011
% Of Total Exports
Years
Sugar
Rice
Bauxite
Gold/Diamonds
Timber
Where si is the size of the total export share for each commodity and N is the total number of commodities
exported.
H INDEX 1975= 0.34
H INDEX 1979= 0.31
H INDEX 2000= 0.19
H INDEX 2006= 0.25
H INDEX 2011= 0.28
Such highly concentrated export basket is synonymous to a poorly diversified export portfolio and
highlights the fact that after 46 years of Guyana’s independence, it has only learned to do few new things.
This is a direct result of what Hausmann and Rodrik call poor levels of self discovery - a consequence of
market failure such as information externalities.
To confirm that low levels of self discovery perpetuated by information externalities is a binding constraint
on private entrepreneurship the researcher employs the HRV differential diagnosis7. What would be the
shadow price or measure that indicates that low levels of self discovery is indeed a binding constraint? The
most obvious of them would be the amount of ‘newly’ produced goods/services that exist in a given period
of time. Large quantities of newly produced goods would indicate high levels of self discovery, conversely,
few newly discovered goods/services suggest the presence of low levels of self discovery. Based on figure
12, Guyana has been producing primarily the same commodities with changes only in their relative
importance in the overall export basket. This indicator is not a market/shadow price per se but it is useful
as it signals to the analyst that information externalities could be binding. If this is true then entrepreneurs
should be attempting to bypass the process of self discovery. This is precisely what has been occurring in
Guyana as economic agents seek to emphasize competitiveness policies rather than embrace the risk of self
discovery. This bypass of self discovery by Guyanese businesses could explain Guyana’s static economic
structure. Furthermore, greater call for tax reduction8 by the private sector is another attempt to bypass self
discovery. Reduced tax rates would increase the profitability of local businesses and create greater incentives
to become more competitive in already established or traditional goods/services.
For information externalities to be binding, economic agents who evade the risk of self discovery should be
more likely to survive and thrive in the local economy than those who do not. A careful look at the
decomposition of Guyana’s Gross Domestic Product (various Annual Bank of Guyana Reports) would
reveal that Wholesale and Retail Trade9 accounts for the lion’s share of the services sector, which also
contributes the largest to Guyana’s GDP. Wholesale and Retail trade activities are the opposite of self
discovery as the latter would involve discovering what can be produced locally (albeit profitably) out of the
wholesale and retail sectors.
5. CONCLUSION
The HRV growth diagnostics revealed that the high cost of finance and government failures cannot explain
why Guyana’s economic structure remains at a standstill or why current levels of entrepreneurial ingenuity
leaves much more to be desired. It has revealed however, that information externalities, which is the root
cause of low levels of self discovery is a binding constraint at this juncture of Guyana’s growth story. This
was determined using the HRV differential diagnosis that sought to determine if the risk of self discovery
contained the four principal indicators of a binding constraint. The one limitation of this analysis is that the
researcher was unable to determine if greater levels of self discovery would accompany growth, as
insufficient data exist to make any inference – since there were little to no instances of self discovery in
Guyana’s growth history. This limitation is not insurmountable; however, as sufficient evidence exists to
conclude that information externalities are a binding constraint to long term growth in Guyana.
5.1 RECOMMENDATIONS
The recommendation is to temporarily increase barriers to entry for industry/business activities that are
newly discovered by risk taking economic agents. For instance: if an entrepreneur discovers that he could
assemble bicycles profitably in Guyana, the government could grant him the sole right in the entire country
to assemble bicycles for a given period – after which local businesses are free to enter the industry and
compete. Or they could limit the number of market participants for a given period of time.
This form of monopoly or imperfect competition is not susceptible to low productivity and efficiency
because its monopoly power is only temporary, thus incentives exist to improve efficiency and productivity
as competition is expected in the future - it is the credible threat of future competition that guarantees this.
The idea is to limit competition to afford risk taking entrepreneurs an opportunity to gain sufficiently from
his/her discovery as he/she alone had undertaken the risk of investing in the assembly of bicycles. One
must not confuse the necessity of competition policies for traditional industries and the need for
monopolistic/oligopolistic profits in newly discovered ones.
Feasibility studies are imperative to the success of any new investment project and this may be too costly
for economic agents to undertake at any satisfactory level. I recommend that the government undertake
these feasibility studies and utilize various financing arrangements of co-financing and full financing by the
state. The implementation of these recommendations should create an entrepreneurial culture that is new to
Guyana as citizens’ ideas are taken seriously through feasibility studies and as the gains to successful
investment in new industries are clear and uncompromised – at this point Guyanese should begin to
REFERENCES
Abdul Qayyum, Idrees Khawaja, and Asma Hyder. "Growth Diagnostics in Pakistan." Pakistan Institute of Development Economics, 2008.
Cornelia Stariz, Ruben Atoyan and Judith Gold. "Why Has Growth Stopped? An Empirical Study on the Stagnation of Economic Growth ." International Monetary Fund, 2007.
Faal, E. "Currency Demand, The Underground Economy, and Tax Evasion: The case of Guyana." IMF Working Paper 03/07, International Monetary Fund, 2003.
Guyana, Government of. "National Competitiveness Strategy for Guyana." 2006.
Hausmann, R.,Hwang, J., and Rodrik, D. "What You Exort Matters." National Bureau of Economic Research Working Paper #11905. Cambridge, MA, United States, 2006.
Hausmann, Ricardo, and Dani Rodrik. "Economic Development as Self-Discovery." Journal of Development Economics, 2003: 72(2): 603–33.
Hausmann, Ricardo, Dani Rodrik, and Andrés Velasco. "Growth Diagnostics." John F. Kennedy School of Government, Harvard University, 2005.
Hidalgo, C., B. Klinger, A. L. Barabasi, and R. Hausmann. "The product space conditions ." Science, 2007: 317:482-487.
Kaldor, N. "Causes of the Slow Rate of Growth of the United Kingdom." Cambridge:, 1966.
Kaufmann, Daniel, Kraay,Aart and Mastruzzi Massimo. " The Worldwide Governance Indicators: Methodology and Analytical Issues." World Bank Policy Research Working Paper No. 5430, 2010.
Khemraj, T. "The missing link: the finance-growth nexus and the Guyanese growth stagnation." Social and Economic Studies, 2008: Vol. 57, Nos. 3&4.
Lewis, W. Arthur. "Economic Development with Unlimited Supplies of Labor." Manchester School of Economic and Social Studies , 1954: Vol. 22, pp. 139-91.
Mishra, Prachi. "Emigration and Brain Drain: Evidence From the Caribbean ." International Monetary Fund, 2006.
Ricardo Hausmann, Bailey Klinger, Rodrigo Wagne. "Doing Growth Diagnostics in Practice: A 'Mindbook'." Center for International Development at Harvard University CID Working Paper No. 177, 2008.
Ricardo Hausmann, Lant Pritchett and Dani Rodrik. "Growth Accelerations." NBER Working Paper No. 10566, 2004.
Rodrik, Dani. "Industrial Policy for the Twenty-First Century." John F. Kennedy School of Government, Harvard University, 2004.
Summers, Lawrence H. "Godkin Lectures." Harvard University Kennedy School of Government, 2003.