Total Electron Content and Anomalous Appearance of
GPS Satellites as Pointers to Epicentre Identification of
Major Japan Earthquake of 2011
Minakshi Devi*, Ananda Kumar Barbara
Department of Physics, Gauhati University, Guwahati, India. Email: *[email protected]
Received December 13rd, 2011; revised January 10th, 2012; accepted January 16th, 2012
ABSTRACT
The paper presents an analysis of variations in Total Electron Content (TEC) observed through Global Positioning Sys-tem (GPS) at Guwahati (26˚10'N, 91˚45'E), in relation to the Japan Earthquakes (EQs) of March 9 and 11, 2011. For this purpose, the azimuthal positions and trajectories of abnormally increased number of satellites at the epicentre loca-tion appearing into the Field Of View (FOV) of GPS antenna at Guwahati and consequent pseudo enhancement in TEC are taken as inputs. The paper discusses how the analysis results could provide warning alarms of two earthquakes pos-sibly one on March 8 or 9 and the other on March 11 or 12, 2011 with epicenter positions around 135˚E to 145˚E and 35˚N to 40˚N, that coincides with location of Japan Earthquakes. A projected forecast on EQ magnitude of M > 8.5 is also made. The explanations to the observed modifications in TEC features and abnormal increase in number of satel-lites are purported to be the result of coupling between lithosphere and troposphere forced in by pre-earthquake proc-esses that had spread the zone of activities to as far as Guwahati.
Keywords: GPS-TEC; Earthquake; Satellite Track; Radio Refractive Index
1. Introduction
The prediction of earthquakes (EQs) by remote sensing methods is a challenging problem, as the observable pre- cursive imprints from an EQ even from close knit stations may vary because of complexity in the preparatory proc- ess as well as that of the very targeted entities. Amongst many approaches adapted for this purpose, the use of Electromagnetic (EM) signals as tool of identification of EQ precursor has proved to be popular because of their realm of frequency range from VLF to VHF [1-4]. The fact that such signals carry characteristics of the atmos- phere, the transporting media, the parameters like tem- perature, pressure of lower atmosphere (troposphere) and ionisation density as well as Total Electron Content (TEC) relevant to upper atmosphere (ionosphere), are used as instruments for identification of impending earthquake signatures [5-15].
In this paper TEC data of Gauhati (26˚10'N, 91˚45'E) along with associated factors will be utilized with aims to focusing on their capability of providing warning of Ja- pan earthquakes of March 2011.
2. Observations
In our earlier efforts to look for seismic effects on low- latitude atmosphere, TEC variations obtained from dual frequency GPS observations at Gauhati University were taken as the prime parameters [5,10]. Here, we utilize TEC data along with the incidence of sudden increase in number of satellites appearing in Field Of View (FOV) of the GPS antenna at Guwahati [16] as inputs, for fore- casting the major Japan Earthquakes of March 9 and 11, 2011 with magnitudes of 7.3 and 9 respectively, occur- ring at the same location of 38.322˚N, 142.369˚E.
2.1. TECnoon Peak Variation and
EQ Induced Features
We had shown that [5,10,11] TECnoon time peak (TECnoon peak) may provide EQ precursors when non seismic fac- tors are removed from the data. For this purpose at least five quiet days (Q-days i.e., when geomagnetic influences are low) were selected near an EQ event and the maxi- mum possible normal statistical flucutauions on the TECnoon peaks in these days were set through their Stan- dard deviation (Sd) limits. The EQ induced features were then extracted by comparing the TECnoon peaks of
relevant days with respect to the Q-day Sd limit [10,11]. This analysis shows some precursive features character- ised by: 1) There is a rising trend on the magnitude of TECnoon peak a few days prior to an EQ exceeding the maximum excursion of Sd limit and 2) On attainment of this maximum, the TECnoon peak decreases and 3) On days near or at the trough of this decline, an earthquake is expected. The patterns 1) and 2) are considered as preludes to an earthquake when:
(1) The epicenter lies within ±5˚ about the observing station Guwahati, and magnitude of EQs, M ≥ 5.
(2) The epicenter lies beyond ±5˚ [unlike the (1) above] but the event occurs within the earthquake preparatory region.
Adapting this basic approach, we chart Q-day TEC noon peaks and the Sd limits on a routine basis. In Figure 1, the variations of this parameter around the Japan EQ events along with Q-day Sd margins are plotted. Here, both the vertical and oblique components of TEC noon peak have been taken into account [16]. The figure shows that in some days the TECnoon peaks exceed the maximum Sd limit followed by a tendency to decrease, conforming the pre-EQ preludes defined above. Thus taking theses prel-ude [1) and 2)], one can expect that two events of EQs might occur one on March 8-9 and the other on March 11 - 12, 2011. In the Figure 1, we marked these predicted EQ events by blue arrow heads and the red arrows mark the observed events. This technique suggests the probable day of an EQ only, but not the epicentre information. It is therefore necessary that along with these criteria a few more parameters should be taken for identification of the epicentre, as was done by Devi et al. [16], in case of the major China EQ of May 2008. The details are presented in the next section.
135
125
115
105
95 90 100 130
120
110
TE
C
U
6 7 8 9 10 11 12 13 14 15
Days
[image:2.595.66.281.518.677.2]Sdlimit
Figure 1. Enhancement in TECnoon peak values prior to the Japan EQs of March 9 and 11, 2011. The arrow heads shown in “blue” are our prediction of EQs and the observed events are marked by arrow head in “red”. The Sd limit for normal fluctuiations of Q-day is also marked.
2.2. Azimuth of Satellites Coming Within the Field of View of the GPS Receiver
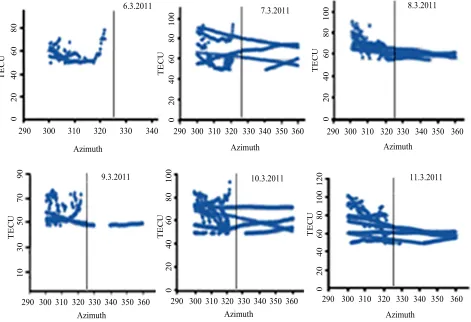
In case of Sichean (China) EQ of 2008, Devi et al. [16] could identify the location of the epicentre through analy- sis of anomalous increase in appearance of GPS satellites at a particular zone. On the basis of this observation, we, as routine exercise, record the number of satellites coming in the FOV of our GPS antenna from different azimuth positions. The analysis showed that, in early part of March 2011 i.e. within the approaching days of Japan EQ., a large number of satellites made their appearance at azi- muths not normally seen. In Figure 2 the TEC values (>40 U) recorded by the satellites from such azimuths are presented from March 6 to beyond the event of March 11, 2011. The anomalous appearance of satellites from azi- muth positions (>320), was detected on March 7 (2 days before the EQ of March 9) registering high TEC, similar to the observation in TECnoon peak of Figure 1. The sat- ellite pass number decreased on March 8 and it reached almost normalcy on March 9 i.e., as of March 6. Interest- ingly, on March 10, large number of satellite passes again appeared from azimuth >320 but it started declining from March 11. The TEC also registered correspondingly hi- gher or lower values following the anomalous appearance pattern of satellite passes, as expected.
Epicentre Position and Magnitude
With azimuth parameter as input, we calculated the posi- tion of satellites with respect to the observing station Guwahati. The result showed that on March 7 and 10, the FOV of the receiving antenna had increased significantly and satellites as far as from 35˚N to 40˚N and 135˚E to 145˚E were visible at Guwahati. This phenomenon being associated and identified with the epicentre of an im- pending EQ [16], we recorded warnings of two EQs of March 8 or 9 and on March 11 or 12 with probable epi- center at 35˚N to 40˚N and 135˚E to 145˚E. Next, to as- sess the magnitude (M) of these EQs, we estimated the limit of pre-seismic activity zone centered about the epi- centre of an impending earthquake at a radius R = exp M (km), where M is the magnitude of earthquake [17,18]. Taking distance between the probable epicentre at 35˚N to 40˚N & 135˚E to 145˚E and Guwahati as pre- seismic activity radius R, we predicted that the magnitude of the Japan EQ needs to be >8.5.
has come from our routine analysis, that no other case of EQ with magnitude M ~ 7.0 and similar relative distance between Guwahati and epicentre location, had shown satellite pass variations as in Figure 2. Reappearance of this anomaly on March 10, both in terms of TECnoon peak and more significantly on satellite azimuth track records had suggested that a strong EQ of M ≥8.5 was on the anvil. The event of March 11 with M = 8.9 thus sup- ported our projected prediction.
ated latter with EQ preparatory modification in lower and upper atmosphere [20]. Kushida and Kushida [21,22], detected beyond Line Of Sight (LOS) signals from a transmitter in central Japan several days before the Kobe EQ of 17 January, 1995 (Magnitude M = 7.2) and they proposed this anomalous propagation of VHF (FM) sig- nals to be due to ionospheric irregularities. Fukumoto et al. [23,24] also detected an abnormal enhancement in the over-horizon 77.1 MHz FM signal strength (with small incident angle <20˚), from one week to the day of the EQ event and they associated this observation with modifica- tion in the troposphere, by EQ induced effects. Haya- kawa et al. [25] have also shown presence of seismo- atmospheric perturbations in association with VHF ano- malous propagation.
3. Discussions and Conclusion
Increase in FOV of VHF signals, leading to anomalous increase in propagation path prior to and during an EQ is reported by many earlier workers by considering pre EQ modifications both at the lower and upper atmosphere. Such propagation of signal in the frequency range 50 MHz to 70 MHz were noted by Devi and Barbara as early as in 1984 [19] ,while they were conducting an ex- periment at Guwahati in search of beyond the horizon VHF TV signal propagation. Their primary interest at that time was to understand atmospheric situation favor- able for anomalous VHF reception, which they associ-
The modifications seen in lower atmospheric variables like temperature, pressure, humidity, can be linked to parameters defined as the Radio Refractive Index (RRI). Further, such changes in atmospheric parameters are coupled to EQ time variations in Sea Surface Tempera- ture (SST), Surface Latent Heat Flux (SLHF), prior to an
Q [26,27]. E
04
0
80
60
20
0
40
80
100
60
20
04
0
80
10
60
20
0
40
80
100
60
20
30
70
90
50
10
0
40
80
10
0
120
60
20
300
290 310 320 330 340 290 300 310 320 330340 350 360
300
290 310 320 330340 350 360 290 300310 320 330 340 350 360 290 300 310 320 330 340 350 360 300
290 310 320 330 340 350 360
6.3.2011 7.3.2011 8.3.2011
10.3.2011 11.3.2011
9.3.2011 Azimuth
Azimuth Azimuth
Azimuth Azimuth
Azimuth
TE
C
U
TE
C
U
TE
C
U
TE
C
U
TE
C
U
TE
C
U
[image:3.595.63.534.377.699.2]0
These associations suggest the existence of interaction between lithosphere and the near earth environment. In this connection, we may refer to the reports of variations seen in ocean energy balance after the strong Gujrat EQ of January 26, 2001 [28] and changes in ocean, land, meteorological parameters after Sumatra earthquake of 26 December 2004 [29]. The detection of SLHF anomaly two weeks before the EQs of 14 August 2003 and 1 March 2004 in Greece [30] may also be referred to. Fur- ther, presence of interactive processes between the sur- face variabilities and near atmosphere environment with special reference to an impending EQ was also detected by Devi et al. [20] from SODAR (Sonic Detection and Ranging).
Thus, a change in RRI prior to an EQ is expected, as it is a function of temperature, pressure and humidity and is often expressed in terms of its gradient i.e. dN/dh given by relation (1):
d d 77.6 1 d d 2 9620 3
d d 4870 2 d d 1 m
N h T P h P T e T
T h T e h
(1)
In the Equation (1), T is the temperature, P the pressure and e the relative humidity. Any change in this gradient, will modify the ray path geometry [31,32]. Thus, there will be situations in the atmosphere favourable for gen- eration of ‘atmospheric duct’, when a ray may be trapped and may progress in a waveguide mode, far extending the normal propagation limit, when the refractive index de- creases with height much more rapidly than the normal lapse rate. As the ray trajectory changes with refractive index gradient, its relation with effective Earth’s radius does also change and therefore, the ray path gets modified accordingly [14,16,20].
The appearance of satellites beyond the normally visi- ble horizon prior to the Japan EQ, suggests that the in- crease in FOV has occurred due to modification in RRI, which in its turn has changed the earth’s curvature with respect to the ray path radius. The increased number of visible satellites will cause significant pseudo enhance- ments in TEC as noted on March 7 and 10, prior to the EQs. This enhancement in TEC on March 7 is also inter- esting as the magnitude of EQ on March 9, did not attain the required magnitude of 8.5 to show its effect on the TEC, at Guwahati. Such modification especially in satel- lite track position however suggested that a stronger EQ was yet to occur in this location. We could further sub- stantiate this point through anomalous features seen on March 10 and subsequent occurrence of the major EQ of March 11.
It is also important here to mention that a magnetic storm that occurred on March 10-11 might modulate the TEC on these days. Thus, to examine storm effect on the pseudo enhancement in noon time TEC, this parameter is
–100
–200 –300
–400
–500 0
80
60 100 130 120
TEC
U
6
1 11
Days
Ds
t (
nT
)
[image:4.595.308.541.95.200.2]16
Figure 3. Variations in Dst from March 1 to 16, 2011 along with those of noon time TEC peak (shown as red dots). Two magnetic storms occurred during this period as displayed in Dst pattern. The EQ days are marked by arrow heads. Note the high TEC values prior to the EQ events, with no ap-parent relation with Dst fluctuations.
6.0
7.0
8.0
9.0
9.
5
8.5
7.5
6.5
6 8
0 2 4 10
12.3.2011
11.3.2011
9.
3.2
01
1
Event number
E
Q
magn
it
ude
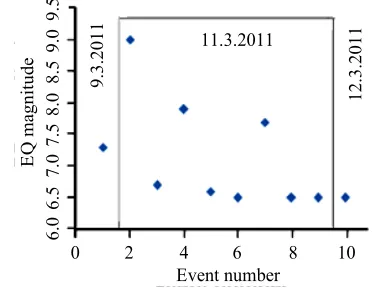
Figure 4. The number of EQs with epicentre at 38.322˚N, 142.369˚E, occurred during March 9, 2011 to March 12, 2011. The figure shows that there is one EQ event on March 9, eight (from event no. 2 to no. 9) on March 11, followed by one aftershock (event no. 10) on March 12. No earthquake of M ≥ 6 occurred on March 10.
displayed in Figure 3 along with Dst values i.e., the “dis- turbance amplitude, storm time” of the month. The figure suggests that changes in TEC are associated with factors other than magnetic storm and significantly, it shows the presence of pre EQ effect on TEC on March 7 and 10. The slow decrease of TEC after the strong EQ of March 11 is perhaps associated with seven strong seismic events on the same day with one aftershock that trailed to March 12, as shown in Figure 4. Further, the modification in satellite azimuth status suggests that the effect is more associated with lithospheric-atmospheric coupling proc- esses, rather than magnetic storm induced changes in the ionisation density at the ionosphere [16,33]. However, further work is necessary to isolate storm induced effect on TEC from the EQ.
REFERENCES
[image:4.595.326.512.285.431.2]zawa, “Determination of the Characteristics of Iono-spheric Disturbance in the near Zone of the Earthquake Epicenter,” Journal of Geophysical Research, Vol. 87, No. B9, 1982, pp. 7824-7828. doi:10.1029/JB087iB09p07824 [2] M. Parrot and M. M. Mogilevsky, “VLF Emissions
Asso-ciated with Earthquakes and Observed in the Ionosphere and Magnetosphere,” Physics of the Earth and Planetary
Interiors, Vol. 57, No. 1-2, 1989, pp. 86-99.
doi:10.1016/0031-9201(89)90218-5
[3] M. Hayakawa, “Atmospheric and Ionospheric Electro- magnetic Phenomena Associated with Earthquake,” Terra Scientific Publishing Co., Tokyo, 1999.
[4] M. Hayakawa and O. A. Molchanov, “In Seismo Elec- tromagnetics, Lithosphere-Atmosphere-Ionosphere Cou- pling,” Terra Scientific Publishing Co., Tokyo, 1999. [5] M. Devi, M. K. Barman, A. K. Barbara and A. H.
Depueva, “Total Electron Content near Anomaly Crest as Precursor of Earthquake,” India Journal of Radio &
Space Physics, Vol. 30, 2001, pp. 209-213.
[6] J. Y. Liu, Y. I. Chen, Y. J. Chou and H. F. Tsai, “Varia- tions of Ionospheric Total Electron Content during the Chi-Chi Earthquake,” Geophysical Research Letters, Vol. 28, No. 7, 2001, pp. 1383-1386.
doi:10.1029/2000GL012511
[7] J. Y. Liu, Y. J. Chino, S. A. Pulinets, H. F. Tsai and Xia-oping. Zeng, “A Study on the TEC Perturbation Prior to the Rei-Li Chi-Chi and Chi-Yi Earthquake,” In: M. Ha-yakawa and O. A. Molchanov, Eds., Seismo Electromag-
netics: Lithospher-Atmosphere-Ionosphere Coupling, Terapub,
Tokyo, 2002, pp. 293-301.
[8] Sh. Naman, L. S. Alperovich, Sh. Wdowinski, M. Haya- kawa and E. Calais, “Comparison of Simultaneous Ob- servations of the Ionospheric Total Electron Content and Geomagnetic Field Associated with Strong Earthquakes,” In: M. Hayakawa and O. A. Molchanov, Eds., Seismo Elec-
tromagnetics: Litho-sphere-Atmosphere-Ionosphere Cou-
pling, Terrapub, Tokyo, 2002, pp. 303-308.
[9] E. L. Afraimovich, V. V. Kirushkin and N. P. Perevalova, “Determination of the Characteristics of Ionospheric Dis-turbance in the near Zone of the Earthquake Epicenter,”
Journal of Communications Technology and Electronics,
Vol. 47, No. 7, 2002, pp. 739-747.
[10] M. Devi, A. K. Barbara and A. Depueva, “Association of Total Electron Content and foF Variations with Earth-quake Events at the Anomaly Crest Region,” Annals of
Geophysics, Vol. 47, No. 2004, pp. 83-91.
[11] M. Devi, A. K. Barbara, P. Kashyap, A. Depueva, Yu. Ya. Ruzhin and V. Depuev, “Earthquake Time Low Latitude Total Electron Content (TEC) Variations and Model Based Pattern: Identification of Earthquake Induced At-mospheric Dynamics,” Advances of Geosciences, Vol. 27, 2011, pp. 69-84.
[12] Y. Ruzhin and C. Nomico, “Radio VHF Precursors of Earthquakes,” Natural Hazards, Vol. 40, No. 3, 2007, pp. 573-583. doi:10.1007/s11069-006-9021-1
[13] M. Devi, A. K. Barbara, A. Depueva and V. Depuev, “Preliminary Results of TEC Measurements in Guwahati, India,” Advances in Space Research,Vol. 42, No. 4, 2008,
pp. 753-756. doi:10.1016/j.asr.2008.01.020
[14] M. Hayakawa, “Electromagnetic Phenomena Associated with Earthquakes,” Transworld Research Network, Tri- vandrum, India, 2009.
[15] M. Hayakawa and Y. Hobra, “Current Status of Seismo- Electromagnetic for Short-Term Earthquake Prediction,”
Geomatics, Natural Hazards and Risk, Vol. 1, No. 2,
2010, pp. 115-155. doi:10.1080/19475705.2010.486933 [16] M. Devi, A. K. Barbara, A. Depueva, Yu. Ya. Ruzhin and
V. Depuev, “Anomalous Total Electron Content (TEC) and Atmospheric Refractivity Prior to Very Strong China Earthquake of May 2008,” International Journal of
Re-mote Sensing, Vol. 3, 2010, pp. 3589-3599.
doi:10.1080/01431161003727663
[17] I. R. Dobrovolsky, S. I. Zubkov and V. I. Myachkin, “Es-timation of the Size of Earthquake Preparation Zones,”
Pure and Applied Geophysics, Vol. 117, 1979, pp. 1025-1044.
doi:10.1007/BF00876083
[18] A. H. Depueva, and Yu. Ya. Ruzhin, “Seismoionospheric Fountain-Effect as Analogue of Active Space Experi- ment,” Advances in Space Research, Vol. 15, No. 12, 1995, pp. 151-154.
[19] M. Devi and A. K. Barbara, “On Beyond the Horizon Propagation of VHF Signals,” ISEA-7,Hong Kong, 1984, pp. 6-26.
[20] M. Devi, A. K. Barbara, Yu. Ya. Ruzhin and A. H. De- pueva, “Beyond the Horizon Propagation of VHF Signals: Atmospheric Features and Earthquake,” Electronic
Jour-nal, Investigated in Russia,Vol. 129e, No. 39, 2007, pp. 1331-
1340.
[21] Y. Kusida and R. Kusida, “On a Possibility of Earthquake Forecast by Radio Observation in the VHF and Band,”
RIKEN Review, Vol. 19, 1998, pp. 152-160.
[22] Y. Kusida and R. Kusida, “Possibility of Earthquake Forecast by Radio Observations in the VHF Band,”
Journal of Atmospheric Electricity, Vol. 22, 2002, pp.
239-255.
[23] Y. Fukumoto, M. Hayakawa and H. Yasuda, “Current status of Seismo-Electromagnetics for Short-Term Earth-quake Prediction,” Natural Hazards and Earth System
Sciences, Vol. 1, 2001, pp. 107-112.
doi:10.5194/nhess-1-107-2001
[24] Y. Fukumoto, M. Hayakawa and H. Yasuda, “Reception of over Horizon FM Signals It Earthquake,” In: M. Ha- yakawa and O. A. Molcghanov, Eds., Seismo Electro-
magnetic: Lithosphere-Atmosphere-Ionosphere Coupling,
Terrapub, Tokyo, 2002, pp. 263-266.
[25] M. Hayakawa, V. V. Surkov, Y. Fukumoto and N. Yo-naiguch, “Characteristics of VHF over Horizon Signals Possibly Related to Impending Earthquakes and a Mecha-nism of Seismo-Atmospheric Perturbations,” Journal of
Atmospheric and Solar-Terrestrial Physics, Vol. 69, No.
9, 2007, pp. 1057-1062. doi:10.1016/j.jastp.2007.03.011 [26] V. I. Gorny, A. G. Salman and A. A. Tronin, “The Earth’s
[27] D. Ouzonov and F. Freund, “Mid-Infrared Emission Prior to Strong Earthquakes Analyzed by Remote Sensing Data,” Advances in Space Research, Vol. 33, No. 3, 2004, pp. 268-273. doi:10.1016/S0273-1177(03)00486-1 [28] R. P. Singh, S. Bhoi and A. K. Sahoo, “Significant Chan-
ges in the Ocean Parameters after the Gujarat Earth- quake,” Current Science, Vol.80, 2001, pp. 1376-1377. [29] R. P. Singh, G. Cervone, M. Kafatos, A. K. Prasad, A. K.
Sahoo, D. Sun, D. L. Tang and R. Yang, “Multi-Sensor Studies of the Sumatra Earthquake and Tsunami of 26 December 2004,” International Journal of Remote Sens- ing, Vol. 28, No. 13-14, 2007, pp. 2885-2896.
doi:10.1080/01431160701237405
[30] G. Cervone, M. Kafatos, D. Napoletani and R. P. Singh, “Wavelet Maxima Curves of Surface Latent Heat Flux
Associated with Two Recent Major Greek Earthquakes,”
Natural Hazards and Earth System Sciences,Vol. 4, 2004,
pp. 359-374. doi:10.5194/nhess-4-359-2004
[31] M. Dolukahnov, “Propagation of Radio Waves,”Mir Pub- lisher, Moscow, 1971, pp. 140-167.
[32] M. P. Hall and P. A. Bradley, “Troposphere and Iono- sphere,” In: F. Mazda, Ed., Telecommunications Engineer’s
Reference Book, Section 13, 2nd Edition, Reed Educa-
tional and Professional Publishing Ltd., Oxford, 1998, pp. [33] M. Devi, A. K. Barbara and M. Barman, “Ionospheric
Irregularities and Storm-Induced Equatorial and High-Latitude Effects at the Anomaly Crest Region,” Radio Physics and
Quantum Electronics, Vol. 39, No. 3, 1996, pp. 179-187.