ISSN Online: 2327-4379 ISSN Print: 2327-4352
DOI: 10.4236/jamp.2019.71018 Jan. 28, 2019 218 Journal of Applied Mathematics and Physics
Investigation on Pressure Drop of Fluid-Solid
Mixture Flow through Pipes Using
CFD and SK Model
Miller Jothi
1*, Redae Haimanot
2, Udaya Kumar
31School of Mechanical & Industrial Engineering, Ethiopian Institute of Technology-Mekelle, Mekelle University,
Ethiopia, Eastern Africa
2Department of Mechanical Engineering, Adigrat University, Ethiopia, Eastern Africa
3Department of Mechanical Engineering, BITS Pilani Dubai Campus, Dubai International Academic City, Dubai, UAE
Abstract
The carrier fluid (air or water) is used to transport solid material from the source place to its destination point through pipeline. Using air as carrier fluid to transport solid material through pipeline is called Pneumo transport, whereas transporting material with water or any other liquid through pipeline is called as hydraulic transport. A large number of installations are now available globally to transport solid materials to short, medium, and long dis-tances using water/air as carrier fluid. However, the design of such system of pipeline is still an empirical art. In the present investigation, one generalized mathematical model developed by Shrivastava and Kar (SK Model) and CFD models were used and compared with experimental results for pneumatic and hydraulic transport of granular solids. The motivation of present work is to find the accuracy of SK model based on analytical, empirical and semi- empirical for the prediction of pressure drop and comparing the result with CFD based on mathematical equation for the mixture flow in the horizontal and vertical pipe lines. The comparison of pressure drop results obtained by using SK model and CFD model were validated with the experimental re-sults for pneumatic and hydraulic transport of solids through. From the comparison results, it was observed that the results of pressure drop pre-dicted by SK model are more accurate than the CFD models for all the cases considered.
Keywords
Pressure Drop, SK Model, CFD Models, Hydraulic and Pneumatic Transport, Solid and Fluid Flow
How to cite this paper: Jothi, M., Haima-not, R. and Kumar, U. (2019) Investigation on Pressure Drop of Fluid-Solid Mixture Flow through Pipes Using CFD and SK Model. Journal of Applied Mathematics and Physics, 7, 218-232.
https://doi.org/10.4236/jamp.2019.71018 Received: December 14, 2018
Accepted: January 25, 2019 Published: January 28, 2019
Copyright © 2019 by author(s) and Scientific Research Publishing Inc. This work is licensed under the Creative Commons Attribution International License (CC BY 4.0).
http://creativecommons.org/licenses/by/4.0/
DOI: 10.4236/jamp.2019.71018 219 Journal of Applied Mathematics and Physics
1. Introduction
Fluid-solid mixture flow is form of multiphase flow which is simultaneous flow of two or several phases through a system such as pipe in the present investiga-tion. From the literature survey [1] [2] [3], two-phase flow may be grouped ac-cording to the phases involved as gas-liquid mixture, gas-solid mixture, liq-uid-solid mixture, and two-immiscible-liquids mixture. The study of two phase flow is not only important from the viewpoint of fundamental phenomenon but also in practical applications (pneumatic transport and hydro-transport of par-ticles in pipes) and natural phenomenon (e.g. sediment transport in water bodies, biological/ biomedical flow). Solid particles can be transported from one loca-tion to another using pipeline and carrier fluid like liquid, water, oil, and etc. and gases. Depending up on the carrier fluid the solid transport system may be called as hydraulic transport or Pneumo transport, when water or air is used as carrier fluid respectively.
Many investigators have carried out experimental on prediction of pressure drop and minimum conveying velocity on fluid-solid mixture flow through pipes. Titus et al. [4] simulated the effect of particle size (90 μm to 270 μm) liq-uid slurry using Eulerian-Eulerian two-flliq-uid model in ANSYS CFX-15 in a ho-rizontal pipeline to examine frictional pressure loss. They observed that decrease in frictional pressure loss as particle size increased at constant particle volume fraction. Furthermore, for a constant particle volume fraction, the radial distri-bution of particle concentration increased with increasing particle size, where high concentration of particles occurred at the bottom of the pipe.
Kelessidis et al. [5] have performed experimental investigation on the flow of dilute solid-liquid mixtures in a horizontal concentric and 100% eccentric an-nulus. The experiments were performed in a 5 m long, 7 cm by 4 cm transparent annulus. A range of superficial liquid velocities between 0 and 2.32 m/s were studied, The authors observed that main parameters affecting the flow pattern transitions are the liquid superficial velocity, the pipe eccentricity and, to a lesser extent, the liquid viscosity. Besides frictional pressure drop with dilute slurries flowing in the concentric annulus is higher compared to liquid-only flowing for all three fluids
An experimental investigation related to frictional pressure loss in a horizon-tal pipeline on the effect of various particle size was examined by Nabil et al. [6]. From the results, least pressure loss was recorded in fine particle size whereas the highest pressure loss was recorded in the coarse particle size for each con-stant particle volume fraction ranges from 5% to 30%. Besides, it was found that the particle velocity profiles were asymmetric in nature and dependent on par-ticle size and fraction of volume.
DOI: 10.4236/jamp.2019.71018 220 Journal of Applied Mathematics and Physics been validated thoroughly with a large number of experimental results for con-veying coarse solid particles such as sand, gravels, pebbles, coal, etc. through pipes of different orientations in earlier investigations. By utilizing the results of the earlier investigations along with some new ones it has been clearly shown in this paper that the SK model estimates the values of head loss and critical veloci-ty quite accurately as compared to the experimental results for conveying coarse solid particles hydraulically through the pipes of different diameters and orien-tations, irrespective of the particle—density, shape, size, size distribution, and the solid concentration in the mixture. The SK model has also been found useful in optimizing the various parameters of hydraulic transport from energy con-sumption point of view [8].
For any fluid-solid transport system the most important parameters required to design the system are the pressure drop and minimum transport velocity. Es-timation of pressure drop is very complicated phenomena in multiphase flow. The techniques for analyzing two phase flow include correlations, phenomeno-logical models, simple analytical model, integral analysis, differential analysis, computational fluid dynamics (CFD) and artificial neural network (ANN) [9].
The physics of two-phase flow is more complex than for single flow due to the presence of dispersed (solid) phase so that this work deals with investigation on fluid (gas/liquid)-solid mixture flow through pipes. Such two-phase flow is widely encountered in pipe flows. One example of the gas-solid mixture through pipe in textile factory (air-cotton ball) that found nearby Mikelle city, Ethiopia in eastern Africa is presented in the application of this investigation. The data used for the study is based on both primary and secondary sources. The primary data are collected through MAA Garment and Textile Factory at Mekelle city, Tigray region, Ethiopia. The secondary sources of data that the researcher used are from different relevant books and Journals. In this study an attempt has been made to apply and compare the two methods of prediction pressure drop i.e.
Shrivastava and Kar (SK model) [2] [7] and CFD with experimental found in li-teratures for the fluid-solid mixture flow through pipe for different orientations. The objective of the study is to determine the most accurate empirical/semi em-pirical correlations or computational fluid dynamics (CFD) models which can predict the most accurate results for pressure drop estimation and can be apply-ing the method in industries.
2. Theory of SK Model
DOI: 10.4236/jamp.2019.71018 221 Journal of Applied Mathematics and Physics
2
2 1
0.5 1 sin
2
f f s
t d f p T P
p f P
fV M
h C A V m g
gD M m g
ρ ρ θ ρ = + + −
(1)
The Darcy-Weisbach friction factor (f) of the above Equation (1) may be de-termined by using the Blasius equations as given below:
0.25 0.3164 f Re = (2) where, Re-Reynolds numbers defined as f
f
V D Re
v
= . The values of terminal
velocity (VT) and drag coefficient (Cd) of the solid particles to be transported with a carrier fluid through a pipe may be determined either experimentally or analytically by using the properties of the carrier fluid and the solid particles and taking the mean equivalent spherical diameter (d) of the particles in the follow-ing Equations (3) to (6):
(
)
4 3 p f T d f gd V C ρ ρ ρ −= (3)
0.6
18.5 , 0.1 500
d p p
C = Re− <Re <
(4)
5
0.44, 500 2 10
d p
C = <Re < ×
(5) where, Rep—Reynolds number of particles is defined as
p p f V d Re v
= (6)
(
)
s v g T p
M =C A V V− ρ
(7)
And Mass flow rate of the fluid is defined as: Mf =ρf × ×A Vf
The mathematical expression developed for critical velocity (VC) in the SK model by applying the well-known techniques of optimization to Equation (1) is as given below:
(
)
2
1 3 1
0.5 1 sin
2 2
f
c d p t p
p
C C
s C
p f f
V C pf A V m g
p
M D
m K V C A
ρ θ ρ − + × × × × + × − × × × × × − × = (8)
where values of constants K and C may be determined experimentally from the plots of friction factor (f) against Reynolds number (Re) for the flow of fluid alone in pipe, which results into a relation of the type:
C K f Re = (9)
The value of density of particle (ρp) can be determined by using the
rela-tionship between mass of particle (mp) which is directly measured and volume
DOI: 10.4236/jamp.2019.71018 222 Journal of Applied Mathematics and Physics p
p m
V ρ =
(10)
The value of density of fluid is expressed by the equation below:
f
specfic P
R T
ρ =
(11)
3. Computational Fluid Dynamics
3.1. Multiphase Modeling
Advances in computational fluid mechanics have provided the basis for further insight into the dynamics of multiphase flows. Currently there are two ap-proaches for the numerical calculation of multiphase flows: the Euler-Lagrange approach and the Euler-Euler approach.
3.1.1. Euler-Lagrange Approach
The fluid phase is treated as a continuum by solving the Navier-Stokes equations, while the dispersed phase is solved by tracking a large number of particles, bub-bles, or droplets through the calculated flow field. The dispersed phase can ex-change momentum, mass, and energy with the fluid phase. This approach is made considerably simpler when particle-particle interactions can be neglected, and this requires that the dispersed second phase occupies a low volume fraction, even though high mass loading (mp ≥mf ) is acceptable as reported by Bartosik
and Shook [10]. The particle or droplet trajectories are computed individually at specified intervals during the fluid phase calculation. This makes the model ap-propriate for the modeling of spray dryers, coal and liquid fuel combustion, and some particle-laden flows, but inappropriate for the modeling of liquid-liquid mixtures, fluidized beds, or any application where the volume fraction of the second phase cannot be neglected.
3.1.2. Euler-Euler Approach
Manoj Kumar and Kaushal [9] were approached Euler method to investigate Modeling of sand-water slurry flow through horizontal pipe using CFD tech-nique. In the Euler approach, the different phases are treated mathematically as interpenetrating continua. Since the volume of a phase cannot be occupied by the other phases, the concept of phasic volume fraction is introduced. These vo-lume fractions are assumed to be continuous functions of space and time and their sum is equal to one. Conservation equations for each phase are derived to obtain a set of equations, which have similar structure for all phases. These equ-ations are closed by providing constitutive relequ-ations that are obtained from em-pirical information, or, in the case of granular flows, by application of kinetic theory.
4. Results and Discussions
DOI: 10.4236/jamp.2019.71018 223 Journal of Applied Mathematics and Physics
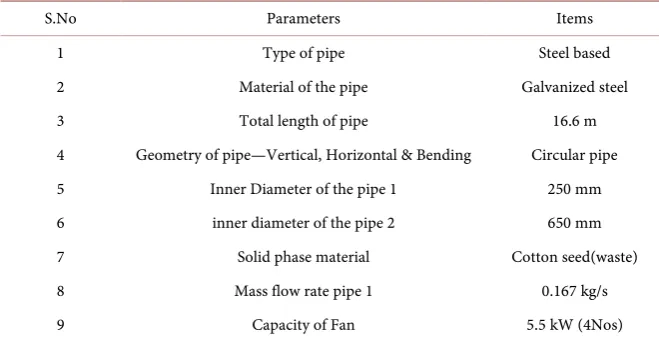
Table 1. Specifications of the Materials from MAA Garment.
S.No Parameters Items
1 Type of pipe Steel based
2 Material of the pipe Galvanized steel
3 Total length of pipe 16.6 m
4 Geometry of pipe—Vertical, Horizontal & Bending Circular pipe 5 Inner Diameter of the pipe 1 250 mm 6 inner diameter of the pipe 2 650 mm 7 Solid phase material Cotton seed(waste)
8 Mass flow rate pipe 1 0.167 kg/s
9 Capacity of Fan 5.5 kW (4Nos)
from the Manual of MAA garment and Textile factory [11], Mekelle city, Tigray region, Ethiopia as shown in Table 1.
4.1. Comparisons of Pressure Drops Using SK Model
and CFD Model
The equations given in the SK model predicts pressure drops more accurately than any other correlations available. However, many work in this area has been done utilizing the numerical methods and CFD techniques during last five dec-ades to predict the values of pressure drop for conveying solids through pipes using water or air as carrier fluids. Hence it was decided to compare the perfor-mance of SK model with that of the CFD models by comparing the calculated results of pressure drop with the experimental values of the investigators [12] [13] [14].
In this section the objective is to examine the accuracy of SK model in pre-dicting the values of pressure drops by comparing the results with the experi-mental values and those obtained utilizing the CFD model for hydraulic and pneumatic conveying of granular solids.
4.2. Hydraulic Transport
DOI: 10.4236/jamp.2019.71018 224 Journal of Applied Mathematics and Physics
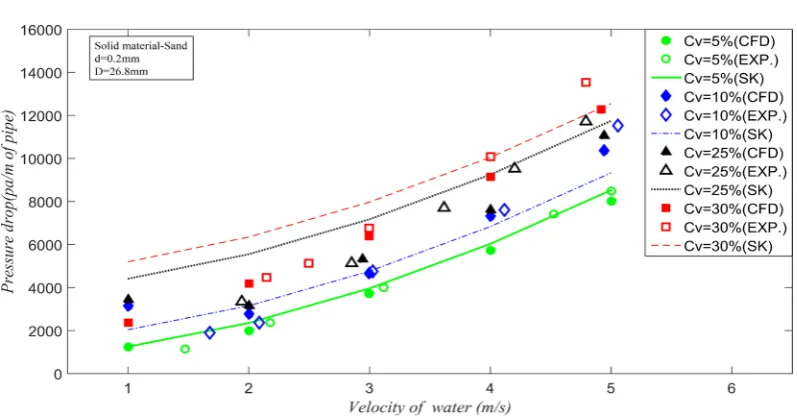
[image:7.595.142.544.126.722.2]Figure 1. Comparison of estimated pressure drop with for d50 = 0.2 mm.
Figure 2. Comparison of estimated pressure drop for d50 = 0.7 mm.
[image:7.595.142.541.419.700.2]DOI: 10.4236/jamp.2019.71018 225 Journal of Applied Mathematics and Physics of solid material and water along with calculated values of Cd and Vt given in the Tables 2-4.
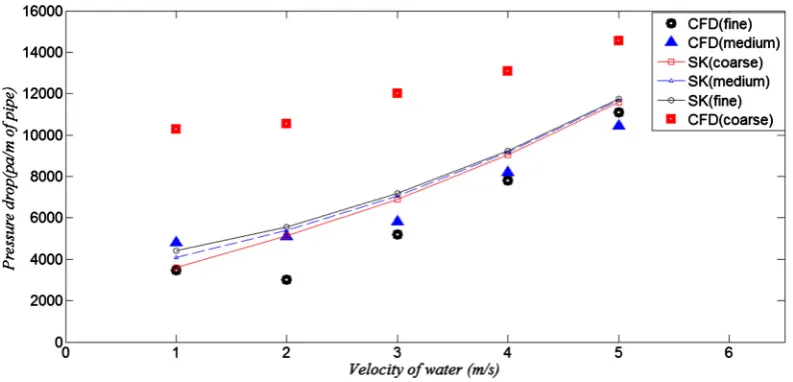
Figure 4 and Figure 5 clearly depict that the effect of particles size on pres-sure drop in the plot of prespres-sure drop against velocity of water for volume frac-tion of 5% and 25% respectively for the transportafrac-tion of sand hydraulically through horizontal pipe made by using SK model.
It may be concluded from the curves obtained using SK and CFD model that the pressure drop is inversely proportional to particle size, i.e pressure drop is minimum for highest size of particle and as the size reduces pressure drop also increases throughout the velocity of water spectrum. Howeverit is evident from these comparisons that, the results of pressure drop obtained by SK model match very closely with experimental values than the predictions made by CFD model.
The deviation from the experimental in the case of SK model was found to be ±7.54% whereas for CFD model it was observed to be ±27% as clearly reflected in the graph. The Properties of PVC granules and water along with calculated values of Cd and Vt given in Table 5 as described.
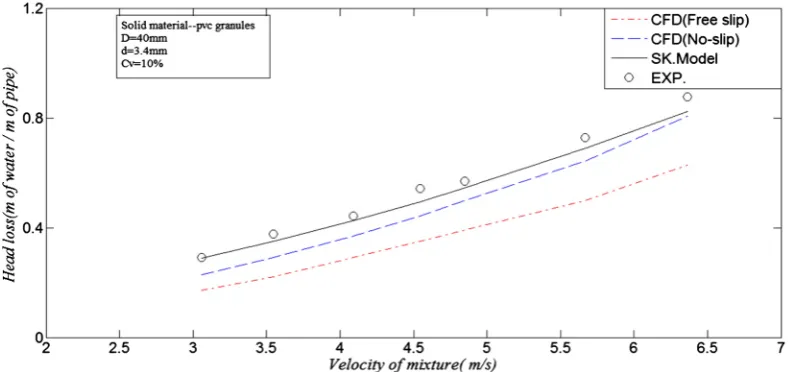
[image:8.595.206.540.401.487.2]In another work made with by Bartosik and Shook et al. [16] for hydraulic transport, a CFD model was developed and the model was tasted with experi-mental result for conveying of PVC granules of 3.4 mm size through a vertical
Table 2. Properties of sand and water and calculated value of Cd and Vt for d50 = 0.2 mm.
Conveying of Sand
26.8 mm
D= 4
50 2 10 m
d = × − 2650 kg m3
p
ρ =
6 2
1.004 10 m s f
ν = × −
[
2 3 4 5]
f
ρ = 1000 kg m3
f
ρ =
[
0.05 0.1 0.25 0.3]
v
C = e=1.5 10× −6
0.0246 m s t
[image:8.595.207.541.519.602.2]V = Cd=7.1131
Table 3. Properties of sand and water, and calculated value of Cdand Vt for d50 = 0.7 mm.
Hydro-transport
26.8 mm
D= 4
50 7 10 m
d = × − 2650 kg m3
p
ρ =
6 2
1.004 10 m s f
ν = × −
[
2 3 4 5]
f
ρ = 1000 kg m3
f
ρ =
[
0.05 0.1 0.25 0.3]
v
C = e=1.5 10× −6
0.1030 m s t
[image:8.595.207.544.641.719.2]V = Cd=1.4234
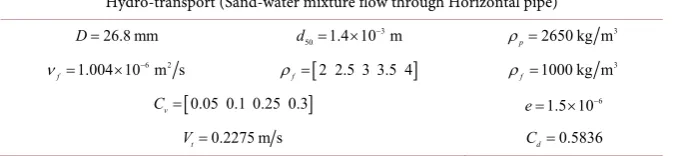
Table 4. Properties of sand and water, and calculated value of Cd and Vt for d50 = 1.4 mm.
Hydro-transport (Sand-water mixture flow through Horizontal pipe)
26.8 mm
D= 3
50 1.4 0 m1
d = × − 2650 kg m3
p
ρ =
6 2
1.004 10 m s f
ν = × −
[
2 2.5 3 3.5 4]
f
ρ = 1000 kg m3
f
ρ =
[
0.05 0.1 0.25 0.3]
v
C = e=1.5 10× −6
0.2275 m s t
DOI: 10.4236/jamp.2019.71018 226 Journal of Applied Mathematics and Physics
[image:9.595.140.537.296.487.2]Figure 4. Effect of particles size pressure drop against velocity of water for (Cv) 5%.
Figure 5. Effect of particles size pressure drop against velocity of water for (Cv) 25%.
Table 5. Properties of PVC granules and water, and calculated value of Cd and Vt.
Hydro-transport (liquid-solid mixture flow through vertical pipes)
40 mm
D= 3
50 3.4 0 m1
d = × − 1000 kg m3
p
ρ =
6 2
1.004 10 m s f
ν = × −
material = PVC granules 1000 kg m3
f
ρ =
[
3.06 3.55 4.09 4.55 4.85 5.67 6.36]
mix
V = For Cv=10%
[
2.97 3.55 4.03 4.58 5.13 5.52 5.81]
mix
V = For Cv=20%
0.2011 m s t
V = Cd=0.44
[image:9.595.207.539.538.637.2]DOI: 10.4236/jamp.2019.71018 227 Journal of Applied Mathematics and Physics Figure 7 that the results of pressure drop obtained by SK model match very closely with experimental values than the predictions made by CFD model.
4.3. Pneumatic Transport
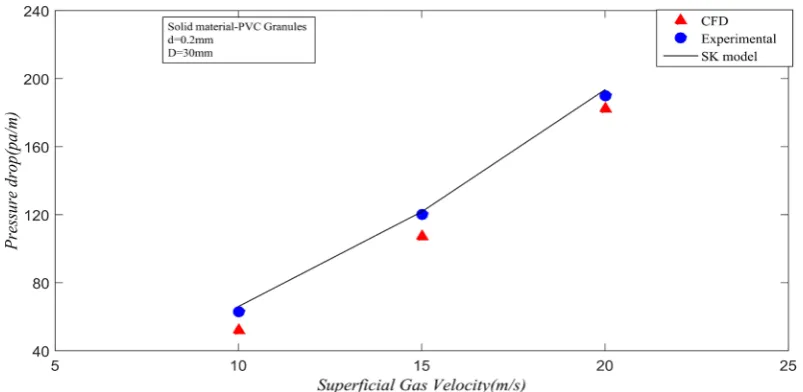
An exhaustive numerical simulation using the CFD methodology and taking Euler-Euler approaching was performed for developing CFD model by Pandaba Patro et al. [17], in their research work for gas-solid flow, and the model was va-lidated by comparing the predicted values of pressure drop of the investigators for conveying plastic particles of 200 µm and 3400 µm sizes pneumatically through 30 mm pipe.
[image:10.595.140.536.297.483.2]In the present investigation the SK model was applied to calculate pressure drops for conveying solids of different mass loading ratio pneumatically at dif-ferent volumetric concentrations and results of pressure drop have been com-pared with the predicted values using CFD model and also with the experimental
[image:10.595.138.537.513.703.2]Figure 6. Comparison of estimated pressure drop using SK model, CFD model with Cv = 10%.
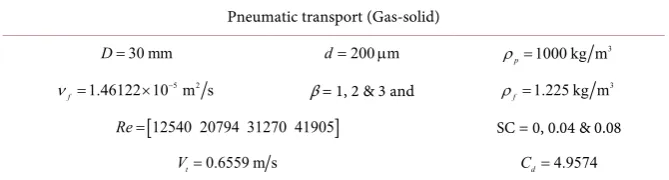
DOI: 10.4236/jamp.2019.71018 228 Journal of Applied Mathematics and Physics results of Tsuji et al. [12]. All these comparisons of pressure drops obtained SK model, CFD model and experimental results have been plotted in Figures 8-10 for mass loading 1, 2 and 3 respectively. The properties of air and calculated value of Cd and Vt for plastic solid material given in Table 6 as described.
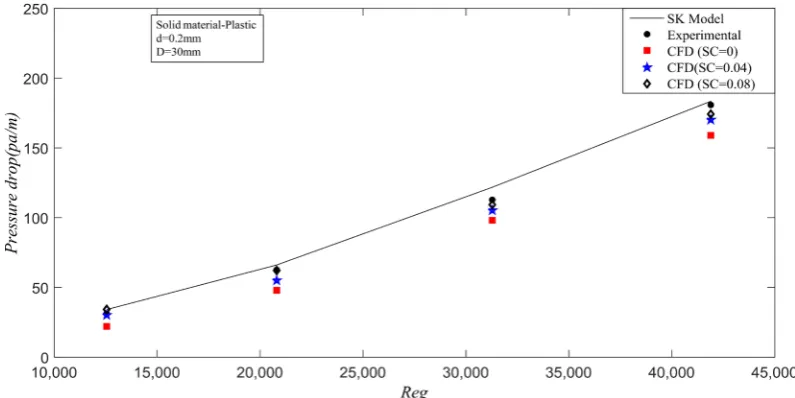
[image:11.595.139.537.276.475.2]Besides the above investigations numerical simulation was also conducted by Brundaban Patro [18] with Euler-Euler approach and considering four way coupling for different mass loading ratio of 1, 2 and 3 and particle diameter 200 µm considering an internal pipe of 30mm diameter. In this work SK model was also applied to calculate pressure drop for the pneumatic conveying of plastic particle through horizontal pipe of 30 mm inner diameter and the results were compared with the experimental values of Tsuji et al. [12] and also with predic-tions made by CFD model developed in Figures 11-13. It is to be observed that in all the comparisons SK model results match more closely with experimental
Figure 8. Comparison of CFD and SK model for Pneumo-transport (β = 1).
[image:11.595.145.537.454.708.2]DOI: 10.4236/jamp.2019.71018 229 Journal of Applied Mathematics and Physics
[image:12.595.140.542.295.491.2]Figure 10. Comparison of CFD and SK model for Pneumo-transport (d = 200 µm, β = 3 & SC = 0.08).
Figure 11. Comparisons of CFD and SK model for Pneumo-transport (β = 1) with 200 µm.
[image:12.595.141.541.518.707.2]DOI: 10.4236/jamp.2019.71018 230 Journal of Applied Mathematics and Physics
[image:13.595.206.541.335.425.2]Figure 13. Comparison of CFD and SK for Pneumo-transport (β = 3) with 200 µm.
Table 6. Properties of air, and calculated value of Cd and Vt for plastic solid material.
Pneumatic transport (Gas-solid)
30 mm
D= d=200 mµ 1000 kg m3
p
ρ =
5 2
1.46122 10 m s f
ν = × −
β = 1, 2 & 3 and 1.225 kg m3
f
ρ =
[
12540 20794 31270 41905]
Re= SC = 0, 0.04 & 0.08
0.6559 m s t
V= Cd=4.9574
Table 7. Properties of solid and air, and calculated value of Cdand Vt for 200 µm.
Pneumatic transport (Gas-solid)
30 mm
D= d=200 mµ 1000 kg m3
p
ρ =
5 2
1.46122 10 m s f
ν = × − β = 1, 2 & 3 1.225 kg m3
f
ρ =
[
10 15 20]
ms fV = SC = 0.005
0.6559 m s t
V= Cd=4.9574
results than the predicted values using CFD model. The properties of air and calculated value of Cd and Vt for 200 µm given in Table 7 as described.
5. Conclusions
• From the above experimental literatures for prediction of pressure drop, the deviation between the experimental result and calculated value is found to be good agreement as similar with Shrivastava Kaushal. The validation of expe-rimental results of pressure drop by using of empirical and semi-empirical correlation of SK model was concluded as more accurate.
[image:13.595.206.541.460.544.2]DOI: 10.4236/jamp.2019.71018 231 Journal of Applied Mathematics and Physics the friction caused due to collision of the particle.
• The pressure drop does not depend on particle size with constant internal diameter of pipe and mass flow rate of mixture rather it depends on the crit-ical velocity.
Acknowledgements
We acknowledge our thanks to MAA garment for providing the necessary data and extraordinary support in this research work.
Conflicts of Interest
The authors declare no conflicts of interest regarding the publication of this pa-per.
References
[1] Wilson, K.C., Addie, G.R., Sellgren, A. and Clift, R. (2005) Slurry Transport Using Centrifugal Pumps. 3rd Edition, Springer, Boston.
[2] Shrivastava, K.K. (2005) Determination of Optimum Particle Size for Economical Hydrotransport. ASME 2005 Fluids Engineering Division Summer Meeting, Vo-lume 1, Paper No. FEDSM2005-77065, Texas, 19-23 June 2005, 913-918.
[3] Mills, D. (2003) Pneumatic Conveying Design Guide. 2nd Edition, Elsevier, But-terworth-Heinemann, London.
[4] Ofei, T.N. and Ismail, A.Y. Eulerian-Eulerian Simulation of Particle Liquid Slurry Flow in Horizontal Pipe. Journal of Petroleum Engineering, 2, Article ID: 5743471. [5] Kelessidis, V.C., Bandelis, G.E. and Li, J. (2007) Flow of Dilute Solid-Liquid
Mix-tures in Horizontal Concentric and Eccentric Annuli. Journal of Canadian Petro-leum Technology, 46. https://doi.org/10.2118/07-05-06
[6] Nabil, T., El Sawaf, I. and El Nahhas, K. (2013) Computational Fluid Dynamics Si-mulation of the Solid-Liquid Slurry Flow in a Pipeline. Proceedings of the 17th In-ternational Water Technology Conference, Istanbul.
[7] Shrivastava, K.K. and Kar, S. (1993) General Analytical Relation for Pressure Drop for Hydro and Pneumotransport of Solids in Vertical, Horizonta Land, Inclined Pipelines. ASME 5th International Fluid Engineering Conferences on Gas-Particle Flows, Vancouver.
[8] Saha,A.K., Srivastava,D., Panigrahi,R. and Muralidhar, P.K. (2014) Fluid Mechan-ics and Fluid Power-Contemporary Research. Proceedings of the 42nd National and 5th International Conference on Fluid Mechanics and Fluid Power,IIT, Kanpur. [9] Gopaliya, M.K. and Kaushal, D.R. (2016) Modeling of Sand-Water Slurry Flow
through Horizontal Pipe Using CFD. Journal of Hydrology and Hydromechanics, 64, 261-272.
[10] Bartosik, A.S. and Shook, C.A. (1995) Modelling Bagnold Stress Effects in Vertical Slurry Flow with Coarse Particles. Proceedings of the 8th International Conference on Transport and Sedimentation of Particles, Prague, 6.
[11] (2017) Manual of MAA Garment and Textile, Guidelines of Measurements and Control. Mekelle-Quiha: S.N.
DOI: 10.4236/jamp.2019.71018 232 Journal of Applied Mathematics and Physics 385-409.
[13] Shrivastava, K.K. (2002) Pneumotransport of Grains through a Pipeline. ASME Fluids Engineering Division, 6.https://doi.org/10.1115/FEDSM2002-31111
[14] Krampa, F.N., Morlu1, J.D., Bugg, D.J., et al. (2006) Frictional Pressure Drop Cal-culation for Liquid-Solid. Syncrude Research Centre.
[15] Nabil, T., El-Sawaf, I. and El-Nahhas, K. (2014) Sand-Water Slurry Flow Modelling in a Horizontal Pipeline by Computational Fluid Dynamics Technique. Interna-tional Water Technology Journal, 4.
[16] Bartosik, A.S. and Shook, C.A. (1994) Particle-Wall Stresses in Vertical Slurry Flows. International Journal of Powder Technology, 81, 117-124.
https://doi.org/10.1016/0032-5910(94)02877-X
[17] Patro, P. and Dash, S.K. (2014) Numerical Simulation for Hydrodynamic Analysis and Pressure Drop Prediction in Horizontal Gas-Solid Flows. International Journal of Particulate Science and Technology, 32, 94-103.
https://doi.org/10.1080/02726351.2013.829543
[18] Eulerian, B.P. (2014) Modelling of Gas-Solid Multi-Phase Flow in Horizontal Pipes. ME Thesis, Mechanical Engineering Department, National Institute of Technology, Rourkela.
Nomenclature
Symbol Description [Unit]
A: Area, [m2]
p
A : Projected area [m2]
d
C : Drag coefficient [−]
v
C : Volume fraction [%]
D: Diameter of the pipe [m]
p
d : Diameter of the particle [m]
e: Roughness of pip [m]
f: Darcy friction factor [−]
p
Re : Particles Reynolds number [−]
f
m : Mass flow rate of fluid [kg/s] s
M : Mass flow rate of solid particles [kg/s] s
h : Head loss due to the solid particles [−]
f
h : Head loss of fluid [−]
t
h: Total head loss [−]
f
ν : Kinematic viscosity of fluid [m2/s]
f
ρ : Density of fluid [kg/m3]
p
ρ : Density of particles [kg/m3]
β: Mass loading ratio [−]