2011. Vol.2, No.5, 461-465
Copyright © 2011 SciRes. DOI:10.4236/ce.2011.25067
External Representations in the Teaching and Learning of
Introductory Chemistry
James R. Cox, Bethany W. Jones
Department of Chemistry, Murray State University, Murray, USA. Email: [email protected]
Received October 3rd, 2011; revised November 15th, 2011; accepted November 22nd, 2011.
This manuscript describes the role that external representations, such as diagrams and sketches, can play in or-ganizing and learning concepts presented in a one-semester chemistry course (general, organic and biochemistry) designed for nursing students. Although external representations are typically found in chemistry textbooks and instructor-drawn notes, students are usually not taught or prompted to use various types of external representa-tions to promote learning. Representarepresenta-tions created by an instructor and a student are discussed to highlight ef-fective ways to foster student participation in creating various diagrams. In addition, a student provides a per-spective on the educational value of creating external representations and the roles of visual thinking and crea-tivity in learning introductory chemistry. Although the model for this approach has been an introductory chemis-try course, this approach can be widely applied across disciplines.
Keywords: Visual Thinking, External Diagrams, Active Learning
Introduction
The availability and diversity of instructional methods in sci-ence classrooms has increased tremendously in last decade. As a result, the lecture format has been redesigned and more active forms of teaching and learning have been developed (Derting & Cox, 2008; Derting & Ebert-May, 2010; Deslauriers, Schelew, & Wieman, 2011; Haak, HilleRisLambers, Pitre, & Freeman, 2011; Lee & Jabot, 2011; Mazur, 2009). This comes at a time when the amount of content and information available in scien-tific disciplines is ever expanding. At the same time, some have heralded the end of the information age and insist we are in an interaction age (Milne, 2007) where student success depends on meaningful interactions with instructors, each other and infor-mation. Daniel Pink has suggested we have left the information age and entered a conceptual age where right-brain aptitudes such as creativity, design and pattern recognition will be indis-pensible (Pink, 2005).
Another important issue in the current educational environ-ment is the extent metacognitive and learning skills should be incorporated into science courses, especially at the introductory level. Metacognition is a complex area related to the manage-ment of one’s own learning and is known to be an important domain in student learning and success in chemistry (Cooper & Sandi-Urena, 2009; Rickey & Stacy, 2000; Tsai, 2001). In ad-dition, a recent report made a strong argument for teaching introductory science students less content and more learning skills in an effort to provide a richer learning experience and promote science literacy (Coil, Wenderoth, Cunningham, & Dirks, 2010).
Although robust and lively debates about content, course de-sign and learning skills are important, the fact remains that there are numerous students struggling to succeed in introduc-tory science courses. In many ways, the solution to this prob-lem boils down to what a recent report termed the Carnegie Hall hypothesis, which relates intensive “practice” to the suc-cess of underprepared students (Haak et al., 2011). The authors of this recent report note that effective forms of practice require
students to challenge previous conceptions and explain their thinking. For some students, practice only comes in the form of working additional problems at the end of textbook chapters. Although working problems is imperative, students can benefit from having a wider array of options to practice concept mas-tery and problem-solving strategies. One option is to introduce students to the concept of visual thinking and the role that visu-alization can play in tackling misconceptions and describing thought processes (Gilbert, 2005; Mathewson, 1999; Schönborn & Anderson, 2006; Stranger-Hall, Shockley, & Wilson, 2011). The opportunity to use creativity and right-brain skills to tackle more analytical and quantitative tasks may help a broad range of students, even if some content has to be sacrificed.
External Representations
develop a strategy to get students to construct external repre-sentations and to obtain detailed information from a student that found value in this approach. The next two sections are written by an instructor (JRC) and a student (BWJ) in an introductory chemistry course (general, organic and biochemistry) designed for nursing students. Although the representations described in the manuscript are for a chemistry course, the use of visual thinking and student-generated diagrams should be of interest to educators across disciplines. It should be noted that the type and nature of the external representations described in this manuscript are not typically found in traditional chemistry textbooks. The goal of this approach was to show students how to use their own creativity to generate representations that inte-grate information and prompt them to see the interconnected-ness of topics and ideas.
Role of Instructor (JRC)
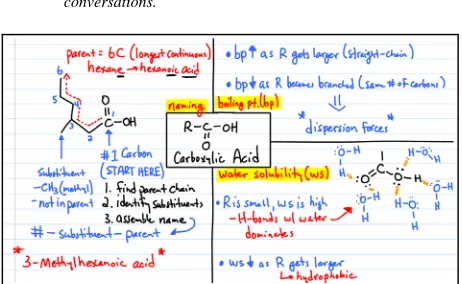
As the instructor, I played two roles in introducing external representations into this introductory chemistry course. The first involves my use of sketches or diagrams during lecture and discussion to provide new ways to present, analyze and inte-grate information and concepts. An example of this type of representation is shown in Figure 1 and is related to the strategy used to perform unit conversions. This diagram, coupled with a few practice problems, was used to introduce the mechanics of solving these types of problems and the steps common to most conversions (one unit is converted to another unit, usually with one or more intermediate steps using conversion factors). Fig-ure 2 shows another representation concerning the naming and properties of carboxylic acids. A textbook typically presents the rules of carboxylic acid nomenclature in text form and physical property information (such as boiling point and water solubility) in tabular form. The diagram in Figure 2 was constructed to integrate these important areas and supplement the textbook and course notes on nomenclature and properties. The purpose of this diagram was to present some essential information on carboxylic acids in a more visual form, although some text is used to make key points.
It is likely that students will draw more educational value from constructing their own diagrams compared to just using ones supplied by an instructor (Gobert & Clement, 1999; Hall et al., 1997; Stranger-Hall et al., 2011). Therefore, the second role I played was mentoring students how to create their own diagrams. Constructing useful diagrams is not easy for most students and incorporating them in lecture or class discussions may not be enough to prompt students to make their own. Class time can be used for students to practice making various exter-nal representations. One approach was to have a class art show where student groups were tasked with making diagrams that illustrate how to solve a particular problem, analyze concepts or
An instructor-generated diagram related to unit conversations.
Figure 2.
An instructor-generated diagram that integrates various topics related to carboxylic acids.
dissect molecules (Figure 3). Another approach I used was to work one-on-one with students during office visits. These are typically the students that need help and can benefit most from a fresh approach to solving problems, organizing information and learning concepts through representations.
Student External Representations (BWJ)
In courses outside the sciences, I was always able to combine my creativity and right-brain aptitudes with more traditional methods (rewriting notes, listening to audio recordings of lec-tures, etc.) to maximize my learning. However, when I started in the Introductory Chemistry course, I was not sure how to use my creative skills to further my learning. I took copious lecture notes, read the textbook and worked the problems at the end of the chapters; however, it was difficult to see how various parts of the chapters fit together and the material seemed complex, foreign and intimidating. This changed when the instructor introduced the concept of creating diagrams to aid in integrat-ing material and solvintegrat-ing problems. This allowed me to tap into my natural disposition of working though problems creatively and visually and I was able to process and retain course infor-mation much more readily and effectively. As a result, I now think more visually when learning science and solving prob-lems and utilize more creative learning methods in courses within my nursing program.
[image:2.595.339.507.83.213.2] [image:2.595.308.539.225.367.2]Figure 3.
A student-generated poster used in a chemistry art show. Posters of this type were generated by student groups to highlight important aspects of chemistry and to demonstrate the different types of diagrams that can be created by students and student groups.
Figure 4.
A student-generated diagram related to molecular weight and mole-to- mass conversions.
units (amu, grams, and moles) throughout the problem by using color coding. When working problems related to molecular weight and the conversion of moles to grams, I was able to refer back to this picture in my mind, linking the periodic table, molecular weight, and the conversion factor, like a map.
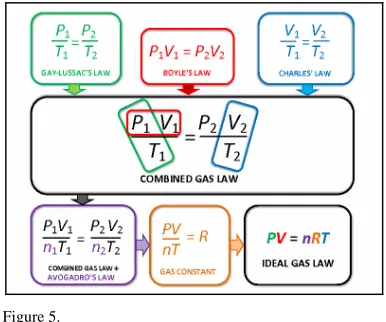
The external representation in Figure 5 was created in order to visualize and retain the Gas Laws by providing the following: 1) a clear, visual picture of how the laws of Gay-Lussac, Boyle, and Charles, are integrated to form the Combined Gas Law and 2) an understanding of how the Combined Gas Law, Avo- gadro’s Law and the gas constant combine to form the Ideal Gas Law. Prior to drawing this external representation, I did not fully appreciate the interconnectedness of the gas laws. They initially appeared to me as separate laws I would be required to memorize from the textbook. It was not until creating this ex-ternal representation that I was able to fully understand how each law contributes to the overall behavior of gases under certain conditions.
External representations can also be used to analyze ques-tions and problems missed on quizzes or examinaques-tions. Many students do not spend enough time investigating the reasons why they missed a particular problem. As a result, they do not take advantage of excellent opportunities to identify weak-
Figure 5.
A student-generated diagram that shows the relationship between the various gas laws.
nesses in logic, content knowledge and problem-solving strate-gies. Creating diagrams can be an effective way to reexamine material and use assessments as a tool to promote learning and not just for measuring learning.
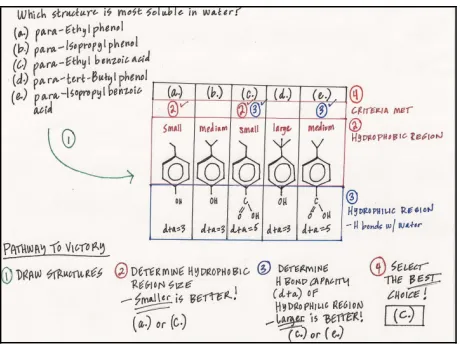
Figure 6 shows a diagram created to analyze a problem missed on an examination. I made this representation with text and structures in order to construct a problem-solving process that allowed me to reverse any inaccuracies or oversights by crafting a detailed pathway to victory (correct answer) through visualization. This simultaneously created a visual memory with the capability to maintain a lasting impression of the fac-tors associated with water solubility. The visual and integrative nature of Figure 6 does not make the question any less complex, just more discernable and accessible. Therefore, constructing these types of diagrams allows me to learn from my mistakes and provides a process to better analyze future questions. Ulti-mately, it is less about getting questions correct on examina-tions and more about learning the concepts associated with my courses and developing habits of the mind that allow me to think critically and creatively.
Conclusion
Students are often presented information, concepts and prob-lems in various forms, but are rarely taught how to organize and integrate material in a way that supports learning (deliberate practice). Students must be able to construct a conceptual framework of ideas and facts and organize information in way that it can be easily recalled and applied (NRC, 2000). This manuscript has addressed many types of external representa-tions and demonstrated how they can be used to organize and integrate information. Also, the roles that instructors and stu-dents can play in generating representations have been de-scribed. Overall, the process of incorporating external repre-sentations into a course can be summarized as Initiation-Op- portunity-Visibility. Typically, students have to be prompted to draw diagrams and instructors can initiate the process by using external representations during class and helping students make
their own diagrams. This can provide an opportunity for
[image:3.595.58.289.82.263.2] [image:3.595.326.519.83.244.2] [image:3.595.58.289.321.466.2]Figure 6.
A student-generated diagram used to analyze a question missed on an examination.
the interconnectedness of complex ideas and problem variables. External representations and visual thinking have the potential
to make complex ideas and problems more accessible and
visi-ble to a broad range of students who struggle in the areas of
information organization and synthesis, pattern recognition or the ability to identify or focus on the hierarchical nature of systems.
These concepts are related Dan Roam’s approach to solving business problems and selling ideas with pictures (Roam, 2008). Roam suggests that the real value of visual thinking is to make complex issues understandable by making them visible, not simpler. This has direct and significant consequences in teach-ing at all levels. Instructors have to teach students to appreciate and analyze the complexities of science, even in introductory courses. Although simplification has its place in teaching and learning, the principles of scientific disciplines can only be broken down so far and the beauty and essence of many sys-tems lies in their complexity.
Acknowledgements
We thank the Department of Chemistry and the College of Science, Engineering and Technology at Murray State Univer-sity for support of this project. The authors also acknowledge a Hewlett-Packard Technology for Teaching Grant and a Micro-soft Tablet PC Technology, Curriculum, and Higher Education Grant for support of tablet-related instructional activities.
References
Coil, D., Wenderoth, M. P., Cunningham, M., & Dirks, C. (2010). Teaching the process of science: Faculty perceptions and an effective methodology. CBE-Life Sciences Education, 9, 524-535.
doi:10.1187/cbe.10-01-0005
Cooper, M. M., & Sandi-Urena, S. (2009). Design and validation of an instrument to assess metacognitive skillfulness in chemistry problem solving. Journal of Chemical Education, 86, 240-245.
doi:10.1021/ed086p240
Derting, T. D., & Cox, J. R. (2008). Using a tablet PC to enhance stu-dent engagement and learning in an introductory organic chemistry course. Journal of Chemical Education, 85, 1638-1643.
doi:10.1021/ed085p1638
Derting, T. L., & Ebert-May, D. (2010). Learner-centered inquiry in undergraduate biology: Positive relationships with long-term student
2-I
Haak, D., HilleRisLambers, J., Pitre, E., & Freeman, S. (2011). In-creased structure and active learning reduce the achievement gap in introductory biology. Science, 332, 1213-1216.
doi:10.1126/science.1204820
Hall, V. C., Bailey, J., & Tillman, C. (1997). Can student-generated illustrations be worth ten thousand words? Journal of Educational Psychology, 89, 677-681. doi:10.1037/0022-0663.89.4.677
Larkin, J. H., & Simon, H. A. (1987). Why a diagram is (sometimes) worth ten thousand words. Cognitive Science, 11, 65-99.
doi:10.1111/j.1551-6708.1987.tb00863.x
Lee, W. T., & Jabot, M. E. (2011). Incorporating active learning tech-niques into a genetics class. Journal of College Science Teaching, 40,
94-100.
Mathewson, J. H. (1999). Visual-spatial thinking: An aspect of science overlooked by educators. Science Education, 83, 33-54.
doi:10.1002/(SICI)1098-237X(199901)83:1<33::AID-SCE2>3.0.CO ;2-Z
Mayer, R. E., & Gallini, J. K. (1990). When is an illustration worth ten thousand words? Journal of Educational Psychology, 82, 715-726.
doi:10.1037/0022-0663.82.4.715
Mazur, E. (2009). Farewell, lecture? Science, 323, 50-51.
doi:10.1126/science.1168927
Milne, A. J. (2007). Entering the interaction age today: Implementing a future vision for campus learning spaces. Educause Review, 42,
13-31.
National Research Council (2000). How people learn: Brain, mind, experience, and school.In Committee on Developments in the Sci-ence of Learning, J. D. Bransford, A. L. Brown, & R. R. Cocking (Eds.) with additional material from the Committee on Learning Re-search and Educational Practice, M. S. Donovan, J. D. Bransford, & J. W. Pellegrino (Eds.), Commission on behavioral and social sci-ences and education, National Research Council. Washington, DC: The National Academy Press.
Pink, D. H. (2005). A whole new mind: Moving from the information age to the conceptual age. New York: Riverhead.
Ramadas, J. (2009). Visual and spatial modes in science learning. In-ternational Journal of Science Education, 31, 301-318.
doi:10.1080/09500690802595763
Rickey, D., & Stacy, A. M. (2000). The role of metacognition in learn-ing chemistry. Journal of Chemical Education, 77, 915-920.
doi:10.1021/ed077p915
Roam, D. (2008). The back of the napkin: Solving problems and selling ideas with pictures. New York: Penguin.
Schönborn, K. J., & Anderson, T. R. (2006). The importance of visual literacy in the education of biochemists. Biochemistry and Molecular Biology Education, 34, 94-102.
doi:10.1002/bmb.2006.49403402094
Stranger-Hall, K. F., Shockley, F. W., & Wilson, R. E. (2011). Teach-ing students how to study: A workshop on information processTeach-ing and self-testing helps students learn. CBE-Life Sciences Education, 10, 187-198. doi:10.1187/cbe.10-11-0142
Suwa, M., & Tversky, B. (2002). External representations contribute to the dynamic construction of ideas. Diagrammatic Representation and Inference, 2317, 149-160. doi:10.1007/3-540-46037-3_33
[image:4.595.58.288.81.253.2]Tversky, B. (2002). What do sketches say about thinking?AAAI Spring Symposium on Sketch Understanding, Menlo Park, CA.