Original citation:
Melo, Miguel, Bessa, Maximino, Debattista, Kurt and Chalmers, Alan. (2014) Evaluation of HDR video tone mapping for mobile devices. Signal Processing: Image Communication, 29 (2). pp. 247-256.
Permanent WRAP URL:
http://wrap.warwick.ac.uk/67225
Copyright and reuse:
The Warwick Research Archive Portal (WRAP) makes this work by researchers of the University of Warwick available open access under the following conditions. Copyright © and all moral rights to the version of the paper presented here belong to the individual author(s) and/or other copyright owners. To the extent reasonable and practicable the material made available in WRAP has been checked for eligibility before being made available.
Copies of full items can be used for personal research or study, educational, or not-for-profit purposes without prior permission or charge. Provided that the authors, title and full bibliographic details are credited, a hyperlink and/or URL is given for the original metadata page and the content is not changed in any way.
Publisher’s statement:
© 2014, Elsevier. Licensed under the Creative Commons Attribution-NonCommercial-NoDerivatives 4.0 International http://creativecommons.org/licenses/by-nc-nd/4.0/.
A note on versions:
The version presented here may differ from the published version or, version of record, if you wish to cite this item you are advised to consult the publisher’s version. Please see the ‘permanent WRAP URL’ above for details on accessing the published version and note that access may require a subscription.
Evaluation of HDR video tone mapping for mobile
devices
Miguel Meloa,b, Maximino Bessaa,b, Kurt Debattistac, Alan Chalmersc,d
aUniversidade de Tr´as-os-Montes e Alto Douro, Portugal bINESC-TEC, Portugal
cWMG, University of Warwick, United Kingdom dgoHDR Ltd., United Kingdom
Abstract
Tone mapping operators (TMOs) allow the visual appearance of High Dy-namic Range (HDR) video to be reproduced on Low DyDy-namic Range (LDR) displays. While several studies have been made to compare the performance of different TMOs on standard displays, there is only one preliminary study that take into account the characteristics of Small Screen Devices, common on mobile platforms. Due to the unique characteristics of mobile devices, the variety of viewing conditions where they are used, and the fact that they are becoming so widespread, it is important to identify what is the best method to deliver HDR video content to these devices.
This paper presents an evaluation of HDR video using and HDR display as reference as well as six state-of-the-art HDR video tone mappers by con-ducting a psychophysical experiment where participants were asked to rank the tone mappers applied to different HDR video footage. A comparison was made between tone mapped HDR video footage shown on a tablet and an LCD display compared with the same HDR video footage shown on an HDR display. This study shows interesting results like the fact that for each dis-play results obtained are different but the the preferred TMOs order remains the same.
Keywords: HDR Video, TMO Evaluation, Mobile Devices
1. Introduction
conven-tional imaging technology. HDR can benefit all the aspects of digital imaging including diverse areas such as security, entertainment, art, scientific research and health. With HDR techniques, it is possible deliver an enhanced viewing experience to users by providing the full dynamic range that the Human Vi-sual System (HVS) can perceive at any level of adaptation. To achieve this it is necessary to ensure the HDR content is preserved from the moment of capture until its subsequent display.
It is already possible, for a person who has a HDR display, to enjoy all the benefits of HDR technology. However the majority of displays available are not HDR but standard or low dynamic range (LDR) displays which means that is necessary to apply a Tone Mapping Operator (TMO) to the HDR content in order to show it on these displays. Several TMOs have been proposed that take into consideration human visual perception or image characteristics, but only a few of them have been designed to deal with HDR video. Furthermore, although some previous work has evaluated the display of still HDR images on mobile devices and shown what characteristics of the image have to be considered to obtain a better quality when using a Small Scale Device SSD[1], this did not consider HDR video.
As mobile devices are rapidly becoming the leading platform for the con-sumption of multimedia content [2], there is an urgent need to ensure an optimal experience when viewing HDR content on typical mobile devices screens. Typical mobile devices raise new concerns that typical displays do not like, for example, that the viewing angle and distance are considerably different or the fact that they are smaller. Although the evolution on the mobile devices displays area, the majority of mobile device displays are also less powerful than the conventional regular size displays what can contribute for more quality issues when reproducing contents. In this paper we present the results of the evaluation of six HDR video TMOs that focus on different properties. The TMOs evaluated were: Spatio-Temporal based on a Retina model [3], the model of visual adaptation [4], the method proposed by [5] that encodes HDR video using a model of human cones, the display adap-tive technique [6], a time-dependent visual adaptation approach [7], and the TMO proposed by Boitard et al. [8] that takes account temporal coherency. This evaluation intends to determine:
• If the participants preference of the tone mapper is the same for the LCD and mobile device displays.
The paper is structured as follows: In the next section we provide a brief description of the chosen TMOs, and previous work on evaluations of TMOs. In section 3 the experimental setup is explained. Section 4 presents all the results gathered from the experiments, and the results are discussed. Finally conclusions are presented and avenues for future work discussed.
2. Related Work
TMOs can be divided into two categories: global operators and local operators[9]. Global operators are spatially invariant and they process the image as a whole, mapping all the pixels of an image equally. These operators use image statistics to optimize the dynamic range reduction. Some common statistics used are the maximum luminance and logarithmic or arithmetic averages. Global operators are simple and fast and they preserve the global contrast of the image, but are unable to maintain the local contrast of the image which can result in a loss of details in some regions. In this category of TMOs we have, for instance, the Model of Visual Adaptation TMO [4], the Brightness Reproduction TMO [10], Quantization Techniques TMO [11] and the Histogram Adjustment TMO [12].
Local operators, on the other hand, are applied differently to each pixel, taking into account a set of surrounding pixels to perform the calculation for that pixel. One of the advantages of local operators is that they attempt to preserve both global and local contrast that can lead to a better image quality since the HVS is sensitive to local contrast. The major drawbacks of local TMOs are that they are typically complex and thus take more com-putational effort (and therefore may not be feasible for mobile devices), and they can introduce artefacts, for example halos [9]. Some examples of local TMOs are Spatially Non-uniform Scaling TMO [13], the Multi-scale Model of Adaptation and Spatial Vision for Realistic Image Display TMO [14], the Photographic Tone Reproduction TMO [15] or the Tone Mapping Algorithm for High Contrast Images TMO [16].
2.1. TMO Evaluation
As a large number of TMOs have been proposed over two decades, some form of evaluation is needed to determine which TMOs perform better under different circumstances. To carry out such an evaluation, two approaches are possible: Error metrics and psychophysical experiments.
Error metrics methods are objective. They are based on theoretical mod-els and use computers to compare images. For example, the comparison can be made based on differences in individual pixel values, or using metrics that simulate the HVS in order to identify which aspects of the image would be perceived by the HVS[9]. A problem with this approach is that the HVS is complex and hard to simulate but some studies like [17] are becoming that possible. The most used techniques of this type are the VDP (Visual Difference Predictor)[18] and HDR-VDP that predicts visible differences in HDR images[19][20]. The main issue when referring to objective evaluations is that they are mainly addressed to still images and thus, they can lead to inaccurate results when the purpose is to evaluate HDR video.
Psychophysical experiments, on the other hand, are subjective and based on studies with participants that are asked to give feedback about a compar-ison of images. Typically these experiments take place in a room where the experimental team has control of environmental conditions. The evaluation can be made based on different rating methods. One possible approach is to have the participant make a pairwise comparison where he is confronted with one reference of the image and two other images of the same scene in order to identify which one of these two images reproduces the content most similar to the reference[9]. Another possibility, which is the one we used in our experiments, is to have the participants rank the tone mapped images against a reference. Previous TMO evaluations that have used psychophysi-cal experiments include work by [21], [22], [23], [24], [25], [26].
The studies conducted by Drago et al. [21] were one of the first that aimed to evaluate TMOs. Four different scenes were considered. The comparison was made between seven TMOs. Eleven participants undertook a pairwise comparison of all the possible combinations of the TMOs applied to the four scenes. The comparison was made by showing each participant two images with different TMOs applied, each one on a CRT screen.
consisted of a paired comparison in which the participant sat in front of an HDR monitor (the reference) that had two LDR displays, one on each side, reproducing the same image as the reference but with different TMOs applied on each.
Yoshida et al. [23] also conducted a set of experiments that consisted of a comparison between HDR images displayed on LDR displays and the real world scene. The comparisons were made using seven different TMOs.
Kuang et al. [24] conducted studies to evaluate the preference and accu-racy of HDR rendering algorithms. These studies involved 33 participants and considered six TMOs. These were divided in three experiments. The first experiment used a paired comparison, the second one a ranking scale, and the third used a ranking scale to compare the real world scene with the tone mapped image.
Cadik [25] also used a ranking-based experiment with a real world scene reference and a similar experiment without the reference. These studies evaluated 14 TMOs on 3 different scenes.
More recently Petit et al.[26] investigated images within virtual environ-ments. These studies consisted of two experiments that tested TMOs not on predetermined scenes but rather within a virtual environment with dy-namically changing environmental conditions. In the first experiment 5 HDR videos were tone mapped using 8 different TMOs. Fourteen participants had to decide which TMO they felt was more realistic without having a reference. For the second experiment 9 HDR photographs were tone-mapped with the same operators and presented to 13 further participants. The participants had to rate the realism of each tone-mapped photograph with the physical scene.
Urbano et al. [1] evaluated several TMOs on different size displays. The experiment consisted of a pairwise comparison of tone mapped images with a real scene reference. Three different displays were used: two 17” displays, and one 2.8” display. The aim was to analyse the rankings for each display and show that for small displays the rankings are different and thus different TMOs need to be developed for mobile devices.
state-of-the-art TMOs.
The experiment described in this paper was preceded by a preliminary study [27] that considered the same six TMOs using the same HDR video footage. On this study the users had to rank the different tone mapped HDR video shown in a tablet having the HDR as reference. This study had the goal to gather some initial data about the preferred TMOs for watching HDR video on mobile devices.
2.2. Tone Mapping Operators considered
The six TMOs used in our evaluation are the following:
Benoit: The spatio-temporal TMO proposed in [3] is based on a model of the retina local adaptation properties developed by Meylan et al. [28] and is complemented by spatio-temporal filters of the retina. This work simulates some of the foveal retina functionalities and includes temporal coherency and thus is able to avoid flicker.
Boitard: This paper [8] investigated temporal coherency for video tone map-ping that preserves the overall contrast of the video. To achieve this, the authors considered perception consistency of an object throughout the video and strived to preserve the temporal overall contrast con-sistency. The TMO processes a frame in two steps. The first step processes each frame of the video individually, while the second step considers the luminance of each frame taking into account the lighting within the whole HDR video.
Ferwerda: The TMO developed by Ferwerda et al. [4], is based on a model of visual adaptation from psychophysical experiments that considered various aspects of the human visual system such as visibility, visual acu-ity and colour appearance. This operator uses TVI functions for mod-elling photopic and scotopic vision. The mesotopic range is achieved by a linear combination of both photopic and scotopic vision.
Mantiuk: The TMO proposed by [6] aims to minimise the visible contrast distortions for a wide range of devices based on a model of the HVS. The TMO takes into account the environment luminance levels and the display characteristics, such as the peak luminance of the display or the reflectivity of a screen. With these parameters it is possible to calibrate the tone mapping process in order to optimise the results for situations with different variables. This can become useful if we can properly get the environmental variables since with mobile devices the environmental variables can be constantly changing.
Pattanaik: Known as the time-dependent visual adaptation TMO [7], this method takes into consideration that the HVS does not adapt instantly to big changes in luminance intensities. This TMO includes these ap-pearance changes to match the user’s visual responses so he can expe-rience the viewing of a displayed scene as he would in the real world scene.
3. Experimental Framework
The psychophysical experiments in this paper consisted of ranking 7 HDR video footages tone mapped by the 6 TMOs compared to a reference of the same HDR video footage shown on an HDR display. The tone mapped footage was shown on a standard LDR display and a tablet to determine if the rankings were different between the displays.
3.1. Material and Methods
The reference HDR display used in the experiments was a 37” DR37-P from Brightside[29]. The LDR display was a Westinghouse[30] 37” LCD (the same from panel as the DR37-P), and the tablet an Apple iPad4[31]. Regarding the viewing angle, the HDR display is around 40 ◦horizontal and 15◦vertical while the LDR display values are approximately 160◦horizontal and 120 ◦vertical. The tablet viewing angle is approximately 175 ◦. Table 1 lists technical specifications of each display used.
Table 1: Technical specifications of the displays used in the experiments
HDR Display LDR Display Tablet
Brand Brightside Westinghouse Apple
Model DRP37-P LVM-37w1 iPad 4 (A1458)
Size 37” 37” 9.7”
Resolution 1920x1080 1920x1080 2048x1536
Contrast Ratio 200 000:1 1 000:1 877:1
Maximum Luminance 4 000 cd/m2 550 cd/m2 476 cd/m2 Minimum Luminance 0 cd/m2 0.55 cd/m2 0.48 cd/m2
Table 2: Technical details of the videos
Lenght (seconds)
Average Luminance
Average Max. Luminance
Average Min. Luminance
CGRoom 7 4.27 290.80 0
Jaguar 13 5.23 3967.16 0.06
Kalabsha 11 0.45 0.81 0
Morgan Lovers 15 0.04 0.52 0
IDL Wedding 10 0.38 5.58 0.01
Explosion 8 0.08 0.86 0
Medical 14 0.06 0.61 0
footages are exposed on Table 2 (the luminance values refer to the relative luminance in cd/m2).
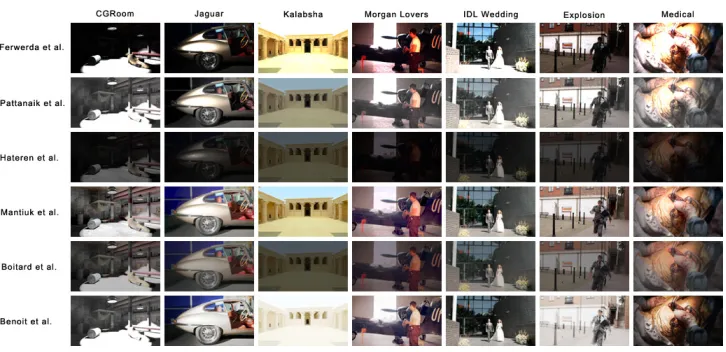
CGRoom: A scene in a garage in which a barrel falls from a tall shelf that is in the dark and after falling rolls through a well-lit part of the scene.
Jaguar: This scene shows a Jaguar e-type car, where the camera moves from the back to the front. The video has spots with high luminance levels due to the spotlights directly pointed at the car, together with some dark areas.
Figure 1: Thumbnails of the videos used for the experiments
Morgan Lovers: This is the first short film that was shot, manipulated and displayed entirely in HDR. It was a joint venture between The Univer-sity of Warwick, goHDR, Vermillion films, Morgan cars, the Boultbee Flight Academy, and Vintage Flyers, Cotswold Airport.
IDL wedding: This clip was taken at the International Digital Laboratory located at the University of Warwick and shows a wedding couple ex-iting the building. The captured dynamic range enables all the details of the bride’s dress to be distinguished even as she steps into the bright sunshine, and the person behind the glass door, and the reflection of the camera crew, to be seen.
Explosion: This footage was shot with a Canon 5D Mark II. It shows 2 people running and then an explosion occurs. It is a scene from the short film. “Delivery Boy”; a joint venture between the University of Warwick, goHDR, and Entanglement Productions.
For this experiment ranking was over rating and pairwise comparison. This because in this experiments we intended to achieve clear results regard-ing the order of preference of TMOs. With ratregard-ing method this could be compromised since it could result in a narrow distribution of ratings and the ratings could be also compromised due to the variation in the response styles of the participant since he can be more predisposed to rate all items equally or only give low or high scores. Despite pairwise comparison could be used to infer ranks it was also discarded since it would require more time and comparisons to reproduce similar results. As so, ranking was the method that could report better the TMOs preference order since it guarantees that each ranked item has a unique value through the ranking of all tone-mapped HDR videos footages for each scene directly made by the participants.
Regarding the variables associated with the experiments, as independent variables they were the displays, the TMOs used and the experiments soft-ware used. Regarding the dependent variables, they were the rankings of the TMOs preference made by the participants.
To rank the 7 tone-mapped HDR video footages it was used an experimen-tal software that for each scene presented each participant with thumbnails of the tone-mapped contents used. The thumbnails of the tone-mapped con-tents were presented on the left side of the HDR screen and a thumbnail of the reference video in the centre of the screen. On the right side of the screen there were 6 empty slots numbered from 1 to 6. The participants were asked to drag and drop the thumbnails of the tone-mapped HDR videos according to how similar they thought each was compared to the reference. When a participant double-clicked on any of the thumbnails the correspondent tone mapped video played on the LDR display simultaneously as the HDR video played on the HDR display. Before starting the evaluations it was given to each participant some time to adapt to the ambient luminance of the room. A screen shot of the application used is shown in Figure 2.
3.2. Apparatus
Figure 2: Screen shot of the experimental software
Figure 3: Experimental setup scheme
gave the participants some time to adapt to the ambient luminance of the room. Figure 3 shows the general setup of the experiment.
[image:12.612.270.343.323.427.2]3.3. Statistical analysis
Each video was tone mapped by the 6 different TMOs. A total of 30 participants, 17 men and 13 women with ages between 19 and 28 years, were randomly assigned between the LDR and tablet experiment. This gave a total of 15 evaluations for each video on each device, and an overall total of 2100 comparisons.
For analysing statistically the results it was used the Kendall Coefficient of agreement used for calculate the consistency of the results between all the ranks made by the participants.
4. Results
The results from the comparisons made to each HDR video footage are available as supplementary data. These individual results show that for CGRoom the rankings are similar for the LDR and mobile displays with Man-tiuk, Benoit and Boitard being the most preferred. With Jaguar the rankings change with Pattanaik being the most highly ranked, Mantiuk being second on the mobile device. Regarding the LDR display Mantiuk and Boitard tied as second most preferred TMO. With computer generated footage enti-tled Kalabsha the results obtained indicate that Mantiuk was the preferred TMO followed by Pattanaik and Boitard. In the evaluation made for Mor-gan Lovers Mantiuk and Boitard were ranked first for the LDR display, while Boitard was ranked clearly first for the mobile device. The results obtained with the Explosion footage show that Mantiuk and Boitard were preferred for both the LDR and mobile displays. For the IDL Wedding footage Man-tiuk was the most preferred TM Regarding de Medical clip, it has provided interesting results with a different ranking order between the LDR and mo-bile displays, with Mantiuk preferred on the LDR display and Boitard on the mobile device display.
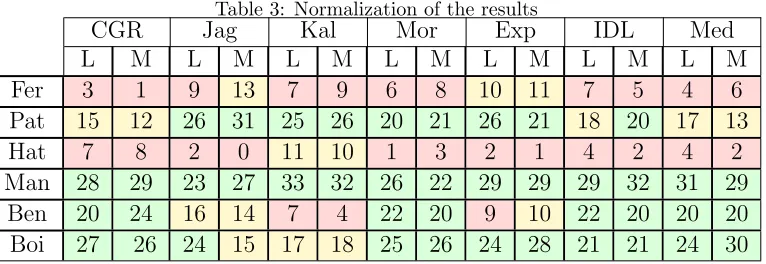
To provide a better overview of the results, a score is allocated for each ranking. Each rank of first is given a score of 5, second a score of 4, and so on until sixth place with a score of 0. These scores are then normalised into percentages. Table 3 shows these percentages. In the table, the headers refer to the TMO and L=LDR, M=Mobile displays. The percentages greater than 20% are show with a green background, between 10% and 20% a yellow background, and under 10% red.
Inter-Table 3: Normalization of the results
CGR Jag Kal Mor Exp IDL Med
L M L M L M L M L M L M L M
Fer 3 1 9 13 7 9 6 8 10 11 7 5 4 6
Pat 15 12 26 31 25 26 20 21 26 21 18 20 17 13
Hat 7 8 2 0 11 10 1 3 2 1 4 2 4 2
Man 28 29 23 27 33 32 26 22 29 29 29 32 31 29
Ben 20 24 16 14 7 4 22 20 9 10 22 20 20 20
Boi 27 26 24 15 17 18 25 26 24 28 21 21 24 30
CGR: CGRoom, Jag: Jaguar, Kal: Kalabsha, Mor: Morgan Lovers, Exp: Explosion, IDL: IDL Wedding, Med: Medical
estingly Benoit was far less preferred in Kalabsha, Explosion and Jaguar, while Boitard was less preferred in Kalabsha. This is possibly because, Kalabsha is a computer generated HDR video in which there is no sudden change of illumination. Pattanaik performs well, but less so in the three clips, CGRoom, Wedding, and Medical in which the maximum luminance remains consistent throughout the whole sequence, whereas in the other footage, the maximum luminance is not the same for every frame.
Ferwerda and Hateren were preferred the least. Ferwarda did moderately well in Explosion which, as it was shot with a Canon 5D, only has 12 f-stops, while Hateren did modestly with Kalabsha with its no sudden changes in illumination.
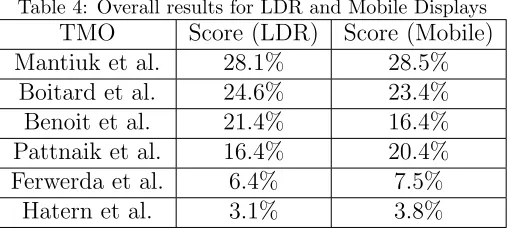
Table 4 show the overall results, using the scoring system, for the LDR and mobile display. These results show that despite some similarity, the preferences do change depending on whether the LDR display or mobile device was being considered. In particular Pattanaik is more preferred on the mobile device.
4.1. Results obtained for the LDR display
[image:14.612.117.500.135.267.2]Table 4: Overall results for LDR and Mobile Displays
TMO Score (LDR) Score (Mobile)
Mantiuk et al. 28.1% 28.5%
Boitard et al. 24.6% 23.4%
Benoit et al. 21.4% 16.4%
Pattnaik et al. 16.4% 20.4%
Ferwerda et al. 6.4% 7.5%
[image:15.612.138.475.287.400.2]Hatern et al. 3.1% 3.8%
Table 5: Results obtained for the LDR display
95% Confidence Interval TMOs Mean Std. Error Lower Bound Upper Bound
Benoit 3.583 .102 3.375 3.791
Boitard 2.350 .113 2.119 2.581
Ferwerda 4.917 .097 4.718 5.116
Hateren 5.500 .075 5.346 5.654
Mantiuk 2.017 .098 1.815 2.218
Pattanaik 2.733 .074 2.581 2.885
4.2. Results obtained for the mobile device display
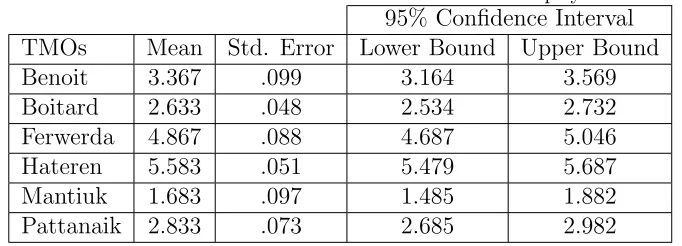
Table 6 show the results obtained for the mobile device displays and are similar to the results obtained for the LDR display. The order of preference is the same between both displays but in the case of the mobile device display the differece is that between the second and the third ranked TMOs (Boitard and Pattanaik) statistically there is no significant difference. For the mobile device display the Kendall coefficient of concordance is 0.890, p <0.05.
4.3. Results Across Displays
Table 7 show the results obtained for the TMOs preference across displays. As can be seen, the order is similar to the orders obtained for the LDR and
Figure 4: Experimental setup scheme
Mantiuk Boitard Pattanaik Benoit Ferwerda Hateren
——————— ———— ———— ————
Table 6: Results obtained for the mobile device display
95% Confidence Interval TMOs Mean Std. Error Lower Bound Upper Bound
Benoit 3.367 .099 3.164 3.569
Boitard 2.633 .048 2.534 2.732
Ferwerda 4.867 .088 4.687 5.046
Hateren 5.583 .051 5.479 5.687
Mantiuk 1.683 .097 1.485 1.882
Pattanaik 2.833 .073 2.685 2.982
Table 7: Results Across Displays
95% Confidence Interval TMOs Mean Std. Error Lower Bound Upper Bound
Benoit 3.475 .071 3.333 3.617
Boitard 2.492 .061 2.369 2.615
Ferwerda 4.892 .065 4.761 5.023
Hateren 5.542 .045 5.451 5.633
Mantiuk 1.850 .069 1.712 1.988
Pattanaik 2.783 .052 2.679 2.887
for the mobile displays. The results obtained show that the prefered TMO is Mantiuk, followed by Boitard, Pattanaik, Benoit, Ferwerda and Hateren. The results obtained show also that the order of the TMOs is statistically significant.
4.4. Tests of Between-Subjects Effects
The results of the tests between-subject effects (Table 8) reveal that there are different significance between displays but between groups the the dif-ference is not significant. Another fact is that there is also a significant difference in the interaction between display and TMOs.
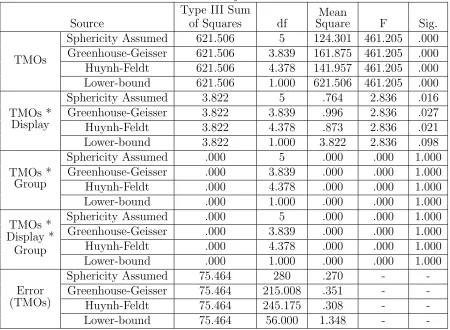
4.5. Tests of Within-Subjects Effects
Table 8: Tests of Between-Subjects Effects
Source
Type III Sum
of Squares df SquaresMean F Sig.
Intercept 4424.011 1 4424.011 615090.097 .000
Display .044 1 .044 6.179 .016
Group .000 1 .000 .000 1.000
Display * Group .000 1 .000 .000 1.000
Error .403 56 .007 -
-Table 9: Tests of Between-Subjects Effects
Source
Type III Sum
of Squares df
Mean
Square F Sig.
TMOs
Sphericity Assumed 621.506 5 124.301 461.205 .000
Greenhouse-Geisser 621.506 3.839 161.875 461.205 .000
Huynh-Feldt 621.506 4.378 141.957 461.205 .000
Lower-bound 621.506 1.000 621.506 461.205 .000
TMOs * Display
Sphericity Assumed 3.822 5 .764 2.836 .016
Greenhouse-Geisser 3.822 3.839 .996 2.836 .027
Huynh-Feldt 3.822 4.378 .873 2.836 .021
Lower-bound 3.822 1.000 3.822 2.836 .098
TMOs * Group
Sphericity Assumed .000 5 .000 .000 1.000
Greenhouse-Geisser .000 3.839 .000 .000 1.000
Huynh-Feldt .000 4.378 .000 .000 1.000
Lower-bound .000 1.000 .000 .000 1.000
TMOs * Display *
Group
Sphericity Assumed .000 5 .000 .000 1.000
Greenhouse-Geisser .000 3.839 .000 .000 1.000
Huynh-Feldt .000 4.378 .000 .000 1.000
Lower-bound .000 1.000 .000 .000 1.000
Error (TMOs)
Sphericity Assumed 75.464 280 .270 -
-Greenhouse-Geisser 75.464 215.008 .351 -
-Huynh-Feldt 75.464 245.175 .308 -
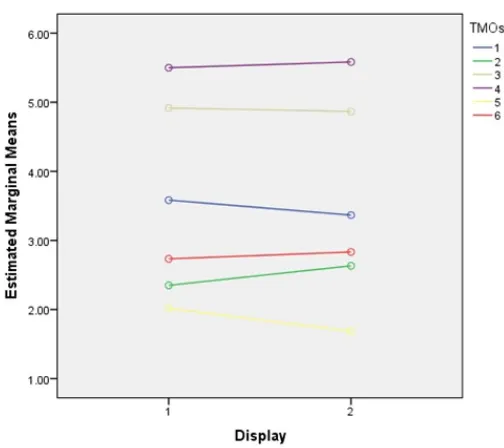
[image:17.612.111.561.327.657.2]-Figure 5: Estimated Marginal Means
Despite the significant difference between displays on the TMOs prefer-ence Figure 5 show that the differprefer-ences are not so relevant.
5. Discussion
The study made by Urbano et al. [1] that also considered SSDs concluded that for LCD and CRT displays the TMO preference were the same but when comparing those displays with a SSD the results were significantly different. On this study it were considered two different scenes and the preference order of the TMOs between the two scenes was similar. The only difference between the two scenes on the TMOs preference order was between third and fourth ranked TMOs that switched places.
[image:18.612.178.430.121.345.2]6. Conclusions and Future Work
The results are not uniform for all the evaluations; although one TMO may be the best ranked for one video it is not the best ranked for all videos. The best TMO for each video depends on the attributes of the video, for example, sudden light changes, movement, mainly dark or bright scenes.
Future work needs to consider more precisely what factors in a video influences the preference for a TMO, and whether indeed sequences within one video may benefit from different TMOs. A number of new HDR video sequences with specific test conditions, such as mainly bright and dark areas, in-door, outdoor etc. will need to be investigated.
Furthermore, as mobile devices are typically used in a variety of lighting conditions, in the shadow, bright sunshine etc., the preferred TMO also needs to be considered for these different conditions.
Acknowledgements
We would like to thank to the authors of the TMOs for their help with the code for tone mapping the frames used in the experiments and the par-ticipants for taking part in the study.
This work is partially supported by the Portuguese government, through the National Foundation for Science and Technology - FCT (Fundao para a Cincia e a Tecnologia) through the project SFRH/BD/76384/2011 entitled HDR Video for Mobile Devices”.
This work is also supported by the ICT COST Action IC1005 “HDRi: The digital capture, storage, transmission and display of real-world lighting”.
References
[1] C. Urbano, L. Magalhes, J. Moura, M. Bessa, A. Marcos, A. Chalmers, Tone mapping operators on small screen devices: An evaluation study, Computer Graphics Forum 29 (2010) 2469–2478.
[2] ITU, The world in 2011: Ict facts and figures, http://www.itu.int/ ITU-D/ict/facts/material/ICTFactsFigures2011.pdf, 2011. Ac-cessed: 16/02/2013.
[4] J. A. Ferwerda, S. N. Pattanaik, P. Shirley, D. P. Greenberg, A model of visual adaptation for realistic image synthesis, in: Proceedings of the 23rd annual conference on Computer graphics and interactive tech-niques, SIGGRAPH ’96, ACM, New York, NY, USA, 1996, pp. 249–258.
[5] J. H. Van Hateren, Encoding of high dynamic range video with a model of human cones, ACM Trans. Graph. 25 (2006) 1380–1399.
[6] R. Mantiuk, S. Daly, L. Kerofsky, Display adaptive tone mapping, ACM Trans. Graph. 27 (2008) 68:1–68:10.
[7] S. N. Pattanaik, J. Tumblin, H. Yee, D. P. Greenberg, Time-dependent visual adaptation for fast realistic image display, in: Proceedings of the 27th annual conference on Computer graphics and interactive tech-niques, SIGGRAPH ’00, ACM Press/Addison-Wesley Publishing Co., New York, NY, USA, 2000, pp. 47–54.
[8] R. Boitard, K. Bouatouch, R. Cozot, D. Thoreau, A. Gruson, Temporal coherency for video tone mapping, in: Applications of Digital Image Processing XXXV, volume 8499 of Proc. SPIE, pp. 84990D–84990D–10.
[9] F. Banterle, A. Artusi, K. Debattista, A. Chalmers, Advanced High Dynamic Range Imaging: Theory and Practice, AK Peters, Ltd (CRC Press), first edition, 2011.
[10] J. Tumblin, H. Rushmeier, Tone reproduction for realistic images, Com-puter Graphics and Applications, IEEE 13 (1993) 42–48.
[11] C. Schlick, Quantization techniques for visualization of high dynamic range pictures, in: G. Sakas, S. Mller, P. Shirley (Eds.), Photorealistic Rendering Techniques, Focus on Computer Graphics, Springer Berlin Heidelberg, 1995, pp. 7–20.
[12] G. W. Larson, G. W. Larson, H. Rushmeier, H. Rushmeier, C. Piatko, C. Piatko, A visibility matching tone reproduction operator for high dy-namic range scenes, IEEE Transactions on Visualization and Computer Graphics 3 (1997) 291–306.
[14] S. N. Pattanaik, J. A. Ferwerda, M. D. Fairchild, D. P. Greenberg, A multiscale model of adaptation and spatial vision for realistic image display, in: Proceedings of the 25th annual conference on Computer graphics and interactive techniques, SIGGRAPH ’98, ACM, New York, NY, USA, 1998, pp. 287–298.
[15] E. Reinhard, M. Stark, P. Shirley, J. Ferwerda, Photographic tone re-production for digital images, ACM Trans. Graph. 21 (2002) 267–276.
[16] M. Ashikhmin, A tone mapping algorithm for high contrast images, in: Proceedings of the 13th Eurographics workshop on Rendering, EGRW ’02, Eurographics Association, Aire-la-Ville, Switzerland, Switzerland, 2002, pp. 145–156.
[17] R. Br´emond, J.-P. Tarel, E. Dumont, N. Hautire, Vision models for image quality assessment: one is not enough, Journal of Electronic Imaging 19 (2010) 043004–043004–14.
[18] S. Daly, Digital images and human vision, MIT Press, Cambridge, MA, USA, 1993, pp. 179–206.
[19] R. Mantiuk, K. Myszkowski, H.-P. Seidel, Visible difference predicator for high dynamic range images, in: Proceedings of IEEE International Conference on Systems, Man and Cybernetics, pp. 2763–2769.
[20] R. Mantiuk, S. Daly, K. Myszkowski, H.-P. Seidel, Predicting visible differences in high dynamic range images - model and its calibration, in: B. E. Rogowitz, T. N. Pappas, S. J. Daly (Eds.), Human Vision and Electronic Imaging X, IS&T/SPIE’s 17th Annual Symposium on Electronic Imaging (2005), volume 5666, pp. 204–214.
[21] F. Drago, W. Martens, K. Myszkowski, H.-P. Seidel, Perceptual evalua-tion of tone mapping operators with regard to similarity and preference, Research Report MPI-I-2002-4-002, Max-Planck-Institut f¨ur Informatik, Stuhlsatzenhausweg 85, 66123 Saarbr¨ucken, Germany, 2002.
[23] A. Yoshida, V. Blanz, K. Myszkowski, H. peter Seidel, Perceptual eval-uation of tone mapping operators with real-world scenes, in: Human Vision & Electronic Imaging X, SPIE, SPIE, 2005, pp. 192–203.
[24] J. Kuang, H. Yamaguchi, C. Liu, G. M. Johnson, M. D. Fairchild, Eval-uating hdr rendering algorithms, ACM Trans. Appl. Percept. 4 (2007).
[25] M. ˇCad´ık, M. Wimmer, L. Neumann, A. Artusi, Evaluation of HDR tone mapping methods using essential perceptual attributes, Computers & Graphics 32 (2008) 330–349.
[26] J. Petit, R. Br´emond, A. Tom, Evaluation of tone mapping operators in night-time virtual worlds, Virtual Reality (2012) 1–10.
[27] M. Melo, M. Bessa, K. Debattista, A. Chalmers, Evaluation of tone mapping operators for HDR video on small form factor displays, in: M. Bessa, R. Manituk (Eds.), HDRi2013 - First International Conference and SME Workshop on HDR imaging.
[28] L. Meylan, D. Alleysson, S. S¨usstrunk, Model of retinal local adaptation for the tone mapping of color filter array images, Journal of the Optical Society of America A 24 (2007) 2807–2816.
[29] Wikipedia, brightside technologies, http://en.wikipedia.org/wiki/ BrightSide_Technologies_Inc., 2013. Accessed: 18/02/2013.
[30] Westinghouse digital, http://legacywd.com/details.aspx?itemnum= 56, 2013. Accessed: 16/02/2013.
[31] Apple, http://www.apple.com/ipad/specs/, 2013. Accessed: 13/02/2013.