RESEARCH ARTICLE
Combined use of two supervised learning algorithms to model sea
turtle behaviours from tri-axial acceleration data
L. Jeantet1,*, F. Dell’Amico2, M.-A. Forin-Wiart1, M. Coutant2, M. Bonola1, D. Etienne3, J. Gresser4, S. Regis1, N. Lecerf1, F. Lefebvre1, B. de Thoisy5, Y. Le Maho1, M. Brucker1, N. Châtelain1, R. Laesser1, F. Crenner1, Y. Handrich1, R. Wilson6and D. Chevallier1
ABSTRACT
Accelerometers are becoming ever more important sensors in animal-attached technology, providing data that allow determination of body posture and movement and thereby helping to elucidate behaviour in animals that are difficult to observe. We sought to validate the identification of sea turtle behaviours from accelerometer signals by deploying tags on the carapace of a juvenile loggerhead (Caretta caretta), an adult hawksbill (Eretmochelys imbricata) and an adult green turtle (Chelonia mydas) at Aquarium La Rochelle, France. We recorded tri-axial acceleration at 50 Hz for each species for a full day while two fixed cameras recorded their behaviours. We identified behaviours from the acceleration data using two different supervised learning algorithms, Random Forest and Classification And Regression Tree (CART), treating the data from the adult animals as separate from the juvenile data. We achieved a global accuracy of 81.30% for the adult hawksbill and green turtle CART model and 71.63% for the juvenile loggerhead, identifying 10 and 12 different behaviours, respectively. Equivalent figures were 86.96% for the adult hawksbill and green turtle Random Forest model and 79.49% for the juvenile loggerhead, for the same behaviours. The use of Random Forest combined with CART algorithms allowed us to understand the decision rules implicated in behaviour discrimination, and thus remove or group together some‘confused’or under-represented behaviours in order to get the most accurate models. This study is the first to validate accelerometer data to identify turtle behaviours and the approach can now be tested on other captive sea turtle species.
KEY WORDS: Accelerometry, Endangered species, Supervised learning algorithms
INTRODUCTION
The study of animal behaviour has historically been limited by the difficulty of observing individuals in the wild, and also because human presence can change animal behaviour (Schneirla, 1950; Jack
et al., 2008). In fact, direct observation is often considered impossible in far-ranging, shy or nocturnal species. These limitations have, in part, catalysed the development of ‘biotelemetry’, where study animals wear systems that transmit data to remote receiving stations (Cagnacci et al., 2010; Tomkiewicz et al., 2010). Such systems can help researchers determine animal location, and therefore space use, and movement without bias due to disturbance related to human observation (Kooyman, 2003; Hart and Hyrenbach, 2010; Hubel et al., 2016). Beyond this, when treated with state-space models, location data can also lead to powerful inferences relating to behaviour (Chevallier et al., 2010; Dodge et al., 2014; Chambault et al., 2015, 2017). A development over the last 20 years, however, has been the use of tag-linked accelerometers, which can be used to produce a recording of the change in body velocity, and this has proven particularly powerful in providing data that enable us to elucidate animal behaviour over temporal scales of seconds (Yoda et al., 1999; Shepard et al., 2008; Brown et al., 2013). Indeed, many now regard the use of accelerometers in animal-attached tags as pivotal in allowing us to understand how animals change behaviour as a function of space (Narazaki et al., 2009) and time (Watanabe et al., 2004, 2012; Fossette et al., 2012; Shamoun-Baranes et al., 2012), a concept that was considered impossible just three decades ago.
Sea turtles are long-distance migrants, with some travelling several thousand kilometres from their nesting sites to their foraging grounds (Spotila, 2004; Baudouin et al., 2015; Chambault et al., 2017). This lifestyle, which also involves them exploiting considerable depths (leatherback sea turtles,Dermochelys coriacea, may dive to depths in excess of 1230 m; Spotila, 2004), makes visual observation problematic. Given that some sea turtle populations are subject to substantial anthropogenic pressures, with drastic declines being apparent in six of the seven extant species (International Union for Conservation Nature, 2018), any information pertaining to their ecology is valuable. Indeed, the expectation is that high-resolution behavioural data, especially those linked to habitat, could be pivotal in making informed conservation decisions (Baudouin et al., 2015). In this context, accelerometers have been used to identify and classify different animal behaviours (Brown et al., 2013; Collins et al., 2015; Graf et al., 2015). However, to our knowledge, only a limited number of studies have examined sea turtle behaviour using accelerometric data. For example, turtle feeding and breathing behaviours have been well described by accelerometers placed on the lower beaks (Okuyama et al., 2009), although normally acceleration loggers are attached to the turtle shell. Signals from these tags have allowed researchers to study turtle energy expenditure in relation to diving (Enstipp et al., 2011; Fossette et al., 2012), and have also been used in general descriptions of behaviours (Hochscheid et al., 1999; Yasuda and Arai, 2009; Fossette et al., 2010). However, as the accelerometric signals used in these studies to identify sea turtle behaviours in water were not Received 18 January 2018; Accepted 8 April 2018
1DEPE-IPHC, UMR 7178, CNRS, 23 rue Becquerel, 67087 Strasbourg cedex 2, France.2Aquarium La Rochelle, quai Louis Prunier, 17000 La Rochelle, France. 3Direction de l’Environnement, de l’Aménagement et du Logement Martinique, BP 7217, 97274 Schoelcher cedex, Martinique.4Office de l’Eau Martinique, 7 avenue Condorcet, BP 32, 97201 Fort-de-France, Martinique.5Institut Pasteur de la Guyane, 23 avenue Pasteur, BP 6010, Cayenne cedex, Guyane.6Biological Sciences, Institute of Environmental Sustainability, Swansea University, Swansea SA2 8PP, UK.
*Author for correspondence ([email protected])
L.J., 7317-3154; M.-A.F., 0000-0002-1996-1907; M.B., 0001-7857-909X; S.R., 0002-9348-4520; F.L., 0003-3678-6984; R.W., 0000-0003-3177-0107; D.C., 0000-0002-2232-6787
Journal
of
Experimental
validated by simultaneous observation of the tag-equipped animals, there is room for significant bias in the interpretation of the results. In this experimental study, we examined how behaviours observed in three species of sea turtle (Chelonia mydas,Eretmochelys imbricate
and Caretta caretta), living in captivity, relate to the signals from
tri-axial accelerometers incorporated into turtle-attached tags. This study should provide tools for scientists in future studies to determine turtle behaviour with greater confidence and constitutes an important step in defining the behaviours and ecological needs of these enigmatic animals. The ultimate aspiration is that this will help inform conservation decisions.
MATERIALS AND METHODS Data collection
The study was carried out in February 2015 at Aquarium La Rochelle, France. Tri-axial accelerometers [Wilog Acquisition Control Unit (WACU), size 21×13×4 mm, mass 2 g; conceived, built and calibrated by the Métrologie et Instrumentation Biologie et Environnement (MIBE) team, CNRS-IPHC, Strasbourg, France] were attached to three species of sea turtle: one adult green turtle,
Chelonia mydas(Linnaeus 1758) [mass 58.60 kg, straight carapace
length (SCL) 72.50 cm, curved carapace length (CCL) 76.00 cm], one adult hawksbill turtle,Eretmochelys imbricata(Linnaeus 1766) (mass 58.30 kg, SCL 70.90 cm, CCL 74.00 cm) and one juvenile loggerhead turtle,Caretta caretta(Linnaeus 1758) (mass 9.23 kg, SCL 39.60 cm, CCL 43.00 cm). The green turtle and the hawksbill were held in the same tank with a water volume of 150 m3 (7 m
length×5.6 m width×4.1 m depth) while the loggerhead was in a separate tank of 56 m3 (5.6 m length×4.8 m width×2.5 m depth).
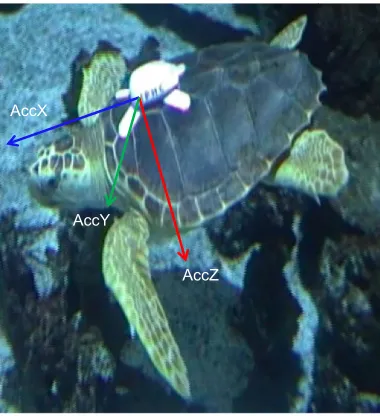
Each WACU recorded acceleration at 50 Hz in each of the three orthogonal axes of the animal: the anterior–posterior axis (AccX, surge), the lateral axis (AccY, sway) and the dorso-ventral axis (AccZ, heave) (Fig. 1). In addition to acceleration, pressure, luminosity and temperature were measured at 1 Hz. Each WACU was placed in a structure attached to the turtle carapace using waterproof double-backed adhesive tape (Fig. 1). Data collection lasted 1 day per individual; turtles were caught and equipped the morning before the Aquarium La Rochelle opened and then released
into their respective tanks. During the day, two fixed cameras (Sony and JVC) were placed to record turtle behaviours, while a third (Samsung) was used spontaneously by an operator for detailed documentation of particular behaviours such as food intake. Devices were removed from the turtles at the end of the day.
Identification of behaviours
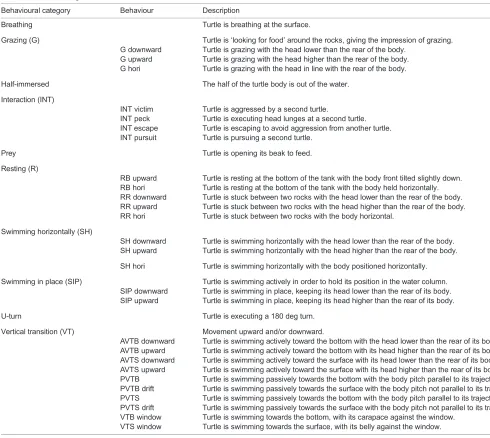
Videos were manipulated using Kinovea software (Association Kinovea 2015). A shared ethogram of the three sea turtles was derived following a preliminary video analysis (Table 1). All labelled behaviours were placed into one of 10 categories:‘breathing’,‘feeding on prey’ (termed ‘prey’ hereafter), ‘flipper-beating without translocation’ (termed ‘swimming in place’ hereafter), ‘grazing’, ‘half-immersed’, ‘interaction’, ‘resting’, ‘swimming horizontally’, ‘U-turn’ and ‘vertical transition’. The sea turtles were fed once during the experiment with hake fillets, sardines, prawns and lettuce distributed at the surface. The behavioural category‘prey’was intended to simulate normal feeding.‘Grazing’was used when a turtle was apparently looking for plant food on the rocks of the tank. The category ‘interaction’ included the social behaviours expressed between the hawksbill and the green turtle. Some of the categories were subdivided according to the inclination of turtle body (e.g. horizontal versus vertical; Table 1). Footage was time stamped manually to allow further synchronization with sensor data (e.g. acceleration, pressure).
The loggerhead exhibited movements in different proportions to those of the hawksbill and green turtle. For this reason, two different models were constructed.
Acceleration data analysis
Tri-axial acceleration data were downloaded from the loggers by the MIBE team (CNRS-IPHC). Acceleration data analysis required several calculations in order to obtain the variables needed for behaviour discrimination. These calculations were made using custom-written scripts (Y.H. and M.-A.F.-W.).
The raw acceleration data (Acc) recorded by the logger are considered to have two components: the static acceleration (St) due to the gravity and the dynamic body acceleration (DBA) stemming from the movement of the animal (Shepard et al., 2008; Wilson et al., 2008; Brown et al., 2013). For the three different axes (x,y
andz) these can be summarized as;
AccX¼StXþDBAX; ð1Þ
AccY¼StYþDBAY; ð2Þ
AccZ¼StZþDBAZ: ð3Þ
The static acceleration was isolated by subjecting the raw acceleration to a low-pass Butterworth filter (Matlab function ‘filtfilt’, using a threshold of 0.8 s) (Willener et al., 2015). The resulting data were then used to derive the body pitch angle ( pitch) and roll angle (roll) using the following equations (Wilson et al., 2008; Collins et al., 2015; Willener et al., 2015; Wilson et al., 2008; Forin-Wiart et al., 2014; Collins et al., 2015):
Pitch = arc sin ffiffiffiffiffiffiffiffiffiffiffiffiffiffiffiffiffiffiffiffiffiffiffiffiffiffiffiffiffiffiffiffiffiffiffiffiffiffiffiffiStX StX2þStY2þStZ2 p
!
180p ; ð4Þ
Roll¼2 arc tan StZ
StYþpffiffiffiffiffiffiffiffiffiffiffiffiffiffiffiffiffiffiffiffiffiffiffiffiStY2þStZ2
!
180p : ð5Þ
The dynamic acceleration was obtained by subtracting the static acceleration from the raw acceleration. A proxy for energy
AccY AccX
[image:2.612.79.269.487.695.2]AccZ
Fig. 1. Accelerometer attachment.A captive loggerhead turtle equipped with a bio-logger (WACU) attached to the carapace using waterproof double-backed adhesive tape. The three arrows indicate the axes measured by the
accelerometers.
Journal
of
Experimental
expenditure (metabolic power), called overall dynamic body acceleration (ODBA), can be obtained by summing the absolute values of dynamic acceleration across the three axes (Wilson et al., 2006; Gleiss et al., 2011; Halsey et al., 2011). Halsey et al. (2011) showed that ODBA was a reliable indicator of the overall energy expenditure of sea turtles. More recently, a similar indicator was proposed, vectorial dynamic body acceleration (VeDBA) (Walker et al., 2015), which represents the vectorial sum of the dynamic body acceleration:
VeDBA¼pffiffiffiffiffiffiffiffiffiffiffiffiffiffiffiffiffiffiffiffiffiffiffiffiffiffiffiffiffiffiffiffiffiffiffiffiffiffiffiffiffiffiffiffiffiffiffiffiffiffiffiffiffiffiffiffiffiffiDBAX2þDBAY2þDBAZ2: ð6Þ
ODBA and VeDBA are both reliable indicators of oxygen consumption and thus energy expenditure, and are tightly correlated (Qasem et al., 2012). In this study, we used VeDBA, which is less susceptible to errors in the variation of the angle at which the tag is placed on the animal (Qasem et al., 2012). Thus, we extracted nine variables from the raw acceleration data (StX, StY, StZ, DBAX, DBAY, DBAZ, pitch, roll and VeDBA) (Fig. 2).
Time matching and labelled dataset
[image:3.612.47.537.66.504.2]The various behaviours obtained from the video analysis were synchronized with the accelerometer data using time-specific calibrations (a defined repetitive motion was performed on each accelerometer at a precise time at the beginning and end of the experiment). The behavioural sequences were then cut into segments. The behaviours ‘prey’, ‘breathing’ and ‘interaction’, were termed ‘brief behaviours’, because they were performed rapidly and apparently opportunistically by the turtles. Accordingly, ‘brief behaviours’ were cut into segments of 2 s (this period corresponded to our observation of the minimum execution time). In contrast, the time step of the‘long behaviours’corresponded to the mean time taken for the study turtles to execute two flipper beats, and thus effectively represent the beat frequency. In order to determine this explicitly, 20 sequences of each of the ‘long behaviours’were randomly selected and analysed to measure the time corresponding to two flipper beats. A mean was obtained from these measures for each turtle. Thus, the sequences of ‘long behaviours’ were divided into 6 s segments for the green and Table 1. Shared ethogram of the three turtles
Behavioural category Behaviour Description
Breathing Turtle is breathing at the surface.
Grazing (G) Turtle is‘looking for food’around the rocks, giving the impression of grazing.
G downward Turtle is grazing with the head lower than the rear of the body.
G upward Turtle is grazing with the head higher than the rear of the body.
G hori Turtle is grazing with the head in line with the rear of the body.
Half-immersed The half of the turtle body is out of the water.
Interaction (INT)
INT victim Turtle is aggressed by a second turtle.
INT peck Turtle is executing head lunges at a second turtle.
INT escape Turtle is escaping to avoid aggression from another turtle.
INT pursuit Turtle is pursuing a second turtle.
Prey Turtle is opening its beak to feed.
Resting (R)
RB upward Turtle is resting at the bottom of the tank with the body front tilted slightly down.
RB hori Turtle is resting at the bottom of the tank with the body held horizontally.
RR downward Turtle is stuck between two rocks with the head lower than the rear of the body.
RR upward Turtle is stuck between two rocks with the head higher than the rear of the body.
RR hori Turtle is stuck between two rocks with the body horizontal.
Swimming horizontally (SH)
SH downward Turtle is swimming horizontally with the head lower than the rear of the body.
SH upward Turtle is swimming horizontally with the head higher than the rear of the body.
SH hori Turtle is swimming horizontally with the body positioned horizontally.
Swimming in place (SIP) Turtle is swimming actively in order to hold its position in the water column.
SIP downward Turtle is swimming in place, keeping its head lower than the rear of its body.
SIP upward Turtle is swimming in place, keeping its head higher than the rear of its body.
U-turn Turtle is executing a 180 deg turn.
Vertical transition (VT) Movement upward and/or downward.
AVTB downward Turtle is swimming actively toward the bottom with the head lower than the rear of its body
AVTB upward Turtle is swimming actively toward the bottom with its head higher than the rear of its body.
AVTS downward Turtle is swimming actively toward the surface with its head lower than the rear of its body.
AVTS upward Turtle is swimming actively toward the surface with its head higher than the rear of its body.
PVTB Turtle is swimming passively towards the bottom with the body pitch parallel to its trajectory.
PVTB drift Turtle is swimming passively towards the surface with the body pitch not parallel to its trajectory.
PVTS Turtle is swimming passively towards the bottom with the body pitch parallel to its trajectory.
PVTS drift Turtle is swimming passively towards the surface with the body pitch not parallel to its trajectory.
VTB window Turtle is swimming towards the bottom, with its carapace against the window.
VTS window Turtle is swimming towards the surface, with its belly against the window.
Journal
of
Experimental
hawksbill turtles and 4 s segments for the loggerhead turtle. In order to describe the labelled behaviours precisely, descriptive statistics (means, minimum values, maximum values, ranges, variances and standard deviations) were computed from the extracted segments over 2, 4 or 6 s for the nine acceleration-derived variables using the software R version 3.3.1 (R Core Team 2016). In addition, the difference between the pressure at the beginning and at the end of the segment was calculated (‘Diff_Deep’) as well as the variance, the range and the standard deviation of the pressure. Thus, every behavioural segment was described by 57 variables. The two datasets (one for the green and hawksbill turtles and one for the loggerhead turtle) were subdivided so that 70% was used as a training dataset and 30% was used as a validation dataset (Nathan et al., 2012).
Classification And Regression Tree (CART) and Random Forest modelling
Supervised learning algorithms typically use descriptive variables in order to discriminate behaviours. Among the most used supervised algorithms, Random Forest was shown to be the most accurate for classifying different behaviours from accelerometer data (Nathan et al., 2012). However, it is difficult to determine and interpret the precise decision rules used to classify behaviour as many distinct decision trees are built by the model based on the CART method (Nathan et al., 2012). We thus decided to first use a CART approach (Breiman et al., 1984; R package rpart) and then a Random Forest approach (Breiman, 2001; R package
randomForest, n=500 trees, mtry=28). This is because the first
algorithm displays the decision rules and highlights inconsistencies and this information can be used to improve the Random Forest model.
A confusion matrix was constructed from the test sample showing the well-identified behaviours (true positive, TP, and true negative, TN) and those considered misclassified (false negative, FN and false positive, FP). Three indices were calculated from the matrix to
test the accuracy and the sensitivity of each model (Powers, 2007), given by:
Recall¼ TP
TPþFN; ð7Þ
Precision¼ TP
TPþFP; ð8Þ
Accuracy¼ TPþTN
TPþTNþFPþFN: ð9Þ
RESULTS
Thirty-one different behaviours were identified and ranked into 10 different categories defined in the ethogram (Table 1) in the first analysis. In total, 22 h 47 min of recorded videos were analysed and 2922 behavioural sequences were identified for the three turtles.
Hawksbill and green turtle models
Video analysis
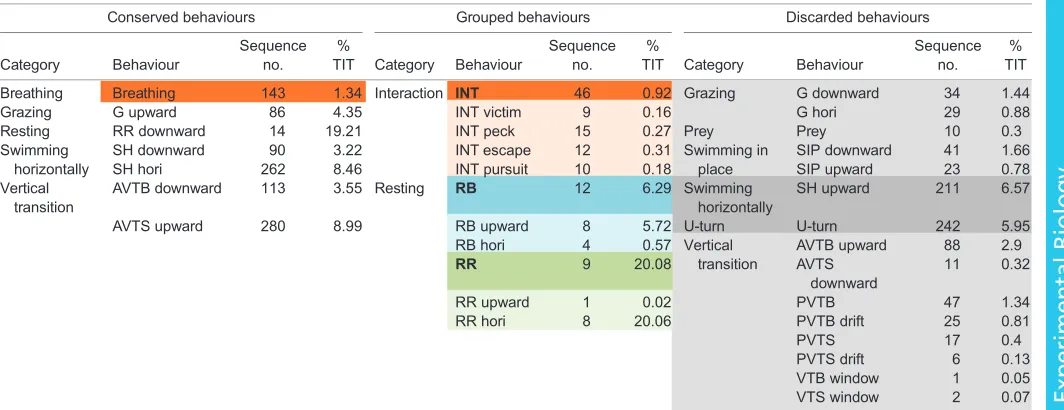
In total, 1842 sequences were identified during 850 min of video analysis; 77.28% of the analysed time was characterized by one of the defined behaviours, which represented 656.92 min (referred to as‘total identified time’, TIT). Among the 30 behaviours exhibited by the hawksbill and green turtles, the resting behaviours‘RR hori’ and ‘RR downward’ comprised most of the time (20.06% and 19.21% of TIT, respectively) (Table 2), with the hawksbill spending 71.57% of its TIT asleep compared with only 13% for the green turtle. However, the most commonly observed active behaviours were active vertical transition towards the surface (‘AVTS upward’) and horizontal movement (‘SH hori’) (comprising 8.99% and 8.46% of TIT for the adult turtles, respectively).
In order to build the models, behaviours expressed for less than 3% of TIT were considered to be under-represented and were removed from the analysis. These behaviours included ‘G downward’, ‘G hori’, ‘SH downward’, ‘SIP downward’, ‘SIP
0.5 0.4 0.3 VeDBA
DBAX
DBAY
Pitch Roll
Pressure (bar)
DBAZ
0.2 0.1 0
0.5 0.4 0.3 0.2 0.1 0 0.1
2.0
1.5
1.0
0.5
0
1.28
1.26
1.24
1.22
HM hori
U-turn
HM upward
INT escape
PVTB AVTS upward
1b
[image:4.612.52.562.61.301.2]Years Months Days Hours Minutes Seconds
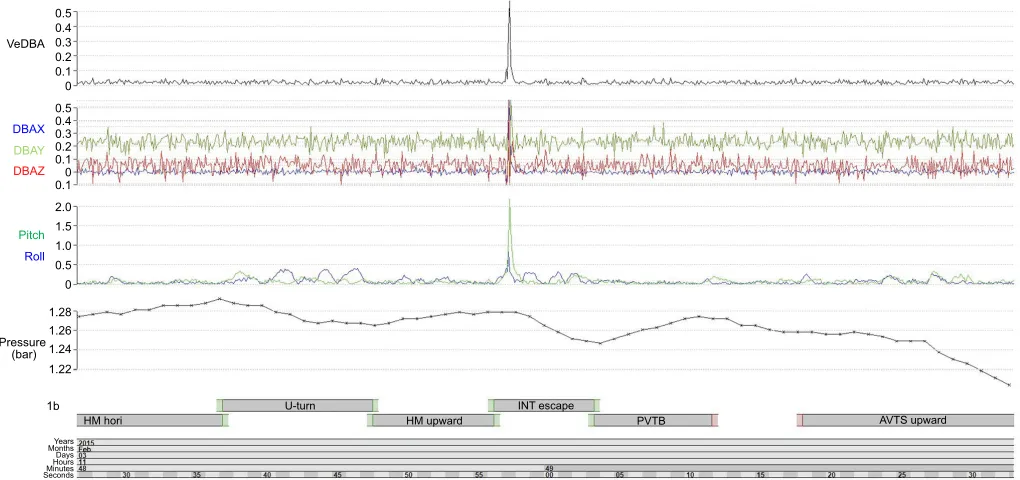
Fig. 2. Accelerometer and pressure data from the tag attached to the green turtle.Vectorial dynamic body acceleration (VeDBA) and dynamic body
acceleration (DBA) variables in thex-,y- andz-direction (DBAX, DBAY and DBAZ;g) were extracted from the raw acceleration data, and the body pitch angle and
roll angle (deg) were calculated from the static acceleration data. For definitions of behaviours in the lower panel (HM, INT, PVTB, AVTS), see Table 1.
Journal
of
Experimental
upward’, ‘prey’, ‘AVTB upward’, ‘AVTS downward’, ‘PVTB’, ‘PVTB drift’, ‘PVTS’, ‘PVTS drift’, ‘VTB window’ and ‘VTS window’. Similar resting behaviours were grouped together in order to increase their representation: these were‘RB upward’and‘RB hori’, grouped as‘RB’(resting on the bottom), and‘RR upward’ and ‘RR hori’, grouped as ‘RR’ (resting between the rocks). Similarly, the four interaction behaviours were grouped under ‘Interaction’(‘INT’) to facilitate recognition of general interaction behaviours. Considered as ‘brief behaviours’, the number of sequences of ‘interaction’ and ‘breathing’ (which were 46 and 143, respectively) associated with a 2 s window allowed us to keep both behaviours for the models.
The first tests of the model building highlighted the inability of the CART algorithms to discriminate‘U-turn’(recall and precision both <20%) and‘SH upward’(recall <30%). The latter was mostly exhibited by the green turtle before the food was distributed and was considered unnatural anyway. In order to get the most accurate models, both these behaviours were discarded.
Finally, 1055 sequences of 6 different behavioural categories were used to build the models with a time window of 2 s for ‘breathing’ and ‘interaction’and 6 s for all others. We obtained 4469 segments in total: 227 associated with the category‘grazing’, 501 with‘swimming horizontally’, 171 with‘interaction’, 176 with ‘breathing’, 2796 with‘resting’and 598 with‘vertical transition’. In order to balance the sample used by the algorithms, the number of segments of over-expressed behaviours had to be limited. Following preliminary tests, we found that 350 segments chosen randomly from the over-expressed behaviours gave the best outcome.
CART model
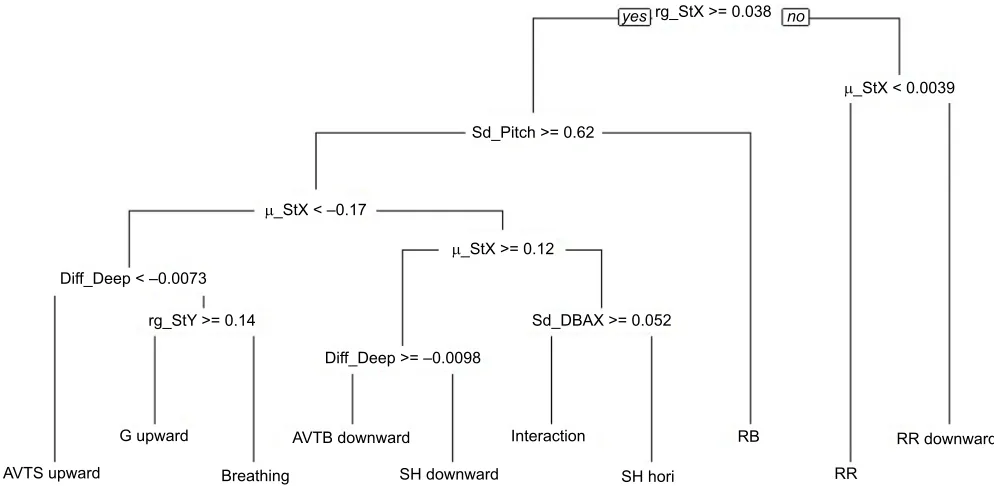
A decision tree discriminating 10 behaviours (‘AVTB downward’, ‘AVTS upward’, ‘breathing’, ‘G upward’, ‘SH downward’, ‘SH hori’,‘interaction’,‘RB’,‘RR downward’,‘RR’) from 6 different categories was constructed using the CART method (Fig. 3). The decision tree was relatively easy to understand, with resting
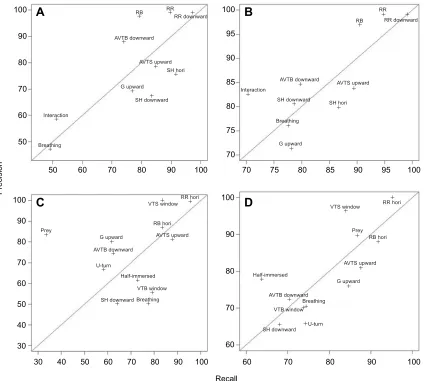
behaviours being discriminated within the first level (Fig. 3). ‘RR’was characterized by the low range of StY variables while ‘RB’ was discriminated from the active behaviours by the low standard deviation of the pitch variable (Fig. 3). For the active behaviours, the mean of the StX variable was important in discrimination of posture (either ‘upward-facing’ or‘ downward-facing’) while the difference in pressure (‘Diff_Deep’) provided information about the nature of the movement (whether vertical or horizontal). The sign of the‘Diff_Deep’also indicated whether the vertical movement was directed towards the surface or the bottom. The associated confusion matrix indicated a global accuracy of 81.30% (Table S1). The recall index varied from 48.98% to 97.14% and the precision index from 47.06% to 99.03% (Fig. 4A). All resting behaviours were well identified by the model, with ‘RR downward’ having the highest recall and precision indices. By contrast, the model struggled to discriminate ‘breathing’ and ‘interaction’, as manifest in their low recall and precision indices. ‘Breathing’had the lowest recall and precision indices, due mainly to confusion with‘G upward’(Table S1).
Random Forest model
The Random Forest model was built using the same behaviours employed in the CART model. As this algorithm tested 28 variables randomly sampled at each split (mtry=28), we took the first 28 most important variables to construct the model (Fig. 5A). The variables associated with pressure were the most important for discriminating turtle behaviours in the Random Forest model, with‘Diff_Deep’ being notably discerning. The mean of the StX variable, which defined the different turtle postures (upward-facing and downward-facing), was also particularly discerning, while the dynamic acceleration variable ‘min_VEDBA’ was the fourth most important variable for discriminating behaviours.
[image:5.612.48.580.473.678.2]The global accuracy for the discrimination of the 10 behaviours (‘AVTB downward’,‘AVTS upward’,‘breathing’,‘G upward’,‘SH downward’,‘SH hori’,‘interaction’,‘RB’,‘RR downward’,’RR’)
Table 2. Number of hawksbill and green turtle behavioural sequences
Conserved behaviours Grouped behaviours Discarded behaviours
Category Behaviour
Sequence no.
%
TIT Category Behaviour
Sequence no.
%
TIT Category Behaviour
Sequence no.
% TIT
Breathing Breathing 143 1.34 Interaction INT 46 0.92 Grazing G downward 34 1.44
Grazing G upward 86 4.35 INT victim 9 0.16 G hori 29 0.88
Resting RR downward 14 19.21 INT peck 15 0.27 Prey Prey 10 0.3
Swimming horizontally
SH downward 90 3.22 INT escape 12 0.31 Swimming in
place
SIP downward 41 1.66
SH hori 262 8.46 INT pursuit 10 0.18 SIP upward 23 0.78
Vertical transition
AVTB downward 113 3.55 Resting RB 12 6.29 Swimming
horizontally
SH upward 211 6.57
AVTS upward 280 8.99 RB upward 8 5.72 U-turn U-turn 242 5.95
RB hori 4 0.57 Vertical
transition
AVTB upward 88 2.9
RR 9 20.08 AVTS
downward
11 0.32
RR upward 1 0.02 PVTB 47 1.34
RR hori 8 20.06 PVTB drift 25 0.81
PVTS 17 0.4
PVTS drift 6 0.13
VTB window 1 0.05
VTS window 2 0.07
Behaviours with percentage of the total identified time (% TIT) >3% were conserved for modelling and are shown in the‘Conserved behaviours’column.
Behaviours with % TIT <3% were removed from further analysis (although they are shown in the‘Discarded behaviours’column). Similar under-represented
behaviours were grouped together in order to keep them in the analysis (shown in the‘Grouped behaviours’column; bold indicates the grouped data).‘Breathing’
and‘INT’, highlighted in orange, were‘brief behaviours’and their number of sequences associated with a 2 s window allowed us to keep them in the models.
Behaviours highlighted in dark grey showed recall or/and precision indices that were too small in first tests and were therefore discarded from the final model.
Light grey indicates discarded behaviors; blue and green indicate grouping of behaviours.
Journal
of
Experimental
was 86.96% (Table S2). All the precision indices obtained from the CART algorithm were improved in the Random Forest model except for‘AVTB downward’and‘RB’, both of which showed a slight decrease (Fig. 4B). The lowest recall index occurred for ‘interaction’(70.21%) while‘breathing’had the lowest precision index (71.25%). As with the CART algorithm, inactive behaviours had the highest precision and recall indices.
Loggerhead turtle models
Video analysis
In total, 517 min of recorded video was analysed and 927 behavioural sequences were identified with a TIT of 212.56 min (41.11% of the analysed time). The loggerhead executed 22 behaviours, with ‘AVTB downward’, ‘RB hori’ and ‘SH downward’being the most common (comprising 20.41%, 15.36% and 15.32% of TIT, respectively) (Table 3). All behaviours that
accounted for more than 3% of TIT were maintained for the models. As with the hawksbill and green turtle models,‘breathing’was kept within the model (see above). The first test of the CART model returned a very low recall value (<30%) for‘SH hori’. In order to get the most accurate models, we decided to exclude this behaviour from the final model to leave 12 behaviours (‘AVTB downward’, ‘AVTS upward’,‘Breathing’,‘G upward’,‘Half-immersed’,‘SH downward’,‘prey’,‘RB hori’,‘RR hori’,‘U-turn’,‘VTB window’ and‘VTS window’).
We had 739 behavioural sequences, which were cut into 2 s sections for‘prey’and‘breathing’and 4 s sections for the others. We then obtained 2111 segments: 66 placed in the category‘breathing’, 86 in ‘grazing’, 97 in ‘half-immersed’, 408 in ‘swimming horizontally’, 91 in ‘prey’, 563 in ‘resting’, 107 in ‘U-turn’ and 693 in‘vertical transition’; 110 segments were chosen randomly from the over-expressed behaviours (see above).
AVTS upward
G upward
Breathing Diff_Deep < –0.0073
Diff_Deep >= –0.0098 rg_StY >= 0.14
rg_StX >= 0.038
µ_StX >= 0.12 µ_StX < –0.17
µ_StX < 0.0039
Sd_DBAX >= 0.052
RR downward
RR RB
SH hori Interaction
SH downward AVTB downward
Sd_Pitch >= 0.62
[image:6.612.56.553.57.300.2]yes no
Fig. 3. Decision tree built from the Classification And Regression Tree (CART) algorithm, discriminating 10 behaviours of the hawksbill and green turtles.See Table 1 for explanation of terms.μ, mean; sd, standard deviation; rg, range.
Table 3. Number of loggerhead turtle behavioural sequences
Conserved behaviours Discarded behaviours
Category Behaviour Sequence no. % of TIT Category Behaviour Sequence no. % of TIT
Breathing Breathing 66 2.22 Grazing G downward 17 2.06
Grazing G upward 15 3.75 G hori 19 2.67
Half-immersed Half-immersed 14 3.55 Swimming horizontally SH hori 43 3.33
Prey Prey 9 3.72 Swimming in place SIP downward 31 2.09
Resting RB hori 4 15.36 SIP upward 5 0.3
RR hori 1 3.59 Vertical transition AVTS downward 44 2.95
Swimming horizontally SH downward 169 15.32 PVTB 3 0.22
U-turn U-turn 84 4.45 PVTB drift 1 0.04
Vertical transition AVTB downward 180 20.41 PVTS 9 0.47
AVTS upward 65 4.49 PVTS drift 16 0.84
VTB window 47 4.59
VTS window 85 4.45
Behaviours with percentage of the total identified time (% TIT) >3% were conserved for modelling and are shown in the‘Conserved behaviours’column.
Behaviours with % TIT <3% were removed from further analysis (shown in the‘Discarded behaviours’column).‘Breathing’and‘prey’, highlighted in orange, were
‘brief behaviours’and their number of sequences associated with a 2 s window allowed us to keep them in the models. Behaviours highlighted in dark grey showed
recall indices that were too small in first tests and were therefore discarded from the final model. Orange indicates brief behaviors; light grey indicates discarded
behaviors.
Journal
of
Experimental
[image:6.612.48.567.542.689.2]CART model
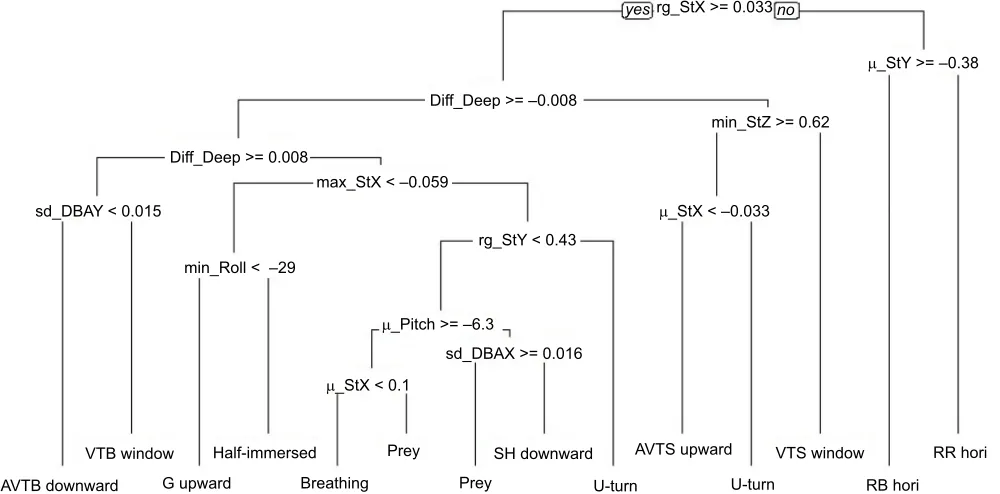
The decision tree built using the CART method discriminated 12 behaviours (‘AVTB downward’,‘AVTS upward’,‘breathing’,‘G upward’, ‘Half-immersed’, ‘SH downward’, ‘prey’, ‘RB hori’, ‘RR hori’,‘U-turn’,‘VTB window’and‘VTS window’). Resting behaviours were the first to be discriminated from the active behaviours by a low range of the StY variable (Fig. 6). Following this, the algorithm identified the vertical transitions towards the surface due to a negative‘Diff_Deep’, while movements in the opposite direction were characterized by a positive‘Diff_Deep’ value. ‘VTB window’ differentiated itself from ‘AVTB downward’ by the higher standard deviation in the DBAY variable. The discrimination of the other categories by the algorithm involved several decision rules based on the static acceleration variables. Only ‘SH downward’ and ‘prey’ were separated from one another by the standard deviation of the DBAX variable.
The global accuracy of this model was 71.63% (Table S3). The behaviours identified from the second and third level of discrimination in the CART decision tree (‘RR hori’,‘RB hori’ and ‘VTS window’) had the highest recall and precision indices
(Fig. 4C). Several ‘prey’ segments were identified wrongly as ‘breathing’, leading to a very low‘prey’recall index (33.33%) and a poor‘breathing’precision index (50.00%) (Table S3).
Random Forest model
A Random Forest model was constructed using the 12 highlighted behaviours (‘AVTB downward’,‘AVTS upward’,‘breathing’,‘G upward’,‘Half-immersed’,‘SH downward’,‘prey’,‘RB hori’,‘RR hori’,‘U-turn’,‘VTB window’and‘VTS window’).
‘Diff_Deep’was the most important variable used to build the model (Fig. 5B). The mean, the minimum and the maximum of both pitch and StX appeared within the 8 most important variables. The first variable associated with dynamic acceleration (‘var_DBAX’) was the 14th most important variable in the model.
The loggerhead Random Forest model was associated with a global accuracy of 79.49% (Table S4). ‘RR hori’ and ‘VTS window’had the highest recall and precision indices (Fig. 4D). The identification of‘prey’was significantly increased, with a precision index of 89.66% and a recall index of 86.67%.‘Half-immersed’had the lowest recall index (63.64%) while ‘SH downward’had the lowest precision index (65.38%).
50 60 70
Precision
80 90
100
A
B
C
D
70 75 80 85 90 95 100
60 70 80 90 100 100
90
80
70
60
50
40
30
30 40 50 60 70 80 90 100 60 70 80
Recall
50 60 70 80 90 100 70 75 80 85 90 95 100
90 100
RB RR
RR downward
AVTB downward
AVTS upward SH hori
G upward
SH downward
Interaction
Breathing
RR hori VTS window
Prey
G upward
AVTB downward
U-turn
Half-immersed
VTB window
SH downward
RB hori
AVTS upward
Interaction
AVTB downward
SH downward
Breathing
G upward
SH hori AVTS upward
RB RR
RR downward
Half-immersed
AVTB downward
G upward
VTB window
SH downward U-turn Breathing
AVTS upward RB hori
VTS window RR hori
Prey
+ + +
+
+ +
+ +
+
+
+ +
+ +
+
+ +
+
+ +
+
+ +
+
+ + Breathing
+ +
+ +
++ + +
+ + +
+ +
+ +
+
[image:7.612.96.520.58.439.2]+ +
Fig. 4. Plot of precision indices versus recall indices.(A) Plot obtained with the CART algorithm for 10 behaviours of the hawksbill and green turtles. (B) Plot obtained with the Random Forest algorithm for 10 behaviours of the hawksbill and the green turtles. (C) Plot obtained with the CART algorithm for 12 behaviours of the loggerhead turtle. (D) Plot obtained with the Random Forest algorithm for 12 behaviours of the loggerhead turtle. See Table 1 for explanation of terms.
Journal
of
Experimental
DISCUSSION
The main goal of this study was to relate underwater sea turtle behaviours to accelerometer signals. Our approach was successful in that the models from the CART algorithms had a global accuracy of 81.30% for the hawksbill and green turtles and 71.63% for the loggerhead turtle, identifying 10 and 12 different behaviours, respectively. This concurs with other studies using this approach. For example, there was 86.21% global accuracy in the discrimination of five behaviours manifest during the nesting process of green turtles,C. mydas(Nishizawa et al., 2013), 70.00% for five behaviours exhibited by African elephants, Loxodonta
africana(Soltis et al., 2012), 85.95% for seven griffon vultures,
Gyps fulvus, behaviours (Nathan et al., 2012), 84.26% for 10
behaviours exhibited by humans (Bao and Intille, 2004) and 67.00% for 13 behaviours used by domestic cats,Felis sylvestris
catus(Forin-Wiart et al., 2014).
In order to build an accurate model able to predict many underwater behaviours of sea turtles, the Random Forest algorithm was used in addition to the CART method. The Random Forest approach is a powerful classification algorithm (Nathan et al., 2012; Graf et al., 2015), which uses several decision trees in order to improve the model accuracy (Breiman, 2001). However, the specific difficulty is how to find the best compromise between global accuracy and the number of discriminated behaviours. Our results, with a
35
30 40 45 50
60 70 80
90
A
B
B
0 5 10 15 20 25
Dif
f_Deep
max_StX min_Pitch min_StX µ _Pitch µ_StX
min_StZ
max_Pitch
µ
_StZ
rg_Pressure
rg_StY
var_Pressure
rg_Roll
var_DBAX min_Roll sd_DBAX rg_DBAx
sd_StY
µ
_V
eDBA
max_StZ var_StY
µ
_Roll
rg_StZ
var_DBA
Y
max_Roll
max_DBAX
min_StY max_StY
A
0 10 20 30 40 50
Dif
f_Deep
rg_Pressure
µ
_StX
min_V
eDBA
var_Pressure
min_StX rg_DBAZ rg_DBA
Y
µ
_Pitch
µ
_DBA
Y
min_DBA
Y
sd_DBAX max_StZ max_Pitch var_DBAX µ_V
eDBA
max_StX
min_DBAX rg_DBAx min_Pitch
rg_StX
sd_DBA
Y
var_DBA
Y
var_Roll µ_DBAZ µ_DBAX rg_Roll
max_DBAZ max_Pitch rg_Pressure var_Pressure max_DBAX
[image:8.612.57.561.59.263.2]Mean decrease in accuracy
Fig. 5. Importance plot of the first 28 variables used in the discrimination processes.The mean decrease in accuracy was calculated from the decrease of the forecast quality due to a permutation of the variable averaged over all trees. The higher the value, the greater the importance of the variable. (A) The
importance plot for the hawksbill and green turtle behaviours. (B) The importance plot for the loggerhead turtle behaviours.μ, mean; sd, standard deviation;
rg, range; min, minimum; max, maximum; var, variance.
AVTB downward G upward Breathing sd_DBAY < 0.015
max_StX < –0.059
sd_DBAX >= 0.016 Diff_Deep >= 0.008
min_StZ >= 0.62
min_Roll < –29
rg_StX >= 0.033
rg_StY < 0.43
µ_StX < –0.033
µ_Pitch >= –6.3
µ_StX < 0.1
µ_StY >= –0.38
RR hori
RB hori Prey
Prey U-turn U-turn
Half-immersed SH downward AVTS upward
VTB window VTS window
yes no
Diff_Deep >= –0.008
Fig. 6. Decision tree built from the CART algorithm, discriminating 12 behaviours of the loggerhead turtle.See Table 1 for explanation of terms.
Journal
of
Experimental
[image:8.612.59.559.474.721.2]global accuracy of 86.96% for the hawksbill and green turtle model and 79.49% for the loggerhead turtle model, demonstrate the value of this approach. Few studies have used the Random Forest algorithm to discriminate behaviours from accelerometer data despite its convincing results. For example, Casale et al. (2011) reported 94.00% accuracy for five behaviours in humans, Resheff et al. (2014) reported 84.02% accuracy for six behaviours in griffon vultures, Graf et al. (2015) reported 94.99% accuracy for six behaviours in Eurasian beavers, Castor fiber, and Nathan et al. (2012) reported 90.88% accuracy for seven behaviours in griffon vultures.
As in previous comparative studies (Nathan et al., 2012; Ellis et al., 2014; Resheff et al., 2014; Ladds et al., 2017), the Random Forest algorithm performed better than the CART algorithm, with specific improvement being manifest in the precision and recall indices of the behaviours: here, the global accuracy was 5.66 points higher with the Random Forest algorithm in the hawksbill and green turtle model, and 7.2 points higher in the loggerhead turtle model. In both cases, the behaviours that showed some difficulty in identification by the CART algorithm were associated with a greater increase of one, or both, of the indices in the Random Forest model. In fact, with the exception of the‘SH downward’behaviour in the loggerhead turtle model, these behaviours had the smallest number of segments available for analysis. However, the use of several decision trees by the Random Forest algorithm allowed us to compensate for such low representation, increasing the precision of the model to identify them.
In this study, we used the CART algorithm as a first step in order to understand the main decision rules for identifying behaviours. In fact, the variables that emerged from the CART decision tree were also the first 10 most important variables used to build the random forest model. Of particular note is that the inactive behaviours (within the category‘resting’) were rapidly discriminated using two or three decision rules based on static acceleration variables or posture-related parameters (see Fehlmann et al., 2017). This contrasts with other studies that have noted the value of dynamic acceleration (in some ways the polar opposite of static acceleration) in differentiating inactive from active behaviours (Shamoun-Baranes et al., 2012; Soltis et al., 2016). With specific regard to active locomotion behaviours, the direction (or sign) of the ‘Diff_Deep’ value was used by both algorithms, indicating the direction of movement and demonstrating the value of non-accelerometer sensors in helping differentiate behaviours, while negative or positive values of StX gave information about the inclination of the body (upward-facing or downward-facing). Dynamic acceleration was particularly useful in the hawksbill and green turtle CART model to help discriminate‘interaction’and‘SH hori’. The interactions between the two adult turtles were brief and fast, leading to high values for dynamic acceleration as one of the turtles attacked or escaped (Fig. 2).
In our attempt to create a shared ethogram, we described as much behavioural detail as possible in order to make models most applicable to free-living turtles. However, as the three turtles expressed the behaviours with different frequencies, we were obliged to build two distinct models, both of which sought to conserve the observed behavioural characteristics (body posture, activity, direction, etc.) as closely as possible. This difference in the expression of behaviours might be primarily due to the size/age difference between the animals, the juvenile loggerhead being half the size of the other two (adult) species. In addition, turtle buoyancy also determines dynamic acceleration signals (Yasuda and Arai, 2009; Fossette et al., 2010) and this may have led to different behavioural expressions between the juvenile and the adults. The
loggerhead turtle models notably gave a global accuracy that was about 10 points lower than the adult models due to a higher number of behaviours, and this concurs with other studies that have shown a similar decrease of CART accuracy with the addition of behaviours (Shamoun-Baranes et al., 2012; Nishizawa et al., 2013). Again, as we obtained data from only one loggerhead individual, our sample size prohibits proper consideration of this. Our first CART model building tests showed clearly, however, that an increase of the available segment number (110) in both algorithms led to a rapid decline in the precision and recall indices of poorly represented behaviours. Thus, this model currently does not seem particularly compelling for use on free-living individuals and should be consolidated with extra data.
Limits of using captive animals
As with other wild animal species (Hogan et al., 1988; Birke, 2002; Montaudouin and Le Pape, 2004), captivity is expected to profoundly affect the extent and type of behaviours exhibited by sea turtles by virtue of the restricted space and poorly enriched environment. However, the environment for the turtles of Aquarium La Rochelle is conceived to encourage them to conserve their natural behaviours, such as resting in various hiding places within their aquarium and searching for food in the water column and on the bottom. For this reason, the food-searching behaviour‘grazing’ was identified in both the adult and juvenile models while‘prey’ was discriminated only in the loggerhead turtle model. It was, however, problematic that there was a very low incidence of such behaviour in our study. Nonetheless, the success of identification of ‘prey’ and ‘grazing’ behaviours indicates that tags such as ours deployed on free-living animals could point towards food ingestion events, an important part of turtle ecology.
An obvious limitation of our system was manifest in our models being unable to discriminate passive movements (notably gliding up and/or down the water column), behaviours that have been noted from free-living turtles (Yasuda and Arai, 2009; Fossette et al., 2010). This was because these phases are highly transitory in captivity and, anyway, particular pressure conditions (associated with depth) are necessary for the overall turtle body density to differ enough from that of seawater for these to take place. For example, Yasuda and Arai (2009) estimated that wild green turtles can glide down passively at depths of between 12 and 20 m. Our 4 m deep tanks were, therefore, inadequate in this respect.
Of particular note is that the decision trees obtained from the CART algorithm, as well as the importance of variables indicated by the Random Forest algorithm, showed that dynamic acceleration values were used little to discriminate behaviours, with models being primarily reliant on posture and pressure differences. This contrasts with results obtained from accelerometers deployed on free-living turtles, where dynamic acceleration values figure extensively in activity budget quantification and in discussing the energy management strategies of these animals (Hochscheid et al., 1999; Lagarde et al., 2008; Fossette et al., 2012). In fact, dynamic acceleration did not vary significantly between sea turtle behaviours in our study, which we assume was a consequence of the constraints of captivity. This is not just related to the limited space per se but also reflects the amount of ‘effort’ invested in any movement by captive animals compared with their wild counterparts (Shepherdson et al., 1993; Veasey et al., 1996). Interestingly, in the CART models,‘interaction’and ‘prey’, were among the few behaviours discriminated by dynamic acceleration, both of which are expected in wild animals and elicited some vigour in the captive
animals, for obvious reasons.
Journal
of
Experimental
Sea turtle flipper beating during travelling produces a clear, regular waveform in the heave axis (Shepard et al., 2008), a pattern that is also characteristic in swimming penguins and flying birds (Watanabe et al., 2005; Lagarde et al., 2008; Shamoun-Baranes et al., 2012; Nishizawa et al., 2013). Given the low flipper beat frequency of turtles (Yasuda and Arai, 2009) and the limited dimensions of our study tanks, it proved challenging to obtain clear flipper-beat signals of our turtles during swimming (noting that a temporal window of >6 s and >4 s is needed for 2 flipper beats for the adult and juvenile animals, respectively), which also correspondingly reduced the number of segments used to build the models.
Perspectives and conclusions
The development of remote sensors, such as 3D accelerometers, allows us to acquire new information about the behavioural ecology of enigmatic species in the wild. This is particularly germane for threatened species. For this reason, studies seeking to validate sensor signals for turtle behaviours are important in helping conservation efforts (Sutherland, 1998). This study is the first to validate accelerometer data to identify the behaviours of turtles in water. For this, we suggest using two supervised algorithms in order to combine the advantages of both. While the Random Forest algorithm is a powerful classification algorithm, upstream use of the CART algorithm highlighted ‘confused’ behaviours and allowed us to refine our analysis in order to build the most accurate Random Forest model. Despite the obvious limitations of studies on captive animals, our work indicates that this approach is a promising first step in helping to identify the suite of behaviours exhibited by sea turtles. We hope that this study will help catalyse the next stage in the process, which is to have the derived models tested on other watchable captive sea turtle species, with a view to taking the system into the wild. Ultimately, the aspiration is to use this approach to provide data that will improve management plans for these endangered species.
Acknowledgements
This study was carried out within the framework of the Plan National d’Action Tortues Marines de Martinique and Guyane. The authors would like to thank the DEAL Martinique et Guyane, the ODE Martinique, the ONCFS Martinique and Guyane, the ONEMA Martinique and Guyane, the SMPE Martinique and Guyane, the ONF Martinique, the PNR Martinique and Guyane, The Reserve Naturelle de l’Amana, the WWF French Guiana, the Surfrider Foundation, Carbet des Sciences, Aliotisplongée, Plongée-Passion, the Collège Cassien Sainte-Claire and the Collège Petit Manoir for their technical support and field assistance.
Competing interests
The authors declare no competing or financial interests.
Author contributions
Conceptualization: F.D., M.C., M. Bonola, D.E., J.G., B.D., F.C., D.C.; Methodology: L.J., F.D., M.-A.F.-W., M. Bonola, Y.H.; Software: M.-A.F.-W., Y.H.; Validation:
M.-A.F.-W., Y.H., R.W., D.C.; Formal analysis: L.J., M.-A.F.-W., Y.H.; Investigation: L.J., M.-A.F.-W., Y.H.; Resources: F.D., M.C., M. Bonola, S.R., N.L., F.L., M. Brucker, N.C., R.L., F.C., D.C.; Data curation: M. Bonola, S.R., N.L., F.L., M. Brucker, N.C., R.L., F.C.; Writing - original draft: L.J.; Writing - review & editing: L.J., F.D., M.-A.F.-W., B.D., Y.L., Y.H., R.W., D.C.; Supervision: F.D., M.C., D.E., J.G., Y.L., F.C., R.W., D.C.; Project administration: F.D., D.C.; Funding acquisition: F.D., M.C., D.E., J.G., B.D., D.C.
Funding
This study was co-financed by the Direction de l’Environnement, de l’Aménagement et du Logement Guyane and Centre National d’Etudes Spatiales, Fonds Européens de Développement Régional Martinique (European Union), Direction de l’Environnement, de l’Aménagement et du Logement Martinique, the Office De l’Eau Martinique, the Mission InterdisciplinaritéCentre National de la Recherche Scientifique, the Fondation ElectricitéDe France, the Aquarium La Rochelle and the Fondation de France. The authors also appreciate the support of the ANTIDOT project (Pépinière Interdisciplinaire Guyane, Mission pour l’Interdisciplinarité,
Centre National de la Recherche Scientifique). Lorène Jeantet’s PhD scholarship was supported by Direction de l’Environnement, de l’Aménagement et du Logement Guyane and Centre National d’Etudes Spatiales.
Supplementary information
Supplementary information available online at
http://jeb.biologists.org/lookup/doi/10.1242/jeb.177378.supplemental
References
Bao, L. and Intille, S. S. (2004). Activity recognition from user-annotated acceleration data. InPervasive Computing(ed.A. Ferscha and F. Mattern). Pervasive 2004. Lecture Notes in Computer Science, vol. 3001. Berlin: Springer.
Baudouin, M., de Thoisy, B., Chambault, P., Berzins, R., Entraygues, M., Kelle, L., Turny, A., Le Maho, Y. and Chevallier, D.(2015). Identification of key marine areas for conservation based on satellite tracking of post-nesting migrating green turtles (Chelonia mydas).Biol. Conserv.184, 36-41.
Birke, L.(2002). Effecs of browse, human visitors and noise on the behavior of captive orangutans.Anim. Welf.11, 189-202.
Breiman, L.(2001). Random forests.Mach. Learn.45, 5-32.
Breiman, L., Friedman, J., Stone, C. J. and Olshen, R.(1984).Classification and
Regression Trees. Berlin: Springer (Wadsworth and Brooks).
Brown, D. D., Kays, R., Wikelski, M., Wilson, R. and Klimley, A. P.(2013). Observing the unwatchable through acceleration logging of animal behavior.
Anim. Biotelemetry1, 20.
Cagnacci, F., Boitani, L., Powell, R. A. and Boyce, M. S.(2010). Animal ecology meets GPS-based radiotelemetry: a perfect storm of opportunities and challenges.Philos. Trans. R. Soc. B Biol. Sci.365, 2157-2162.
Casale, P., Pujol, O. and Radeva, P.(2011). Human activity recognition from accelerometer data using a wearable device.Pattern Recognit. Image Anal.6669, 289-296.
Chambault, P., Pinaud, D., Vantrepotte, V., Kelle, L., Entraygues, M., Guinet, C., Berzins, R., Bilo, K., Gaspar, P., de Thoisy, B. et al.(2015). Dispersal and diving adjustments of the green turtle Chelonia mydas in response to dynamic environmental conditions during post-nesting migration. PLoS ONE 10, e0137340.
Chambault, P., Roquet, F., Benhamou, S., Baudena, A., Pauthenet, E., de Thoisy, B., Bonola, M., Dos Reis, V., Crasson, R., Brucker, M. et al.(2017). The Gulf Stream frontal system: a key oceanographic feature in the habitat selection of the leatherback turtle?Deep Res. Part I Oceanogr. Res. Pap.123, 35-47.
Chevallier, D., Handrich, Y., Georges, J.-Y., Baillon, F., Brossault, P., Aurouet, A., Le Maho, Y. Massemin, S.(2010). Influence of weather conditions on the flight of migrating black storks.Proc. R. Soc. B Biol. Sci.277:2755-2764.
Collins, P. M., Green, J. A., Warwick-Evans, V., Dodd, S., Shaw, P. J. A., Arnould, J. P. Y. and Halsey, L. G. (2015). Interpreting behaviors from accelerometry: a method combining simplicity and objectivity.Ecol. Evol.
Dodge, K. L., Galuardi, B., Miller, T. J. and Lutcavage, M. E.(2014). Leatherback turtle movements, dive behavior, and habitat characteristics in ecoregions of the Northwest Atlantic Ocean.PLoS ONE9, e91726.
Ellis, K., Godbole, S., Marshall, S., Lanckriet, G., Staudenmayer, J. and Kerr, J.
(2014). Identifying active travel behaviors in challenging environments using GPS, accelerometers, and machine learning algorithms.Front. Public Heal.2, 36.
Enstipp, M. R., Ciccione, S., Gineste, B., Milbergue, M., Ballorain, K., Ropert-Coudert, Y., Kato, A., Plot, V. and Georges, J.-Y.(2011). Energy expenditure of freely swimming adult green turtles (Chelonia mydas) and its link with body acceleration.J. Exp. Biol.214, 4010-4020.
Fehlmann, G., O’Riain, M. J., Hopkins, P. W., O’Sullivan, J., Holton, M. D., Shepard, E. L. C. and King, A. J.(2017). Identification of behaviours from accelerometer data in a wild social primate.Anim. Biotelemetry5, 6.
Forin-Wiart, M.-A., Poulle, M. L., Hubert, P., Chevallier, D., Georges, J. and Handrich, Y.(2014). Use of tri-axial accelerometers: towards the identification of when and hows often cats hunt ? The 5th International Bio-logging Science Symposium. Strasbourg, France.
Fossette, S., Gleiss, A. C., Myers, A. E., Garner, S., Liebsch, N., Whitney, N. M., Hays, G. C., Wilson, R. P. and Lutcavage, M. E. (2010). Behaviour and buoyancy regulation in the deepest-diving reptile: the leatherback turtle.J. Exp.
Biol.213, 4074-4083.
Fossette, S., Schofield, G., Lilley, M. K. S., Gleiss, A. C. and Hays, G. C.(2012). Acceleration data reveal the energy management strategy of a marine ectotherm during reproduction.Funct. Ecol.26, 324-333.
Gleiss, A. C., Wilson, R. P. and Shepard, E. L. C.(2011). Making overall dynamic body acceleration work: on the theory of acceleration as a proxy for energy expenditure.Methods Ecol. Evol.2, 23-33.
Graf, P. M., Wilson, R. P., Qasem, L., Hackländer, K. and Rosell, F.(2015). The use of acceleration to code for animal behaviours; a case study in free-ranging Eurasian beavers Castor fiber.PLoS ONE10, e0136751.
Halsey, L. G., Jones, T. T., Jones, D. R., Liebsch, N. and Booth, D. T.(2011). Measuring energy expenditure in sub-adult and hatchling sea turtles via accelerometry (Y Ropert-Coudert, Ed.).PLoS ONE6, e22311.
Journal
of
Experimental
Hart, K. M. and Hyrenbach, K. D. (2010). Satellite telemetry of marine megavertebrates: the coming of age of an experimental science. Endanger.
Species Res.10, 9-20.
Hochscheid, S., Godley, B. J., Broderick, A. C. and Wilson, R. P.(1999). Reptilian diving: highly variable dive patterns in the green turtle Chelonia mydas.
Mar. Ecol. Prog. Ser.185, 101-112.
Hogan, E. S., Houpt, K. A. and Sweeney, K.(1988). The effect of enclosure size on social interactions and daily activity patterns of the captive Asiatic wild horse (Equus przewalskii).Appl. Anim. Behav. Sci.21, 147-168.
Hubel, T. Y., Myatt, J. P., Jordan, N. R., Dewhirst, O. P., McNutt, J. W. and Wilson, A. M.(2016). Additive opportunistic capture explains group hunting benefits in African wild dogs.Nat. Commun.7, 11033.
Iucnredlist.org. (2018). The IUCN Red List of Threatened Species. [online] Available at: http://www.iucnredlist.org/ [Accessed 12 Jan 2018].
Jack, K. M., Lenz, B. B., Healan, E., Rudman, S., Schoof, V. A. M. and Fedigan, L.
(2008). The effects of observer presence on the behavior of Cebus capucinus in Costa Rica.Am. J. Primatol.70, 490-494.
Kooyman, G. L.(2003). Genesis and evolution of bio-logging devices: 1963–2002.
Mem. Natl. Polar Res. Inst.5, 15-22.
Ladds, M. A., Thompson, A. P., Kadar, J.-P., Slip, D., Hocking, D. and Harcourt, R.(2017). Super machine learning: improving accuracy and reducing variance of behaviour classification from accelerometry.Anim. Biotelemetry5, 8.
Lagarde, F., Guillon, M., Dubroca, L., Bonnet, X., Ben Kaddour, K., Slimani, T. and El Mouden, E. H.(2008). Slowness and acceleration: a new method to quantify the activity budget of chelonians.Anim. Behav.75, 319-329.
Montaudouin, S. and Le Pape G.(2004). Comparison of the behaviour of European brown bears (Ursus arctos arctos) in six different parks, with particular attention to stereotypies.Behav. Processes67, 235-244.
Narazaki, T., Sato, K., Abernathy, K. J., Marshall, G. J. and Miyazaki, N.(2009). Sea turtles compensate deflection of heading at the sea surface during directional travel.J. Exp. Biol.212, 4019-4026.
Nathan, R., Spiegel, O., Fortmann-Roe, S., Harel, R., Wikelski, M. and Getz, W. M.(2012). Using tri-axial acceleration data to identify behavioral modes of free-ranging animals: general concepts and tools illustrated for griffon vultures.J. Exp.
Biol.215, 986-996.
Nishizawa, H., Noda, T., Yasuda, T., Okuyama, J., Arai, N. and Kobayashi, M.
(2013). Decision tree classification of behaviors in the nesting process of green turtles (Chelonia mydas) from tri-axial acceleration data.J. Ethol.31, 315-322.
Okuyama, J., Kawabata, Y., Naito, Y., Arai, N. and Kobayashi, M. (2009). Monitoring beak movements with an acceleration datalogger: a useful technique for assessing the feeding and breathing behaviors of sea turtles. Endanger.
Species Res.10, 39-45.
Powers, D. M. W.(2007). Evaluation: from precision, recall and F-factor to ROC, informedness, markedness and correlation.Int. J. Mach. Learn. Tech.2, 37-63.
Qasem, L., Cardew, A., Wilson, A., Griffiths, I., Halsey, L. G., Shepard, E. LC., Gleiss, A. C. and Wilson, R.(2012). Tri-axial dynamic acceleration as a proxy for animal energy expenditure; should we be summing values or calculating the vector?PLoS ONE7, e31187.
Resheff, Y. S., Rotics, S., Harel, R., Spiegel, O. and Nathan, R. (2014). AcceleRater: a web application for supervised learning of behavioral modes from acceleration measurements.Mov. Ecol.2, 27.
Schneirla, T. C.(1950). The relationship between observation and experimentation in the field study of behavior.Ann. N. Y. Acad. Sci.51, 1022-1044.
Shamoun-Baranes, J., Bom, R., van Loon, E. E., Ens, B. J., Oosterbeek, K. and Bouten, W.(2012). From sensor data to animal behaviour: an oystercatcher example (GG de Polavieja, Ed.).PLoS ONE7, e37997.
Shepard, E. L. C., Wilson, R. P., Quintana, F., Gómez Laich, A., Liebsch, N., Albareda, D. A., Halsey, L. G., Gleiss, A., Morgan, D. T., Myers, A. E. et al.
(2008). Identification of animal movement patterns using tri-axial accelerometry.
Endanger. Species Res.10, 47-60.
Shepherdson, D. J., Carlstead, K., Mellen, J. D. and Seidensticker, J.(1993). The influence of food presentation on the behavior of small cats in confined environments.Zoo Biol.12, 203-216.
Soltis, J., Wilson, R. P., Douglas-Hamilton, I., Vollrath, F., King, L. E. and Savage, A.(2012). Accelerometers in collars identify behavioral states in captive African elephants Loxodonta Africana.Endanger. Species Res.18, 255-263.
Soltis, J., King, L., Vollrath, F. and Douglas-Hamilton, I.(2016). Accelerometers and simple algorithms identify activity budgets and body orientation in African elephantsLoxodonta africana.Endang. Species Res.31, 1-12.
Spotila, J. R.(2004).Sea Turtles: A Complete Guide to their Biology, Behavior, and
Conservation. Baltimore, MA: The John Hopkins University Press.
Sutherland, W. J.(1998). The importance of behavioural studies in conservation biology.Anim. Behav.56, 801-809.
Tomkiewicz, S. M., Fuller, M. R., Kie, J. G. and Bates, K. K.(2010). Global positioning system and associated technologies in animal behaviour and ecological research.Philos. Trans. R. Soc. B Biol. Sci.365, 2163-2176.
Veasey, J. S., Waran, N. K. and Young, R. J.(1996). On comparing the behaviour of zoo housed animals with wild conspecifics as a welfare indicator.Animal
Welfare5, 139-153.
Walker, J. S., Jones, M. W., Laramee, R. S., Holton, M. D., Shepard, E. L. C., Williams, H. J., Scantlebury, D. M., Marks, N. J., Magowan, E. A., Maguire, I. E. et al.(2015). Prying into the intimate secrets of animal lives; software beyond hardware for comprehensive annotation in‘Daily Diary’tags.Mov. Ecol.3, 1-16.
Watanabe, Y., Baranov, E. A., Sato, K., Naito, Y. and Miyazaki, N.(2004). Foraging tactics of Baikal seals differ between day and night.Mar. Ecol. Prog. Ser.
279, 283-289.
Watanabe, S., Izawa, M., Kato, A., Ropert-Coudert, Y. and Naito, Y.(2005). A new technique for monitoring the detailed behaviour of terrestrial animals: a case study with the domestic cat.Appl. Anim. Behav. Sci.94, 117-131.
Watanabe, S., Sato, K., Ponganis, P. J., Groscolas, R. and Ponganis, P.(2012). Activity time budget during foraging trips of emperor penguins (A Chiaradia, Ed.).
PLoS ONE7, e50357.
Willener, A. S. T., Handrich, Y., Halsey, L. G. and Strike, S.(2015). Effect of walking speed on the gait of king penguins: an accelerometric approach.J. Theor.
Biol.387, 166-173.
Wilson, R. P., White, C. R., Quintana, F., Halsey, L. G., Liebsch, N., Martin, G. R. and Butler, P. J.(2006). Moving towards acceleration for estimates of activity-specific metabolic rate in free-living animals: the case of the cormorant.J. Anim.
Ecol.75, 1081-1090.
Wilson, R. P., Shepard, E. L. C. and Liebsch, N.(2008). Prying into the intimate details of animal lives: use of a daily diary on animals.Endanger. Species Res.4, 123-137.
Yasuda, T. and Arai, N.(2009). Changes in flipper beat frequency, body angle and swimming speed of female green turtles Chelonia mydas.Mar. Ecol. Prog. Ser.
386, 275-286.
Yoda, K., Sato, K., Niizuma, Y., Kurita, M. and Naito, Y.(1999). Precise monitoring of porpoising behaviour of Adélie penguins.J. Exp. Biol.3126, 3121-3126.