RESEARCH ARTICLE
Patterns of alternative splicing in response to cold acclimation
in fish
Timothy M. Healy*,‡and Patricia M. Schulte
ABSTRACT
Phenotypic plasticity is an important aspect of an organism’s response to environmental change that often requires the modulation of gene expression. These changes in gene expression can be quantitative, as a result of increases or decreases in the amounts of specific transcripts, or qualitative, as a result of the expression of alternative transcripts from the same gene (e.g. via alternative splicing of pre-mRNAs). Although the role of quantitative changes in gene expression in phenotypic plasticity is well known, relatively few studies have examined the role of qualitative changes. Here, we use skeletal muscle RNA-seq data from Atlantic killifish (Fundulus heteroclitus), threespine stickleback (Gasterosteus aculeatus) and zebrafish (Danio rerio) to investigate the extent of qualitative changes in gene expression in response to cold acclimation. Fewer genes demonstrated alternative splicing than differential expression as a result of cold acclimation; however, differences in splicing were detected for 426 to 866 genes depending on species, indicating that large numbers of qualitative changes in gene expression are associated with cold acclimation. Many of these alternatively spliced genes were also differentially expressed, and there was functional enrichment for involvement in muscle contraction among the genes demonstrating qualitative changes in response to cold acclimation. Additionally, there was a common group of 29 genes with cold-acclimation-mediated changes in splicing in all three species, suggesting that there may be a set of genes with expression patterns that respond qualitatively to prolonged exposure to cold temperatures across fishes.
KEY WORDS: Temperature, Differential exon usage, Phenotypic plasticity, Killifish, Stickleback, Zebrafish
INTRODUCTION
Phenotypic plasticity, which is the ability of organisms to express environmentally mediated alternative phenotypes without genetic change (e.g. Travis, 1994; West-Eberhard, 2003), plays a critical role in determining organismal responses to a changing environment (e.g. Schulte et al., 2011). For example, reversible metabolic plasticity in ectotherms has the potential to increase resilience to anthropogenic climate change (Seebacher et al., 2015). One of the primary mechanisms underlying this phenotypic plasticity is thought to be changes in gene expression (Schlichting and Pigliucci, 1993; Schlichting and Smith, 2002), which can occur
in one of two general ways: (1) quantitative changes in which the transcripts of a gene increase or decrease in number in the cell, or (2) qualitative changes in which the nature of the transcripts being expressed changes as a result of mechanisms such as alternative mRNA splicing or RNA editing (Schlichting and Pigliucci, 1993; Gerber and Keller, 2001; Hochachka et al., 2001; Schlichting and Smith, 2002; Schulte, 2004; Marden, 2008; Rosenthal, 2015). Quantitative changes in gene expression in response to environmental change have been widely studied (e.g. Gracey et al., 2004; Buckley et al., 2006; Garcia et al., 2012; Moya et al., 2012; Schoville et al., 2012; Zhao et al., 2012; Mandic et al., 2014), whereas, despite previous suggestions that qualitative changes are likely also an important mechanism underlying plasticity (Hochachka et al., 2001; Schulte, 2004; Marden, 2008), surprisingly little is known about qualitative mRNA responses to environmental stressors in animals (Somero, 2018).
Some evidence for the potential importance of qualitative changes in gene expression comes from studies of the phenomenon of RNA editing, in which there is enzymatic conversion of individual bases within a transcript that result in changes in the amino acid sequence of the subsequently translated protein (Nishikura, 2016; Montiel-Gonzalez et al., 2016). For example, it has been shown that differences in RNA editing of voltage-gated potassium channels between tropical and polar octopus species results in channels with functional properties suitable for their different habitats (Garrett and Rosenthal, 2012), suggesting that RNA editing provides a mechanism allowing environmental adaptation. However, the role of RNA editing in plasticity has not been well studied (Rosenthal, 2015). RNA editing appears to be relatively common in non-coding regions in metazoans, but is relatively rare in coding regions in animal taxa other than cephalopods (Porath et al., 2017; Liscovitch-Brauer et al., 2017). In contrast, alternative splicing, a process in which variation in exon usage produces different mature mRNA transcripts from the pre-mRNA transcript of a gene (Modrek and Lee, 2002), is widespread across taxa (Tapial et al., 2017), and thus has the potential to be a common mechanism underlying phenotypic plasticity in many species. Alternative splicing in the response to environmental stress is widely observed in plants (Reddy et al., 2013; Capovilla et al., 2015; Filichkin et al., 2015; Thatcher et al., 2015; Calixto et al., 2018), but this mechanism has rarely been examined in animals (although see Polley et al., 2003; Marden, 2008; Huang et al., 2016; Jakšićand Schlötterer, 2016; Hopkins et al., 2018; Tan et al., 2018; Xia et al., 2018), and much remains unknown about its importance. Plasticity in response to chronic cold temperature is a particularly promising avenue to investigate the potential role of qualitative changes in gene expression in regulating reversible phenotypic change. Alternatively spliced variants ofΔ9-acyl CoA desaturase with temperature-sensitive expression patterns have been detected in common carp,Cyprinus carpio(Polley et al., 2003), and many transcriptomic studies examining quantitative changes in gene expression as a result of acclimation to low temperature have Received 27 September 2018; Accepted 23 January 2019
The University of British Columbia, Department of Zoology, 6270 University Boulevard, Vancouver, British Columbia, Canada V6T 1Z4.
*Present address: Marine Biology Research Division, Scripps Institution of Oceanography, University of California San Diego, 9500 Gilman Drive #0202, La Jolla, CA 92093-0202, USA.
‡Author for correspondence ([email protected])
T.M.H., 0000-0002-1880-6913; P.M.S., 0000-0002-5237-8836
Journal
of
Experimental
observed two key findings: (1) there is generally bias for upregulation of gene expression as a result of cold acclimation, and (2) there are generally functional enrichments for gene expression and RNA splicing in the genes that are differentially expressed in response to chronic cold temperatures (e.g. Gracey et al., 2004; Long et al., 2012, 2013; Scott and Johnston, 2012; Rebl et al., 2013; Bilyk and Cheng, 2014; Mininni et al., 2014; Morris et al., 2014; Liang et al., 2015; Healy et al., 2017; Metzger and Schulte, 2018). Moreover, these enrichments are often the best supported enrichments statistically, suggesting that changes in gene expression and splicing are important aspects of organismal responses when acclimated to low temperatures. However, splicing of mRNA transcripts is a normal component of RNA processing (e.g. Papasaikas and Valcárcel, 2016), and because cold acclimation typically results in upregulation of gene expression overall, functional enrichment for genes involved in RNA splicing could simply be a consequence of upregulated gene expression in general without substantial changes in splicing patterns or qualitative mRNA expression. Therefore, although changes in pre-mRNA splicing are promising candidate mechanisms for the basis of phenotypic plasticity, the extent to which splicing patterns vary in response to chronic temperature change in ectothermic animals remains unknown (Somero, 2018).
The lack of studies addressing temperature-mediated qualitative changes in gene expression is somewhat surprising, because data collected by RNA-seq, including those from previous studies, are amenable for the analysis of changes in splicing patterns or differential exon usage, and modifications of standard RNA-seq analysis packages that enable tests for differential exon usage are publically available (e.g. Anders et al., 2012). In the present study, we take advantage of previously published studies in three species of fish: Atlantic killifish (Fundulus heteroclitus; Healy et al., 2017), threespine stickleback (Gasterosteus aculeatus; Metzger and Schulte, 2018) and zebrafish (Danio rerio; Scott and Johnston, 2012). We re-analyze the data from these studies with an overall goal of assessing whether changes in mRNA splicing might play a role in plastic responses as a result of thermal acclimation in ectotherms. To address this goal, we focus on the following questions: (1) What is the extent of alternative splicing in response to cold acclimation? (2) Are alternatively spliced (AS) genes also differentially expressed (DE) genes? (3) What are the potential cellular functions that are influenced by qualitative changes in gene expression? (4) Are there genes that consistently demonstrate alternative splicing as a result of cold acclimation across species?
MATERIALS AND METHODS Data acquisition
Sequencing reads were obtained for three species of fish from previously published studies investigating quantitative changes in gene expression in response to acclimation to low temperatures:
Fundulus heteroclitus(Linnaeus 1766) [Healy et al., 2017: National Center for Biotechnology Information (NCBI) Sequence Read Archive (SRA) SRP091735], Gasterosteus aculeatus Linnaeus 1758 (Metzger and Schulte, 2018: NCBI SRA, SRP135801) and
Danio rerio(Hamilton 1822) [Scott and Johnston, 2012: European Bioinformatics Institute (EBI) Array Express Archive E-MTAB-1155]. From each of these studies, we utilized RNA-seq data from skeletal muscle collected from individuals acclimated to typical laboratory holding temperatures (F. heteroclitus: 15°C, n=8;
G. aculeatus: 18°C, n=6; D. rerio: 27°C, n=4), and individuals acclimated to relatively cold temperatures (F. heteroclitus: 5°C,
n=8;G. aculeatus: 8°C,n=6;D. rerio: 16°C,n=4). Thus, the cold acclimation treatments in the present study represent approximately 10°C decreases in acclimation temperature compared with typical laboratory holding temperatures for all three species. Fundulus heteroclituswere wild-caught and held under laboratory conditions (15°C) for at least 1 month prior to the start of experimental acclimations, which were 4 weeks long.Gasterosteus aculeatusand
D. rerio were laboratory-raised at 18°C and 27°C, respectively, and experimental acclimations in adult individuals were 4 weeks and 30 days, respectively. Holding photoperiods and salinities varied across species (F. heteroclitus: 12 h:12 h light:dark, 20 ppt;
G. aculeatus: 14 h:10 h light:dark, 20 ppt;D. rerio: 12 h:12 h light: dark, 0 ppt), but were consistent between acclimation treatments within each species. Additional methodological details for fish handling, muscle sampling and RNA-seq can be found in Healy et al. (2017), Metzger and Schulte (2018) and Scott and Johnston (2012).
Gene-wise read mapping and analysis of differential expression
To ensure differences in analytical pipelines among Healy et al. (2017), Metzger and Schulte (2018) and Scott and Johnston (2012) did not affect our comparisons of differential expression patterns among species, and our analysis of differential expression and alternative splicing within species, we re-analyzed differential gene expression as a result of cold acclimation in each species using a common analytical approach. Sequencing reads were mapped to the appropriate reference genome for each species [F. heteroclitus
reference genome 3.0.2 (NCBI); G. aculeatusreference genome (ENSEMBL v88);D. rerio reference genome (ENSEMBL v88)] with CLC Genomics Workbench v8.5 (CLC bio Qiagen®, Aarhus, Denmark). Unique exon counts were then exported and analyzed for differential expression using R v3.4.0 (https://www.r-project.org/) with the DESeq2 package v1.16.1 (Love et al., 2014). Differential expression was assessed with the approaches of Healy et al. (2017), which follow the recommendations of Lin et al. (2016). In brief, for each species, counts were normalized across libraries using the relative log expression method (Anders and Huber, 2010) using subsets of genes that excluded likely DE genes (detected in preliminary analyses). Genes were then filtered for low expression using counts per million cut-offs equivalent to 10 counts in the smallest library, and dispersions were calculated using the default methods of DESeq2. Healy et al. (2017) used the edgeR package (Robinson et al., 2010) rather than DESeq2; however, when parallel methodological steps are utilized, these packages generally result in similar estimates of differential gene expression (Lin et al., 2016). In the present study, we chose DESeq2 because the DEXSeq package (Anders et al., 2012) that we used for the differential exon usage analysis (below) is an extension of DESeq2, and our desire was to minimize bias in our comparisons of mRNA expression and alternative splicing owing to differences in bioinformatic List of abbreviations
AS alternatively spliced
BLAST basic local alignment search tool DE differentially expressed EBI European Bioinformatics Institute GFF general feature format
GO gene ontology GTF gene transfer format
NCBI National Center for Biotechnology Information SRA Sequence Read Archive
Journal
of
Experimental
techniques. Differential expression was tested by likelihood ratio tests (α=0.05), and false discovery rate was controlled using the Benjamini–Hochberg method (Benjamini and Hochberg, 1995).
Exon-wise read mapping and analysis of differences in alternative splicing
Differential exon usage was assessed using R and the package DEXSeq v1.22.0 (Anders et al., 2012). Note that DEXSeq examines all changes in exon usage, which include differences in both splicing patterns and usage of alternative transcription start sites. In this study, we refer to all significant effects detected with DEXSeq as ‘alternative splicing’to help clearly distinguish these results from those for differential gene expression; however, it is important to acknowledge that some of our results likely involve changes in transcriptional start site usage rather than splicing of pre-mRNAs after transcription has been completed. Regardless, all of these effects result in the expression of alternative mRNAs from the same gene. The first step of the DEXseq analysis involves preparing a ‘flattened’general feature format (GFF) file for the genome of each species, which essentially compresses different transcripts produced from the same gene into a single gene model with non-overlapping exon segments. Reads are then mapped to exon segments, and differential exon usage is detected by differences in read ratios for individual exon segments compared with differences in read ratios across all exon segments for a gene. We performed gene transfer format (GTF) file flattening and read mapping using python as described in the DEXSeq manual (available at http://bioconductor. org/packages/release/bioc/html/DEXSeq.html). DEXSeq has been designed to perform flattening with GTF files in standard ENSEMBL format. Thus, forG. aculeatus and D. reriowe were able to use the GTF files available for these reference genomes from ENSEMBL. The F. heteroclitus genome was not available from ENSEMBL at the time of our analyses, and the NCBI GFF file for this genome did not follow ENSEMBL formatting. Consequently, we converted theF. heteroclitusGFF file to the correct format to allow flattening with DEXSeq. We have made our converted GTF file forF. heteroclitusavailable online (EBI BioStudy S-BSST218), but other than formatting, it is essentially equivalent to the publically available GFF file from NCBI.
Exon read counts were analyzed for differential exon usage following the guidelines in the DEXSeq manual. Read counts were normalized, dispersions were calculated, and then differential exon usage was tested (α=0.05) using the default methods for DEXSeq. As for our analyses of differential gene expression, corrections for multiple comparisons in our differential exon usage analysis were made using the Benjamini–Hochberg method (Benjamini and Hochberg, 1995).
Analysis of functional enrichment
Functional enrichment analyses for the sets of genes demonstrating differential gene expression or alternative splicing were conducted with the R package goseq v1.28.0 (Young et al., 2010) and species-specific databases of gene ontology (GO) terms. GO annotations for the genes in the D. rerioreference genome were obtained from ENSEMBL BioMart. Fundulus heteroclitus GO terms were determined from UniProt accession numbers for zebrafish, mouse (Mus musculus) and human (Homo sapiens) orthologs of killifish genes (Reid et al., 2016), as in Healy et al. (2017).Gasterosteus aculeatusgene GO annotations were accessed from the GO database in Metzger and Schulte (2016). All GO databases have been provided online (EBI BioStudy S-BSST218). We assessed significant enrichment of GO functional terms for (1) DE and AS
genes in each species separately, and (2) common DE or AS genes across the three species. In all cases,αwas set at 0.05, andP-values were corrected to account for false discovery rate using the Benjamini–Hochberg method (Benjamini and Hochberg, 1995).
Identification of putative orthologs
Comparison of DE and AS genes within each species was straightforward, as genes could be matched based on their gene identifiers. However, to compare DE or AS genes across species, and thus to identify genes that were commonly differentially expressed or alternatively spliced as a result of cold acclimation, it was necessary to identify putative orthologous genes across the species.
A reciprocal basic local alignment search tool (BLAST) strategy was used to identify putative orthologs (Moreno-Hagelsieb and Latimer, 2007). We downloaded the NCBI command-line based BLAST program, and created a local BLAST database for all mRNA transcripts associated with the reference genomes for each species in our study (three databases total). For the DE genes in each species, we queried the mRNA databases for the other two species. We kept the top 10 BLAST hits for each gene, and then filtered hits for e-value <0.000001 and query coverage ≥33.3%. For some genes, several of the top BLAST results with e-value <0.000001 mapped to different regions of the same target transcript. In these cases, the non-overlapping query coverage was summed across results prior to application of the coverage filter. This procedure was repeated for the lists of genes demonstrating alternative splicing, and resulted in high-quality BLAST results for between 72.1% and 96.0% of the genes for each pair of species across the DE or AS genes. Putative orthologs were then determined by limiting BLAST results to pairs of genes between species that were identified as top BLAST hits in each reciprocal BLAST pair (i.e. query sequence for species A returns target gene in species B, query sequence for species B returns target gene in species A, query sequence for species A equals target gene in species A, and query sequence for species B equals target gene in species B). Note that this analysis does not preclude a gene in one species pairing with more than one gene in another species. We maintained this possibility in our analyses because differences in genome quality, annotation methods, gene duplication and retention of duplicated genes could result in one gene legitimately being the best high-quality match for more than one gene in another species (and vice versa). In these cases, it can be difficult to determine conclusively which cross-species pair of genes represents the true orthologous pair. Therefore, we decided to keep all potential orthologous pairs identified by our reciprocal BLAST strategy without requiring 1 to 1 hits; however, we accounted for the possibility of 1 to >1 hits when determining the number of commonly DE or AS genes across species (i.e. a 1 to 2 reciprocal BLAST result was counted as evidence of a single overlapping pair of orthologs, whereas a 2 to 2 result was counted as two overlapping pairs of orthologs, etc.). Orthologous genes identified by these analyses are available in Table S1.
Splicing patterns of the common AS genes were investigated by plotting the relative exon expression for each gene in each species with a modified version of the plotDEXSeq() function from the DEXSeq package.
RESULTS
Patterns of differential expression and alternative splicing within species
Overall patterns of differential gene expression in response to cold acclimation in each species were similar to those published
Journal
of
Experimental
previously (Scott and Johnston, 2012; Healy et al., 2017; Metzger and Schulte, 2018), and consequently only a brief description of these results is presented here. In total, 6719 genes inF. heteroclitus, 8310 genes inG. aculeatusand 4555 genes inD. rerio(Table S2) were differentially expressed as a result of cold acclimation. Thus, in all three species, acclimation to low temperatures involved changes in expression of a large proportion of the transcriptome (17.9–42.6%). Additionally, substantially more genes increased in expression than decreased in expression in all three species: 68.8%, 65.8% and 61.7% of the total DE genes in killifish, stickleback and zebrafish, respectively (Fig. S1). This pattern had been observed previously for killifish and stickleback (Healy et al., 2017; Metzger and Schulte, 2018), but not for zebrafish (Scott and Johnston, 2012), and the difference between these results for zebrafish is likely due to the use of a modified RNA-seq normalization in the present study. Consistent with this possibility, a bias towards upregulated gene expression in response to cold acclimation was typical in transcriptomic studies prior to the use of RNA-seq (e.g. Gracey et al., 2004).
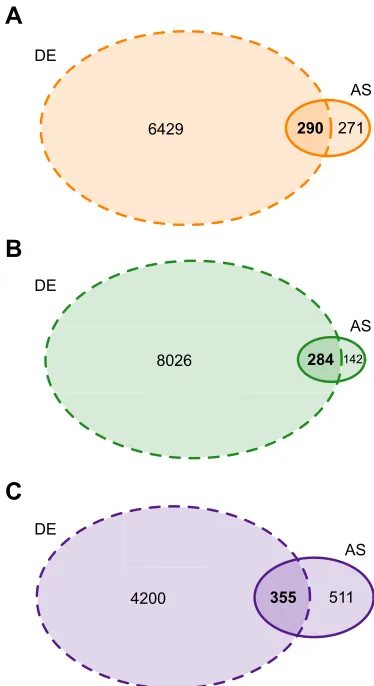
In comparison with the substantial proportions of the transcriptome that changed expression quantitatively as a result of cold acclimation, cold-acclimation-mediated qualitative changes in gene expression through alternative splicing were relatively modest. However, acclimation to low temperature still resulted in significant differences in splicing in a large number of genes in each species: 561 in killifish, 426 in stickleback and 866 in zebrafish (Table S2). This indicates that the expression of AS transcripts is likely a considerable component of the responses to chronic exposure to cold temperature in these species. In addition, 51.7%, 66.7% and 41.0% of the AS genes in killifish, stickleback and zebrafish, respectively, were also differentially expressed as a result of cold acclimation (Fig. 1), suggesting that relatively high proportions of AS genes are also differentially expressed.
Functional enrichment within differentially expressed or alternatively spliced genes
To summarize potential cellular functions involved in responses to chronic low temperatures, we performed GO enrichment analyses for the DE or AS genes in each species. Given the similarities between the DE genes detected in the present study and those observed in previous studies, we expected that GO enrichment analyses would also reveal similar functional enrichments to those published previously (Scott and Johnston, 2012; Healy et al., 2017; Metzger and Schulte, 2018), which they did. As a result, these results are not described in detail here. However, 76, 113 and 29 GO terms were detected as significantly enriched for differential expression in F. heteroclitus, G. aculeatus and D. rerio, respectively, and lists of these GO terms can be found in Table S3. Importantly in the context of the present study, biological process GO terms for gene expression (GO:0010467), mRNA splicing via spliceosome (GO:0000398) and RNA splicing (GO:0008380), and cellular component GO terms for catalytic step 2 spliceosome (GO:0071013) and spliceosomal complex (GO:0005681) are among the enriched GO terms with the lowest
P-values for enrichment in killifish and stickleback (P≤9.44×10⁻⁹ for all). Interestingly, these terms are absent from the enriched GO terms in zebrafish, despite the fact that the highest number of AS genes in response to cold acclimation was found in zebrafish (866 versus 561 and 426).
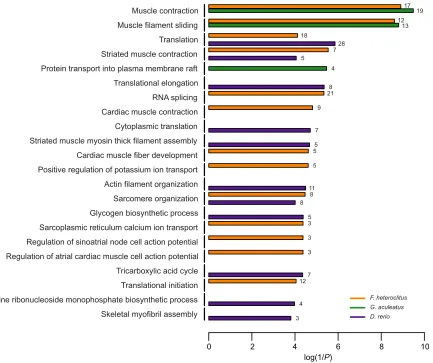
Not surprisingly, given the lower numbers of AS genes compared with DE genes (Fig. 1), fewer GO terms were significantly enriched for AS genes regardless of species. There were 27 enrichments in
killifish, 15 in sticklebacks and 24 in zebrafish (Table S3). As GO biological processes (rather than cellular components or molecular functions) often provide the most insight into the specific cellular functions demonstrating enrichment, Fig. 2 highlights the significantly enriched biological process terms for all three species. In total across the three species, 22 GO biological processes demonstrated enrichment for alternative splicing. Again, in the context of the present study, one particularly notable result is that RNA splicing (GO:0008380) was significantly enriched for AS genes in response to chronic low temperature inF. heteroclitus. Yet, no GO biological process was enriched in all three species, and moreover, most terms were enriched in only one of the species. These observations suggest that although many qualitative changes in gene expression as a result of cold acclimation are observed in each species, there is substantial divergence in the cellular processes with enriched numbers of AS genes. However, there was a clear pattern for functional enrichments of different GO biological processes associated with muscle contraction or regulation of muscle contraction in all three species [e.g. muscle contraction (GO:0006936) in killifish and stickleback, and striated muscle contraction in zebrafish (GO:0006941)], and GO cellular component and molecular function enrichments that are common in all species [e.g. muscle myosin complex (GO:0030018) and structural constituent of muscle (GO:0008307)] also suggest that
6429 290 271
DE
AS
A
8026 284 142
DE
AS
B
4200 355 511
DE
[image:4.612.343.530.57.400.2]AS
C
Fig. 1. Venn diagrams displaying the numbers of significant differentially expressed (DE) and alternatively spliced (AS) genes as a result of cold acclimation in the three study species.(A)Fundulus heteroclitus
(orange), (B)Gasterosteus aculeatus(green) and (C)Danio rerio( purple). DE genes: dashed outline; AS genes: solid outline.
Journal
of
Experimental
alternative splicing of genes involved in contraction is likely common across the species. Thus, there may be more conservation of cellular functions associated with cold-acclimation-mediated alternative splicing than is evident based on comparison of specific GO terms alone.
Comparison of differential expression and alternative splicing across species
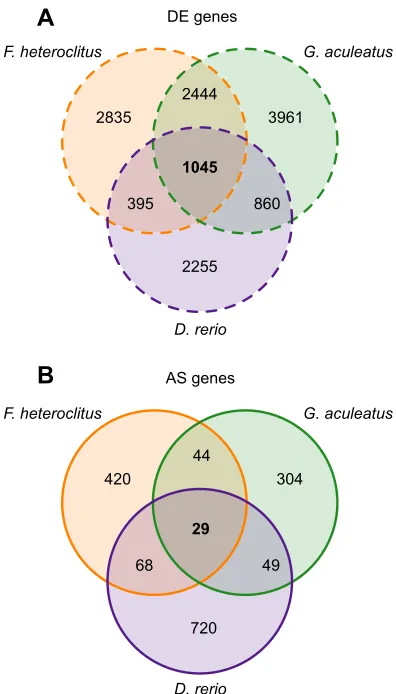
To compare patterns of differential gene expression and alternative splicing across killifish, stickleback and zebrafish, we identified putative orthologs across the species for each significant DE or AS gene (see Materials and Methods). The overlap in DE or AS genes among species is displayed in Fig. 3. A total of 1045 common DE genes and 29 common AS genes were detected among the three species (Fig. 3A,B, respectively). Thus, 12.6–22.9% of all DE genes in a species were part of a suite of genes that were differentially expressed in response to cold acclimation regardless of species, whereas 3.3–6.8% of all AS genes were found commonly in all species ( percentage ranges are due to differences in total number of DE or AS genes among species). These results reveal a clear pattern that there is substantial divergence among species in both quantitative and qualitative changes in gene expression as a result of cold acclimation. However, the genes that consistently
demonstrate differential expression or alternative splicing across species potentially represent a subset of genes involved in core responses to chronic cold temperatures.
The common genes that were differentially expressed as a result of cold acclimation are listed in potential ortholog groups in Table S4. To examine the potential functions that are affected by changes in expression of the common DE genes, we performed GO enrichment analyses for these DE genes in each species. We reduced the influence of differences in GO annotation across the genomes by keeping only the significantly enriched GO terms found in all three species, resulting in 21 significantly enriched GO terms (Table 1). Taken together, these GO terms clearly indicate that common DE genes are primarily enriched for involvement in proteasome function (e.g. positive regulation of proteasomal protein catabolic process; GO:1901800), although there is some indication for enrichment of genes involved in spliceosome function as well (e.g. catalytic step 2 spliceosome; GO:0071013).
We assessed potential functional enrichments for the common AS genes using the same approach as the one described above for the common DE genes. Three significant GO enrichments were identified for the AS genes observed in all species, which all indicated enriched alternative splicing for genes involved in the structure or function of the contractile apparatus (Table 1). Skeletal myofibril assembly
Purine ribonucleoside monophosphate biosynthetic process Translational initiation Tricarboxylic acid cycle Regulation of atrial cardiac muscle cell action potential Regulation of sinoatrial node cell action potential Sarcoplasmic reticulum calcium ion transport Glycogen biosynthetic process Sarcomere organization Actin filament organization Positive regulation of potassium ion transport Cardiac muscle fiber development Striated muscle myosin thick filament assembly Cytoplasmic translation Cardiac muscle contraction RNA splicing Translational elongation Protein transport into plasma membrane raft Striated muscle contraction Translation Muscle filament sliding Muscle contraction
3 4 12
7 3 3 3 5 8
8 11 5 5 5 7 9
21 8 4 5
7 28 18
13 12
19 17
log(1/P)
0 2 4 6 8 10
[image:5.612.98.531.56.419.2]F. heteroclitus G. aculeatus D. rerio
Fig. 2. Gene ontology (GO) biological processes demonstrating significant enrichment for genes demonstrating alternative splicing in killifish (orange), stickleback (green) and zebrafish ( purple).Enriched GO terms are listed on they-axis. Horizontal bars indicate inverse logP-values for each term in each species. If a GO term is missing a bar for a species, that term was not significantly enriched in the missing species. Numbers to the right of each bar display the number of alternatively spliced genes in that species with the corresponding GO annotation.
Journal
of
Experimental
However, with the relatively small number of common AS genes, examining specific genes rather than summary enrichment analyses alone may be more appropriate for these genes. The 29 common AS genes across species are listed in putative orthologous groups in Table 2 (note the numbers of overlapping genes are calculated as described in the Materials and Methods). As expected from the GO enrichment results for these genes, several genes are involved in muscle contraction or the structure of the contractile apparatus (atp2a1l,myom1b,smyhc1,ryr1,mybph,cacna1s,smyd1b,myh13
and tnnt2e). However, genes involved in other cellular functions also demonstrated alternative splicing in all three species. For example, there were cold-acclimation-mediated changes in splicing of genes involved in metabolic processes such as glycogen breakdown (phkg1and phkb) and glycolysis (aldoa andpfkfb4). Additionally, cold shock domain-containing protein E1 (csde1), which is an RNA binding protein involved in RNA stability and regulation of translation (Mihailovich et al., 2010), is alternatively spliced in all three species. This gene is named for cold shock domains in the protein that were originally identified in bacterial cold shock proteins that increase in expression at low temperature to improve cellular function and growth in the cold (Horn et al., 2007; Mihailovich et al., 2010).
Although there were 29 common AS genes in killifish, stickleback and zebrafish, sharing statistical significance for alternative splicing
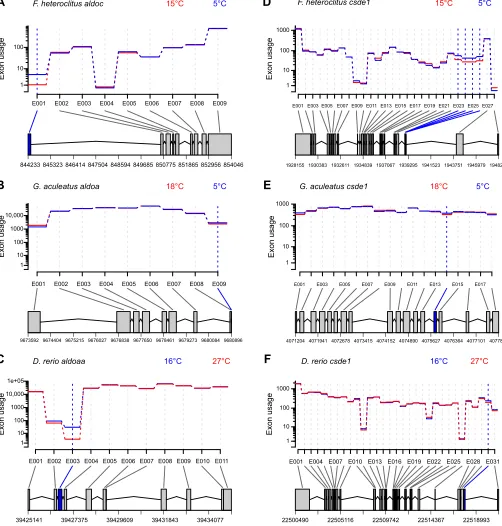
does not necessarily mean that these genes demonstrate the same splicing patterns in all three species. As a result of differences in quality of genome annotation among the three species (e.g. the extent of expression data used in annotation) and the consequences of these differences on generating a‘flattened’GFF file, it is challenging to compare specific exon segments across the species. Regardless, for the majority of these genes, patterns of alternative splicing were variable among the species (based on the region of the gene demonstrating differential exon usage and the direction in which exon usage changed in response to cold acclimation) with little evidence for consistent changes in exon usage in general (see supporting figures from the EBI BioStudy S-BSST218, available at https://www.ebi.ac.uk/biostudies/studies/S-BSST218). However, in some cases, there were similarities between at least a pair of the species (e.g.atp2a1l,eif4a2,flnandfry; see figs 4, 10, 12 and 13 from the EBI BioStudy S-BSST218), and aldoa and csde1 had similar changes in alternative splicing in all three species, although the extent of these changes was much smaller in G. aculeatus
than in the other two species. For aldoa (annotated as aldoc in
F. heteroclitus), an exon near the start of the gene was expressed at higher levels in all of the cold-acclimated fish (q≤0.03; Fig. 4A–C; note that the orientation ofaldoain theG. aculeatusgenome is in the opposite direction to the orientation in the other two genomes). For
csde1, an exon or exons in the front half of the gene also had higher usage in fish acclimated to cold temperatures regardless of species (q≤0.01; Fig. 4D–F). Thus, despite most of the common AS genes sharing only the general characteristic of expression of different splice variants as a result of cold acclimation, it is possible that some specific changes in exon expression are also shared across species.
DISCUSSION
This study clearly demonstrates that qualitative changes in gene expression as a result of changes in mRNA splicing patterns likely play a role in phenotypic plasticity in ectothermic vertebrates. There were substantial changes in splicing patterns in cold-acclimated fish in all three of the species examined in the present study, although fewer genes demonstrated qualitative than quantitative changes in expression. Large proportions of the AS genes were also differentially expressed, and many AS genes were involved in cellular processes that have previously been identified as important components of plastic responses to chronic cold. Furthermore, despite an overall pattern of divergence in cold-acclimation-mediated splicing patterns across species, there was a small set of common AS genes in killifish, stickleback and zebrafish, suggesting that alternative splicing of a subset of common genes may play a role in regulating plasticity as a result of cold acclimation in fishes, or potentially ectotherms, in general.
Role of changes in mRNA splicing patterns in plasticity as a result of cold acclimation
Large-scale quantitative rearrangement of the transcriptome is commonly observed in response to prolonged exposure to cold temperatures in ectotherms (e.g. Gracey et al., 2004), and the results presented here are consistent with this expectation as between ∼20% and ∼40% of the expressed genes in skeletal muscle demonstrated cold-acclimation-mediated differential expression, depending on the species examined (6719 of 22,120 in
F. heteroclitus; 8310 of 19,520 inG. aculeatus; 4555 of 25,477 in
D. rerio). Generally, these transcriptional rearrangements suggest several hallmark cellular responses to the effects of low temperature: (1) bias towards upregulation of gene expression, (2) cellular stress responses including upregulation of genes involved in protein 1045
29
F. heteroclitus G. aculeatus
D. rerio
F. heteroclitus G. aculeatus
D. rerio DE genes
2835
2444
3961
395 860
2255
420
44
304
68 49
720 AS genes
A
[image:6.612.75.273.56.403.2]B
Fig. 3. Venn diagrams displaying the numbers of common differentially expressed (DE) or alternatively spliced (AS) genes as a result of cold acclimation among killifish (orange), stickleback (green) and zebrafish ( purple).Numbers of DE (A, dashed outline) or AS (B, solid outline) genes common in all three species are in bold.
Journal
of
Experimental
folding, protein ubiquitination, proteasome and DNA repair functions, (3) upregulation of genes involved in mRNA expression, RNA processing and pre-mRNA splicing, and (4) enriched differential expression of genes involved in metabolic pathways (Itoi et al., 2003; Gracey et al., 2004; Vornanen et al., 2005; Chou et al., 2008; Castilho et al., 2009; Vergauwen et al., 2010; Long et al., 2012, 2013; Scott and Johnston, 2012; Jayasundara et al., 2013, 2015; Rebl et al., 2013; Bilyk and Cheng, 2014; Mininni et al., 2014; Morris et al., 2014; Wang et al., 2014; Hu et al., 2015; Liang et al., 2015; Verleih et al., 2015; Healy et al., 2017; Ikeda et al., 2017; Metzger and Schulte, 2018). However, the direction of differential expression of metabolic genes is species-specific and likely indicates differences in metabolic strategy (i.e. thermal compensation, no compensation or inverse compensation) as a result of chronic cold (Precht, 1958; Guderley, 2004; Healy et al., 2017). As expected, the results of our re-analyses to compare cold-acclimation-mediated differential expression across species were consistent with these established patterns. Together, these patterns suggest that the major cellular responses as a result of cold acclimation are thermal compensation of gene expression, upregulation of protective mechanisms to compensate for the effects of cold on protein and RNA structure and folding, modification of metabolic energy supply and demand, and, potentially, changes in mRNA splicing patterns.
In comparison with the extent of quantitative changes in gene expression as a result of cold acclimation, qualitative changes to the mRNA pool in response to chronic cold were relatively modest. Additionally, many of the detected changes in exon usage in the present study represented relatively small fold changes in the abundance of specific exons (see Table S2). However, several hundred genes demonstrated cold-acclimation-mediated alternative splicing in each species, representing a sizeable transcriptional response. For comparison, quantitative changes in mRNA expression as a result of acute changes in temperature often involve similar numbers of genes as the numbers of AS genes in the
present study (e.g. Gasch et al., 2000; Buckley et al., 2006; Schoville et al., 2012; Gleason and Burton, 2015). Furthermore, our study only examined changes in splicing patterns following prolonged exposure to cold temperatures that most likely reflect steady-state changes after acclimation, and it is possible that additional genes demonstrate transient changes in splicing associated with earlier stages of cold acclimation. Together, these observations suggest that changes in mRNA splicing are likely important aspects of transcriptional responses to cold acclimation, and that qualitative changes in gene expression may play an underappreciated mechanistic role underlying phenotypic plasticity in ectothermic animals.
[image:7.612.53.563.79.333.2]The possibility that changes in splicing patterns play a key role in cold acclimation is further supported by functional enrichments associated with alternative splicing in killifish, stickleback and zebrafish. Although there was little evidence for common enriched GO terms across the species, which may, in part, be a consequence of differences in the quality or extent of the annotation databases for the different genomes, when the species were considered separately there were functional enrichments that were consistent with several of the major cellular responses to cold acclimation described above. For example, there was enriched alternative splicing for genes involved in RNA splicing (GO:0008380), poly(A) RNA binding (GO:0044822) and the tricarboxylic acid cycle (GO:0006099), suggesting AS genes associated with changes in splicing patterns, RNA chaperoning and metabolic pathways in killifish, stickleback and zebrafish, respectively. Similar temperature-mediated changes in exon usage associated with RNA splicing and binding are also common in plants (Capovilla et al., 2015; Filichkin et al., 2015; Calixto et al., 2018). Even at the level of specific genes, variation in splicing patterns in killifish and zebrafish was observed for genes that have previously been highlighted for their responses and roles in cold acclimation, such as cold-inducible RNA binding protein (cirbp; Gracey et al., 2004; Sano et al., 2015). We also observed substantial evidence for enrichment of AS genes associated with
Table 1. Significantly enriched gene ontology (GO) annotations for differentially expressed (DE) or alternatively spliced (AS) genes that were identified inFundulus heteroclitus,Gasterosteus aculeatusandDanio rerio
Common response GO category GO term GO ontology
DE genes GO:1901800 Positive regulation of proteasomal protein catabolic process BP
GO:0006511 Ubiquitin-dependent protein catabolic process BP
GO:0030433 Ubiquitin-dependent ERAD pathway BP
GO:0006457 Protein folding BP
GO:0000502 Proteasome complex CC
GO:0005839 Proteasome core complex CC
GO:0019773 Proteasome core complex, alpha-subunit complex CC
GO:0031595 Nuclear proteasome complex CC
GO:0008540 Proteasome regulatory particle, base subcomplex CC
GO:0031597 Cytosolic proteasome complex CC
GO:0005634 Nucleus CC
GO:0071013 Catalytic step 2 spliceosome CC
GO:0005838 Proteasome regulatory particle CC
GO:0004298 Threonine-type endopeptidase activity MF
GO:0005524 ATP binding MF
GO:0003723 RNA binding MF
GO:0036402 Proteasome-activating ATPase activity MF
GO:0016887 ATPase activity MF
GO:0051082 Unfolded protein binding MF
GO:0004004 ATP-dependent RNA helicase activity MF
GO:0008307 Structural constituent of muscle MF
AS genes GO:0006941 Striated muscle contraction BP
GO:0005859 Muscle myosin complex CC
GO:0030018 Z disc CC
BP, biological process; CC, cellular component; MF, molecular function.
Journal
of
Experimental
contractile structures and functions, which is clearly consistent with changes in splicing associated with a central function of muscle tissue that is known to demonstrate plasticity in response to temperature change (Johnston et al., 1990; Johnston and Temple, 2002). Therefore, many of the major cellular processes showing plasticity through changes in gene expression as a result of cold
acclimation demonstrate not only quantitative but also qualitative responses.
[image:8.612.51.564.72.654.2]Given the similarities between the cellular processes associated with differential expression and alternative splicing as a result of cold acclimation, it is perhaps not surprising that large proportions of AS genes are also DE genes across the species in the present study (61.7–
Table 2. Ortholog groups for the 29 common alternatively spliced (AS) genes identified in all species
Fundulus heteroclitus Gasterosteus aculeatus Danio rerio
Gene ID Gene name Gene ID Gene name Gene ID Gene name
XM_012850409.1 Unannotated ENSGACG00000007397 atp2a1l ENSDARG00000005122 atp2a2b
XM_012882589.1 Unannotated ENSDARG00000035458 atp2a1l
XM_012851609.1 Unannotated ENSGACG00000016054 eif4a2 ENSDARG00000016477 eif4a2
XM_012861028.1 eif4a2
XM_012853116.1 Unannotated ENSGACG00000004209 myom1b ENSDARG00000104836 myom1b
ENSGACG00000017095 myom1a
XM_012853388.1 Unannotated ENSGACG00000002145 smyhc1 ENSDARG00000098747 wdr48a
XM_012882788.1 Unannotated ENSGACG00000014960 vmhc
XM_012882790.1 Unannotated
XM_012853621.1 dst ENSGACG00000006193 dst ENSDARG00000101858 dst
XM_012855227.1 aldoc ENSGACG00000007727 aldoa ENSDARG00000011665 aldoaa
XM_012855337.1 Unannotated ENSGACG00000020663 ryr1a ENSDARG00000023797 ryr1b
XM_012872435.1 Unannotated XM_012875795.1 Unannotated
XM_012858979.1 obsl1 ENSGACG00000002287 Unannotated ENSDARG00000077388 obsl1b
XM_012859198.1 Unannotated ENSGACG00000004833 capn1a ENSDARG00000055338 capn1_1
XM_012861416.1 ank2 ENSGACG00000001623 ank2b ENSDARG00000043313 ank2b
XM_012861906.1 csde1 ENSGACG00000004544 csde1 ENSDARG00000074758 csde1
XM_012862064.1 col12a1 ENSGACG00000006800 col12a1 ENSDARG00000078322 col12a1a
XM_012862152.1 pfkfb4 ENSGACG00000000815 pfkfb4b ENSDARG00000055540 pfkfb4a
XM_012863717.1 Unannotated ENSGACG00000009822 pfkfb4a
XM_012862871.1 fam13a ENSGACG00000017308 fam13a ENSDARG00000075564 fam13a
ENSDARG00000076779 fam13b
XM_012863539.1 osbp2 ENSGACG00000008560 Unknown ENSDARG00000022772 osbp2
XM_012865180.1 Unannotated ENSGACG00000005023 mybphb ENSDARG00000003081 mybphb
ENSDARG00000058799 mybpha
XM_012866471.1 cacna1s ENSGACG00000008900 cacna1sb ENSDARG00000042552 cacna1sb
XM_012866628.1 usp28 ENSGACG00000020768 usp28 ENSDARG00000008880 usp28
ENSDARG00000012314 usp25
XM_012868087.1 phkg1 ENSGACG00000008901 phkg1b ENSDARG00000069498 phkg1b
XM_012869963.1 Unannotated ENSGACG00000006585 smyd1b ENSDARG00000091253 smyd1b
XM_012870952.1 Unannotated ENSGACG00000002902 myh13_3 ENSDARG00000012944 myhz2
XM_012870969.1 Unannotated ENSGACG00000002955 Unannotated ENSDARG00000095930 myha
XM_012872715.1 Unannotated ENSGACG00000010018 myh13_2 ENSDARG00000102414 myh13
XM_012871229.1 ammecr1 ENSGACG00000020290 ammecr1 ENSDARG00000012892 ammecr1
XM_012873992.1 phkb ENSGACG00000014907 Unannotated ENSDARG00000078284 phkb
XM_012876760.1 flnc ENSGACG00000013098 Unannotated ENSDARG00000074201 flna
XM_012878659.1 Unannotated ENSGACG00000011469 frya ENSDARG00000056001 fryb
XM_012879504.1 ddx3x ENSGACG00000008206 ddx3a ENSDARG00000005774 ddx3b
ENSGACG00000014407 Unannotated
XM_012880261.1 Unannotated ENSGACG00000004200 tnnt2e ENSDARG00000045822 tnnt2e
Journal
of
Experimental
68.8%). It is possible that this overlap between AS and DE genes is simply a function of the large-scale quantitative transcriptomic changes that are associated with cold acclimation. However, in all three species, the percentage of AS genes that are differentially expressed is at least 23.2% higher than the percentage of all expressed genes that are differentially expressed. Thus, it is also possible that our results indicate a bias for differential expression of genes that are also alternatively spliced. Regardless, our data clearly demonstrate
that quantitative and qualitative changes in expression are not exclusive at the gene level, and may highlight genes that play important roles in regulating cold-acclimation-mediated plasticity as there are both changes in transcript amounts and types for these genes. The number of genes demonstrating both quantitative and qualitative responses may also suggest that any potential consequences of the two processes are at least somewhat independent or complementary (i.e. quantitative transcript
1 10 100 1000
Exon usage
E001 E004 E007 E010 E013 E016 E019 E022 E025 E028 E031
22500490 22505116 22509742 22514367 22518993
D. rerio csde1 16°C 27°C
1 10 100 1000
Exon usage
E001 E003 E005 E007 E009 E011 E013 E015 E017 E019 E021 E023 E025 E027
1928155 1930383 1932611 1934839 1937067 1939295 1941523 1943751 1945979 1948207 F. heteroclitus csde1 15°C 5°C
1 10 100 1000
Exon usage
E001 E003 E005 E007 E009 E011 E013 E015 E017
4071204 4071941 4072678 4073415 4074152 4074890 4075627 4076364 4077101 4077838 G. aculeatus csde1 18°C 5°C
A
B
C
D
E
F
1 10 100
Exon usage
E001 E002 E003 E004 E005 E006 E007 E008 E009
844233 845323 846414 847504 848594 849685 850775 851865 852956 854046
F. heteroclitus aldoc 15°C 5°C
1 10 100 1000 10,000
Exon usage
E001 E002 E003 E004 E005 E006 E007 E008 E009
9673592 9674404 9675215 9676027 9676838 9677650 9678461 9679273 9680084 9680896 G. aculeatus aldoa 18°C 5°C
1 10 100 1000 10,000 1e+05
Exon usage
E001 E002 E003 E004 E005 E006 E007 E008 E009 E010 E011
39425141 39427375 39429609 39431843 39434077
[image:9.612.54.556.63.589.2]D. rerio aldoaa 16°C 27°C
Fig. 4. Plots of relative exon expression (usage) in cold-acclimated (solid blue lines) and warm-acclimated (solid red lines) fish for two orthologs in the three study species as a result of cold acclimation.(A–C) Aldolase and (D–F) cold shock domain-containing protein E1 in killifish (A,D), stickleback (B,E) and zebrafish (C,F). Exons with significant differential exon usage are indicated by vertical blue or red dashed lines (blue: higher usage in cold-acclimated fish; red: higher usage in warm-acclimated fish). A graphical summary of exon usage for the flattened gene model for each gene and species is displayed below each plot (grey boxes: exons without differential usage; blue boxes: exons with higher expression in cold-acclimated fish; joining lines: introns).
Journal
of
Experimental
responses cannot be achieved qualitatively, and vice versa), which would emphasize the importance of understanding the contributions of both types of transcriptomic change in regulating cellular plasticity. With regards to this consideration, important caveats are that mRNA levels do not always directly reflect protein levels (e.g. Gygi et al., 1999), and not all transcripts necessarily undergo translation, particularly under stressful conditions (e.g. Mollet et al., 2008). Thus, the extent to which alternative mRNA transcripts lead to alternative proteins remains unresolved (Tress et al., 2017; Blencowe, 2017). Therefore, confirmation that the qualitative changes observed here result in the expression of alternative protein forms with functional differences is an important next step.
One particularly interesting process demonstrating both quantitative and qualitative changes in mRNA expression in the cold is RNA splicing itself. For instance, GO terms associated with RNA processing have enrichment for differential gene expression as a result of cold acclimation in killifish, stickleback and zebrafish, and at least in killifish similar GO terms are also enriched for alternative splicing. Overall thermal compensation of gene expression likely contributes to some of these quantitative changes in the expression of splicing genes. However, qualitative changes in the expression of these genes are consistent with differences in splicing patterns rather than simply the amount of splicing machinery present in the cell. Splicing patterns are temperature-sensitive in yeast (Meyer et al., 2011), and many genes involved in regulation of splicing express AS mRNAs in response to changes in temperature in plants (Lazar and Goodman, 2000; Iida et al., 2004; Palusa et al., 2007; Capovilla et al., 2015). Similarly, several splicing factors (e.g.sf3b1,srsf3andsfpq) also demonstrated alternative splicing as a result of prolonged exposure to low temperatures in our study.
Quantitative and qualitative differential gene expression across species
Considering the overall similarities in cellular processes demonstrating differential gene expression and alternative splicing as a result of cold acclimation across studies and species, it is remarkable the extent of divergence in specific differential expression or alternative splicing patterns among even the three species of fish examined in the present study. Moreover, this is the case if either specific genes (DE or AS) or enriched cellular functions associated with these genes are compared. Several possibilities could contribute to these differences in gene expression responses across species. (1) Although similar relative cold exposures were compared across species in our study, the specific temperature ranges, and thus the intensity of cold exposure, for each species may change the effects of cold temperature on cellular function. For example, state-transitional effects of biological membranes occur below 10°C inF. heteroclitus, which results in dramatic differences in the effects of cold shock at temperatures above or below this threshold (Buhariwalla et al., 2012; Malone et al., 2015). Thus, 15–18°C to 5°C in killifish and stickleback may represent a substantially different physiological challenge than 27°C to 16°C in zebrafish. However, this would suggest that comparisons of the DE or AS genes in killifish and stickleback should be more similar than the same comparisons for either species with zebrafish, and our data are not consistent with this pattern. (2) The time course of cold acclimation may vary across the species in our study. Despite examining gene expression after prolonged acclimation in all three species, it is possible that expression levels of some genes had not reached a new steady state in the cold at the time of sample collection. For these genes,
differences in the time course of changes in mRNA expression could contribute to the variation in expression patterns among species. (3) Metabolic strategies in response to prolonged cold temperatures often differ among species, and previous studies have suggested that killifish do not compensate for the slowing effects of low temperatures on metabolic functions in skeletal muscle (Healy et al., 2017), whereas stickleback and zebrafish display thermal compensation (Metzger and Schulte, 2018; Scott and Johnston, 2012), which is consistent with divergence of gene expression patterns. (4) Our reciprocal BLAST strategy for ortholog identification may have been conservative, which would reduce the potential for overlapping DE or AS genes across the species. (5) Lastly, variation in GO annotations (e.g. level of annotation) of the killifish, stickleback and zebrafish genomes almost certainly reduces the overlap in enriched annotations associated with the DE or AS genes in each species, and, as discussed above, functional overlap is likely higher than comparisons of specific annotations alone. Although these possibilities may partially explain the observed divergence of differential expression and alternative splicing among species in the present study, it is unlikely that they do so completely. Thus, our data suggest that the bulk of either quantitative or qualitative changes in gene expression in response to cold acclimation are not conserved across species.
Despite this overall pattern of divergence in gene expression, there were subsets of both DE and AS genes that were commonly detected across killifish, stickleback and zebrafish. These genes may be involved in cellular responses to prolonged exposure to cold temperature that occur regardless of species. Consistent with greater numbers of genes demonstrating quantitative changes in gene expression than qualitative changes, higher numbers of DE genes than AS genes were commonly detected across species. Indeed, this exceeded the extent that would be expected from the numbers of DE or AS genes alone, as 12.6–22.9% of all DE genes were commonly identified in all three species, whereas this was the case for only 3.3– 6.8% of AS genes. Therefore, our data indicate that there may be more conservation of quantitative than qualitative changes in gene expression as a result of cold acclimation. This raises the intriguing possibility that this may be a common aspect of plastic changes in gene expression, and could suggest that qualitative changes in gene expression are involved in species-specific responses.
Genes that were commonly differentially expressed in response to chronic cold temperature in killifish, stickleback and zebrafish were enriched for those involved in many of the major cellular functions known to respond to cold acclimation described above (e.g. RNA splicing, proteasome function and metabolic pathways). This suggests that at least some aspects of quantitative changes associated with these central cellular responses are observed across species. In contrast, only functional annotations related to muscle contraction [striated muscle contraction (GO:0006941), muscle myosin complex (GO:0005859) and Z disc (GO:0030018)] were enriched among the AS genes that were commonly identified in the three species. These results may be consistent with differences in the roles of quantitative and qualitative changes in gene expression as suggested above. Given the high structural dependence of muscle contractile functions, structural changes in proteins as a result of changes in splicing patterns may be necessary to adjust contractile function adequately either to reduce energetic demands or to compensate for the slowing thermodynamic effects of low temperatures. This possibility would be consistent with previous work demonstrating functional consequences of the expression of alternative troponin-T transcripts in the flight muscles of male dragonflies (Marden et al., 1999, 2001; Marden,
Journal
of
Experimental
2008), and temperature-mediated changes in myosin isoform expression in common carp that improve muscle performance at either warm or cold temperatures (Goldspink, 1995). Despite functional enrichment of common AS genes, indicating that these genes are not involved in the central responses previously associated with cold-acclimated-mediated changes in gene expression, several common AS genes are known to function in metabolic pathways (e.g. aldoa, pfkfb4, phkb and phkg1), or RNA binding and chaperoning (e.g. csde1). Thus, it is likely that changes in pre-mRNA splicing also contribute to plasticity of cellular processes known to play important roles in cold acclimation.
Conclusions
Our results reveal that there are substantial changes in mRNA splicing patterns in response to chronic cold temperatures in ectothermic vertebrates. The extent of these qualitative changes in gene expression is smaller than the extent of quantitative changes in transcript levels overall; however, differences in splicing patterns are observed for genes involved in many of the cellular processes that are thought to be key in cold-acclimation responses. Thus, it is likely that these changes in splicing play an important role underlying phenotypic plasticity in response to temperature at the cellular level. In addition, genes demonstrating qualitative changes in expression often also demonstrate quantitative changes in expression, and there are AS genes that are detected in all three species in our study. These observations suggest that there may be changes in splicing patterns for a set of genes that play central roles in cold-acclimation responses across ectotherms. Taken together, our results suggest that qualitative changes in gene expression, in addition to quantitative changes, are likely to play an important role underlying phenotypic plasticity as a result of environmental change.
Competing interests
The authors declare no competing or financial interests.
Author contributions
Conceptualization: T.M.H., P.M.S.; Methodology: T.M.H., P.M.S.; Formal analysis: T.M.H.; Investigation: T.M.H.; Data curation: T.M.H., P.M.S.; Writing - original draft: T.M.H., P.M.S.; Writing - review & editing: T.M.H., P.M.S.; Visualization: T.M.H.; Supervision: P.M.S.; Funding acquisition: P.M.S.
Funding
This work was supported by the Natural Sciences and Engineering Research Council of Canada (NSERC) [Discovery Grant to P.M.S.].
Data availability
RNA-seq reads utilized in the present study are available at the NCBI SRA [SRP091735 (https://trace.ncbi.nlm.nih.gov/Traces/sra/?study=SRP091735) and SRP135801 (https://trace.ncbi.nlm.nih.gov/Traces/sra/?study=SRP135801) for killifish and stickleback, respectively], and the EBI Array Express Archive [E-MTAB-1155 (https://www.ebi.ac.uk/arrayexpress/experiments/E-MTAB-[E-MTAB-1155/) for zebrafish]. The gene-wise and exon-wise read count files, GO annotation databases, and flattened GFF files for each species have been uploaded as parts of an EBI BioStudy [S-BSST218 (https://www.ebi.ac.uk/biostudies/studies/ S-BSST218)]. Our reformatted GTF file that allowed the creation of the flattened GFF file forF. heteroclitushas also been uploaded as a part of the BioStudy.
Supplementary information
Supplementary information available online at
http://jeb.biologists.org/lookup/doi/10.1242/jeb.193516.supplemental
References
Anders, S. and Huber, W.(2010). Differential expression analysis for sequence count data.Genome Biol.11, R106.
Anders, S., Reyes, A. and Huber, W.(2012). Detecting differential usage of exons from RNA-seq data.Genome Res.22, 4025.
Benjamini, Y. and Hochberg, Y.(1995). Controlling the false discovery rate: a practical and powerful approach to multiple testing.J. R. Stat. Soc. Series B.57, 289-300.
Bilyk, K. T. and Cheng, C.-H. C.(2014). RNA-seq analyses of cellular responses to elevated body temperature in the high Antarctic cryopelagic nototheniid fish
Pagothenia borchgrevinki.Mar. Genomics.18, 163-171.
Blencowe, B. J.(2017). The relationship between alternative splicing and proteomic complexity.Trends Biochem. Sci.42, 407-408.
Buckley, B. A., Gracey, A. Y. and Somero, G. N.(2006). The cellular response to heat stress in the gobyGillichthys mirabilis: a cDNA microarray and protein-level analysis.J. Exp. Biol.209, 2660-2677.
Buhariwalla, H. E. C., Osmond, E. M., Barnes, K. R., Cozzi, R. R. F., Robertson, G. N. and Marshall, W. S.(2012). Control of ion transport by mitochondrion-rich chloride cells of eurythermic teleost fish: cold shock vs. cold acclimation.Comp.
Biochem. Physiol. A.162, 234-244.
Calixto, C. P., Guo, W., James, A. B., Tzioutziou, N. A., Entizne, J. C., Panter, P. E., Knight, H., Nimmo, H., Zhang, R. and Brown, J. W.(2018). Rapid and dynamic alternative splicing impacts the Arabidopsis cold response transcriptome.Plant Cell30, 1424-1444.
Capovilla, G., Pajoro, A., Immink, R. G. and Schmid, M. (2015). Role of alternative pre-mRNA splicing in temperature signaling.Curr. Opin. Plant Biol.27, 97-103.
Castilho, P. C., Buckley, B. A., Somero, G. and Block, B. A.(2009). Heterologous hybridization to a complementary DNA microarray reveals the effect of thermal acclimation in the endothermic bluefin tuna (Thunnus orientalis).Mol. Ecol.18, 2092-2102.
Chou, M.-Y., Hsiao, C.-D., Chen, S.-C., Chen, I.-W., Liu, S.-T. and Hwang, P.-P.
(2008). Effects of hypothermia on gene expression in zebrafish gills: upregulation in differentiation and function of ionocytes as compensatory responses.J. Exp. Biol.211, 3077-3084.
Filichkin, S., Priest, H. D., Megraw, M. and Mockler, T. C.(2015). Alternative splicing in plants: directing traffic at the crossroads of adaptation and environmental stress.Curr. Opin. Plant Biol.24, 125-135.
Garcia, T. I., Shen, Y., Crawford, D., Oleksiak, M. F., Whitehead, A. and Walter, R. B.(2012). RNA-Seq reveals complex genetic response to Deepwater Horizon oil release inFundulus grandis.BMC Genomics.13, 474.
Garrett, S. C. and Rosenthal, J. J. C.(2012). RNA editing underlies temperature adaptation in K+channels from polar octopuses.Science335, 848-851.
Gasch, A. P., Spellman, P. T., Kao, C. M., Carmel-Harel, O., Eisen, M. B., Storz, G., Botstein, D. and Brown, P. O.(2000). Genomic expression programs in the response of yeast cells to environmental changes.Mol. Biol. Cell. 11, 4241-4257.
Gerber, A. P. and Keller, W.(2001). RNA editing by base deamination: more enzymes, more targets, new mysteries.Trends Biochem. Sci.26, 376-384.
Gleason, L. U. and Burton, R. S.(2015). RNA-seq reveals regional differences in transcriptome response to heat stress in the marine snailChlorostoma funebralis.
Mol. Ecol.24, 610-627.
Goldspink, G.(1995). Adaptation of fish to different environmental temperature by qualitative and quantitative changes in gene expression.J. Therm. Biol. 20, 167-174.
Gracey, A. Y., Fraser, E. J., Weizhong, L., Fang, Y., Taylor, R. R., Rogers, J., Brass, A. and Cossins, A. R.(2004). Coping with cold: an integrative, multitissue analysis of the transcriptome of a poikilothermic vertebrate.Proc. Natl. Acad. Sci. USA101, 16970-16975.
Guderley, H.(2004). Metabolic responses to low temperature in fish muscle.Biol. Rev.79, 409-427.
Gygi, S. P., Rochon, Y., Franza, B. R. and Aebersold, R.(1999). Correlation between protein and mRNA abundance in yeast.Mol. Cell Biol.19, 1720-1730.
Healy, T. M., Bryant, H. J. and Schulte, P. M.(2017). Mitochondrial genotype and phenotypic plasticity of gene expression in response to cold acclimation in killifish.
Mol. Ecol.26, 814-830.
Hochachka, P. W., Mommsen, T. P. and Walsh, P. J.(2001). Knowledge explosion in comparative physiology and biochemistry: its causes and its future.Comp. Biochem. Physiol. A.130, 1-2.
Hopkins, D., Envall, T., Poikela, N., Pentikäinen, O. T. and Kankare, M.(2018). Effects of cold acclimation and dsRNA injections on Gs1l gene splicing in
Drosophila montana.Sci. Rep.8, 7577.
Horn, G., Hofweber, R., Kremer, W. and Kalbitzer, H. R.(2007). Structure and function of bacterial cold shock proteins.Cell. Mol. Life Sci.64, 1457.
Hu, Y.-C., Kang, C.-K., Tang, C.-H. and Lee, T.-H.(2015). Transcriptomic analysis of metabolic pathways in milkfish that respond to salinity and temperature changes.PLoS ONE10, e0134959.
Huang, B., Zhang, L., Tang, X., Zhang, G. and Li, L.(2016). Genome-wide analysis of alternative splicing provides insights into stress adaptation of the Pacific oyster.Mar. Biotechnol.18, 598-609.
Iida, K., Seki, M., Sakurai, T., Satou, M., Akiyama, K., Toyoda, T., Konagaya, A. and Shinozaki, K.(2004). Genome-wide analysis of alternative pre-mRNA splicing inArabidopsis thalianabased on full-length cDNA sequences.Nucleic Acids Res.32, 5096-5103.
Ikeda, D., Koyama, H., Mizusawa, N., Kan-no, N., Tan, E., Asakawa, S. and Watabe, S.(2017). Global gene expression analysis of the muscle tissues of medaka acclimated to low and high environmental temperatures.Comp. Biochem.
Physiol. D.24, 19-28.