Abstract—Macro cells are used more and more in current designs as they provide the benefit of reusability directly resulting in a decrease of design time and cost. However, there lies a gap in the EDA industry for macro-cell placement tools. This chapter looks at the implementation of a force-directed macro-cell placement tool that is been developed to target the gap in industry.
Index Terms—Design Automation, Macro cell, placement, force directed algorithm, EDA, VLSI
I. INTRODUCTION
The past few years have seen an exponential rise in the growth rate of the semiconductor industry. The increase in usage and demand of electronic devices among consumers has resulted in the need to provide better and faster design methods. The designers are pushed to their limits in meeting these demands whilst juggling the constraints of power and performance of ever shrinking circuits. To help designers meet their targets, EDA (Electronic Design Automation) tools are used to help fully or partially automate the design processes. One of such important backend processes is the placement component.
The placement problem simply is the problem of finding the ideal locations for each cell in a circuit achieving as many or all of the placement objectives. The two main objectives that every placement tool has to achieve for today’s fixed die design are,
• overlap free layout
• fit in the given placement area.
Other objectives may include minimization of wirelength, area, congestion, run time etc. The optimal solution will be one that satisfies all of the given criteria. Achieving such a placement solution is far from possible and even the simplest of cell placement problems are defined to be NP- hard. The consequence of falling short of a good placement could result in an unroutable design, a slower and/or larger chip etc. This will cost time and money to either manually correct the placement or start the design from the beginning.
In the past, designs mainly carried standard cells that were of uniform height and width. Macro cells were introduced as
Manuscript received March 23, 2009. This work was supported in together by the Department of Engineering and Technology, Manchester Metropolitan University and the Overseas Research Student Awards Scheme. All three authors are from the Department of Engineering and Technology, Manchester Metropolitan University, Chester Street, Manchester M1 5GD UK.
Meththa Samaranayake is a research student within the department (e-mail:[email protected]).
Helen Ji is the research project supervisor (e-mail: [email protected]). John Ainscough (e-mail: [email protected]).
an answer to the growing complexity of circuits. Macros can mainly be seen as black boxes that are designed to carry out specific tasks such as implementation of a logic function (e.g. an IP block). It can also be on-chip memories that are common in SoC (System on Chip) designs. Increased use of Macro cells help designer’s reuse of their designs which in turn helps reduce design time and cost.
This paper follows up work[1] carried out in the possibility of using graph-drawing algorithms as the basis of a Macro-cell placement tool. The implementation of two force directed algorithms, one authored by Kamada and Kawai[2] and the other by Fruchterman and Reingold[3] are the main focus of this work (these will be referred to as KK and FR respectively within the rest of the chapter). They were chosen mainly for their ability to handle undirected straight line drawing graphs, their simplicity in implementation, their speed as well as the criteria they follow to produce aesthetically pleasing graphs. In many cases, these criteria are shared by good placements.
The rest of this paper is organized as below. Section II will look at the different mixed size and macro-cell placement tools. Section III discusses the issues that need to be given consideration when developing a macro-cell placement tool. The graph drawing algorithms, KK and FR are discussed in Section IV whilst Section V discusses the implementation details of the algorithms. The experiments conducted on the algorithms and their performance results are given in section VI before concluding in Section VII.
II. PLACEMENT TOOLS
There are many standard cell placement tools available both academically and commercially. Several of them are capable of mixed-mode cell placement i.e. designs that contain both standard cells and macro cells, but there are only a few placement tools specifically for macro cells. This is in fact because standard cells govern most of the circuit designs. Recent changes have seen designs to contain macro-cell based designs such as memory blocks and IP blocks (Intellectual Property) and furthermore, the hierarchical design methodology intended to tackle design complexity has resulted in macro-dominated designs at the top level. Even though mixed mode placement tools can handle macro cells, for designs that contain a majority of macro cells these tools may not place the cells in the best interest of the macro cells.
Some leading edge mixed-mode placement tools identified are Capo [4], Dragon [5], FastPlace[6] and APlace[7]. The Capo tool is based on a combination of simulated annealing and recursive bisection techniques and handles modules mainly by the help of the floorplanner Parquet[8]. Capo placement tool has a secondary method of placing modules
A Force Directed Macro Cell Placement Tool
where it shreds them to smaller sub-cells. These sub cells are connected by two pin nets ensuring that they are placed close to one another. The circuit is then considered as a standard cell placement problem. FastPlace and APlace tools are based on analytical techniques and incorporates macro-cell placement in to its normal placement flow. In FastPlace, the macro-cells are given priority during legalization stage where overlaps are resolved between macros before standard cells. Dragon is a hybrid placement tool that combines the use of simulated annealing with min-cut partitioning. To handle macro-cells, it has modified the min-cut partitioning algorithm so that the partitions can be of different sizes. All these placement tools were designed for standard cells and later modified to support macro-cells. As a result, they do not consider macro-cell pin locations and cell-orientation, which are important factors for placing macros.
A Java based macro-cell placer[9] based on a force directed placement algorithm has been identified to be different from traditional force directed algorithms. In this work, the cell shapes and sizes have been considered when developing the force equation. A limitation of this tool is that it does not handle placement on a fixed placement area and instead treats the chip as a soft cell with a variable size and aspect ratio. The pads of the chip are also not fixed; therefore the positions are found with the use of the force directed algorithm at a later stage.
A macro-cell placement method based on net clustering and force directed method is proposed in literature [10]. This approach is unique such that, it treats the nets as the placement components. In the graphs they draw, the nodes represent the nets whilst an edge only exists for the nets that share one or more cells. The forces on the nets determine the initial locations for the cells. Pin locations are determined last, suggesting that this placement tool is mainly focused on soft cell macros. This work reiterates the importance of the pin locations and cell orientation in macro cell placement. Another limitation seen is that the tool only handles connected graphs, again limiting the type of designs that can be processed.
Looking at both macro-cell placers identified above, a common disadvantage recognized is that both tools are not standardized – inputs are not of industry recognized LEF/DEF format but formats limited to the tool. This has limited the tools from reading in standard designs currently available, therefore disabling measuring their quality of placement. The same is true for outputs where they are not given out in any standard format so that the placement can be processed by a routing tool.
III. STANDARD CELLS VS.MACRO-CELLS
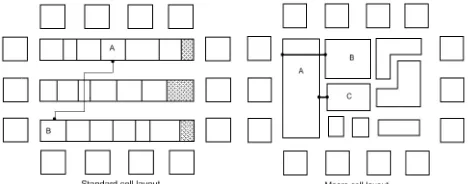
Macro-cell placement is not as straightforward as standard cell placement. In standard cell placement, the cells are of uniform height and are restricted to rows in which they must sit in. These restrictions allow the placement tools to be more precise in choosing locations for the standard cells and to allocate routing resources. Macro cells on the other hand do not have such restrictions. They can be of any height, width and shape (L, T and U shapes though the most common is
rectangular) and are not restricted to a specific location of the placement area. This is further illustrated in Figure 1. As a result, choosing a good placement for macro-cells can be much harder as the permutations of locations they can be placed-at are unbounded. Similarly, the different shapes of the cells can bring in unwanted limitations on finding placements. This can bring negative results such as more expensive computations and longer runtimes.
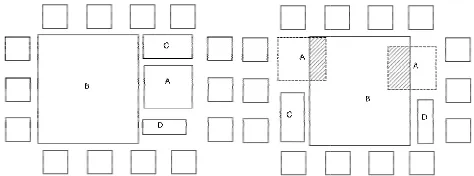
As the size of a macro-cell can be a considerable amount of the total area, sometimes even up to half of the placement area, this can have a significant impact on the placement of cells. This is further illustrated in Figure 2 where it is seen how the size and placement of cell A has made in impact on cell B. In Figure 2 (b) where cell A is placed in the center of the placement area, it has become impossible to find a legal placement for cell B whilst cell C and D have achieved positions after being rotated. Therefore, it is necessary to give due consideration to the magnitude of cells and the impact they can have on other cells.
[image:2.595.309.543.634.726.2]As well as cell position, cell size has a significant impact on the position of pins. Unlike in standard cell placement, pin locations can have a significant impact on wirelength, routability and congestion of the chip as further illustrated in Figure 1. To overcome this, the placement tool will need to handle extra features such as cell mirroring and cell rotation to consider the best possible cell orientation in order to minimize the above-mentioned costs and to place the pins in the best locations possible.
Fixed cells are also an important factor that needs to be looked at during cell placement. There are times when one or more components of the design need to be placed in a fixed position within the placement area. For macro-cells, these fixed cells will create a blockage on the area on which cells are to be placed and will need to be given due consideration during the placement process.
It is seen that there are important differences between standard cell designs and macro-cell designs and these differences need to be given appropriate priority during placement. It further reaffirms the need for macro-cell placement tools that are separate from standard cell placement tools. Not doing so will result in poor placements and increased design costs in terms of wirelength, congestion and routing resources etc. that is detrimental for both designers and manufacturers alike.
IV. FORCE DIRECTED GRAPH DRAWING
Graph drawing algorithms are mainly concerned about nodes lacking any size or shape, whereas for cell placement cell sizes need to be given due consideration. A recent published work introduces methods of suc
modifying graph-drawing algorithms to incorporate dimensions to nodes[11]. This work is mainly aimed towards general graph drawing algorithms and the criteria they use for graph drawing include,
• Vertices are not to overlap • Edges are not to cross vertices
For this work, the first criterion directly applies, as the objective of the placement tool is to produce a non-overlapping placement. The second criterion also applies as it tends to place directly connected cells
could be too conservative if routing is allowed to be over-the-cell. One of the limitations of this work
the node orientation is fixed and cannot be mirrored or rotated.
Force directed graph-drawing algorithms generally tend to be analogous to the classic problem of Hookes law for a spring system. Most of the current force directed algorithms follow the footsteps of Eades’ spring embedded algorithm [12]. Hooke’s law simply stated that the force exerted by an extended spring is proportional to the length of the spring. Eades modeled the graph as a system of rings in place of the nodes and springs for edges. His formula for the forces exerted by the springs differed Hooke’s law by the former taking both attraction and repulsion forces in to consideration. The aim of all the force directed algorithms is to find zero-force locations for all nodes
equilibrium for that system.
A comparison[13] of several force-directed algorithms has been carried out where KK and FR algorithms were the two main contenders. It was identified that KK is successful in achieving high computation speed, minimizing the computation time. Even though FR is quick in giving aesthetically pleasing layouts, it is said to suffer from long run times when the number of nodes/edges exceeds 60. One cannot declare a certain algorithm to be the best where each has its pros and cons and how relevant each algorithm is depends on the application[13].
[image:3.595.50.287.60.148.2]KK Algorithm[2] is concerned about general undirected, connected graphs. It has the ability to handle weighted graphs such that edges with higher weighting are longer than those with a lower weighting. One advantage in this algorithm is
Figure 2 Affect of cell size on placement (a) with largest cell placed in the boundary (b) largest cell placed in the centre
RAWING ALGORITHMS Graph drawing algorithms are mainly concerned about nodes lacking any size or shape, whereas for cell placement cell sizes need to be given due consideration. A recent published work introduces methods of successfully drawing algorithms to incorporate . This work is mainly aimed towards general graph drawing algorithms and the criteria they use for
Edges are not to cross vertices
For this work, the first criterion directly applies, as the objective of the placement tool is to produce a overlapping placement. The second criterion also applies as it tends to place directly connected cells together, but it could be too conservative if routing is allowed to be cell. One of the limitations of this work[11] is that the node orientation is fixed and cannot be mirrored or
algorithms generally tend to be analogous to the classic problem of Hookes law for a spring system. Most of the current force directed algorithms of Eades’ spring embedded algorithm . Hooke’s law simply stated that the force exerted by an extended spring is proportional to the length of the spring. Eades modeled the graph as a system of rings in place of the d springs for edges. His formula for the forces exerted by the springs differed Hooke’s law by the former taking both attraction and repulsion forces in to The aim of all the force directed algorithms is nodes – i.e. state of
directed algorithms has been carried out where KK and FR algorithms were the two main contenders. It was identified that KK is successful in ieving high computation speed, minimizing the computation time. Even though FR is quick in giving aesthetically pleasing layouts, it is said to suffer from long run times when the number of nodes/edges exceeds 60. One be the best where each has its pros and cons and how relevant each algorithm is
is concerned about general undirected, connected graphs. It has the ability to handle weighted graphs such that edges with higher weighting are longer than those with a lower weighting. One advantage in this algorithm is
that it introduces a “graph theoretic distance”
minimum edge length in order to minimize node overlaps. The main objective of the algorithm is to find a balanced formulation of the spring forces within the system.
drawing criteria followed by KK • reduce number of edge crossings
• distribute the vertices and edges uniformly Comparing these criteria with those of the macro placement tool, it can be seen
‘good placement criteria’. Reducing number of edge crossings results in directly connected cells being placed close to each other. The second criterion allows the nodes to be evenly distributed within the placement area as wel show any symmetry within the layout. This not only is an advantage for graph drawing where the aesthetics are improved, but for cell placement, by illustrating the cell connections in an uncomplicated manner. It is worth
out that symmetry is a very important heuristic for placement. While most of placement tools have difficulty in incorporating it into their algorithms, the KK algorithm handles it neatly.
The main objectives of the FR algorithm are to achieve a visually pleasing graph with increased speed and simplicity. Following Eades work, the FR algorithm also makes use of both attraction and repulsion forces, but takes it one further by defining that the attraction forces only calculated for neighboring nodes whilst repulsion f calculated for all nodes within the graph.
Looking at the criteria followed by FR
graphs, it is seen that two main points are considered. • vertices connected by an edge should be drawn near
each other
• vertices should not be drawn too close to each other. The first criteria does apply for the cell placement tool as the cells connected to one another will need to be close to each other in order to minimize wirelength. This can be further enhanced by edge weights to ensure that cells connected to edges with higher weights are as close as possible. Unfortunately, the current implementation of the FR algorithm does not contain support for edge weights. The second criterion is set quite vaguely and according to literature [3] it depends on the number of nodes and the placement area. Literally, this should mean that the nodes do not overlap each other, which is directly applicable to the objectives of the placement tool.
FR algorithm uses a method similar to simulated annealing to control the ‘cooling schedule’ of the
controls the number of sweeps it goes through in optimizing the layouts. This can be both advantageous and disadvantageous. It is advantageous such that it helps limit the displacement prohibiting the algorithm to be trapped in local minima. It is disadvantageous such that the number of sweeps is kept at a constant so
check on the quality of placement before ending the sequence.
Affect of cell size on placement (a) with largest cell placed in the
“graph theoretic distance”which defines a minimum edge length in order to minimize node overlaps. The main objective of the algorithm is to find a balanced spring forces within the system. The graph
KK[2] are, reduce number of edge crossings
distribute the vertices and edges uniformly
Comparing these criteria with those of the macro-cell n that both are related to the ‘good placement criteria’. Reducing number of edge crossings results in directly connected cells being placed close to each other. The second criterion allows the nodes to be evenly distributed within the placement area as well as show any symmetry within the layout. This not only is an advantage for graph drawing where the aesthetics are improved, but for cell placement, by illustrating the cell connections in an uncomplicated manner. It is worth pointing a very important heuristic for placement. While most of placement tools have difficulty in incorporating it into their algorithms, the KK algorithm
The main objectives of the FR algorithm are to achieve a creased speed and simplicity. Following Eades work, the FR algorithm also makes use of both attraction and repulsion forces, but takes it one-step further by defining that the attraction forces only to be calculated for neighboring nodes whilst repulsion forces are calculated for all nodes within the graph.
Looking at the criteria followed by FR[3] when drawing graphs, it is seen that two main points are considered.
ertices connected by an edge should be drawn near ertices should not be drawn too close to each other. The first criteria does apply for the cell placement tool as the cells connected to one another will need to be close to each other in order to minimize wirelength. This can be further enhanced by edge weights to ensure that cells igher weights are as close as possible. Unfortunately, the current implementation of the FR algorithm does not contain support for edge weights. The set quite vaguely and according to it depends on the number of nodes and the placement area. Literally, this should mean that the nodes do her, which is directly applicable to the objectives of the placement tool.
The main difference between the FR and KK algorithm is that the FR algorithm can handle disconnected graphs. Even though this is not an absolute requirement compared to the objectives of the placement tool, it does give an advantage as to the type of designs the algorithm will be able to handle. Authors of KK[2] points out that even though KK algorithm does not support disconnected graphs, it can be easily extended to do so without a significant delay in time as follows.
“Partition the graph to its connected components giving each component a region of area proportional to its size, with each component laid out independently.”
FR algorithm puts this theory into practice in its technique in handling disconnected graphs. Authors of FR names this technique as the “grid variant option” where the placement area is divided into a grid and nodes are given locations within the grid. Changes are made to the calculation of the repulsion forces; for each node, the repulsion forces are calculated from the nodes within the current grid as well as those in neighboring grids, unlike the basic algorithm which calculated repulsion forces for all nodes within the graph.
Another difference between the two algorithms is that KK does not specify a clear placement area for the graph whereas FR implements support for a customizable placement area. Whilst for graph drawing this may not be very important, it does carry greater significance in cell placement where the cells are expected to be placed within the given placement area in order for the placement to be legal. It is believed that limitation on placing components within the placement area can be imposed upon in later stages when being used in the placement tool.
V. IMPLEMENTATION DETAILS
Initial work carried out [1] has proved that both KK and FR are good candidates as a basis for a macro-cell placement tool. The basic algorithms of both KK and FR were while sufficient as graph drawing algorithms, lacked the necessary functionalities to be used as a module placement algorithm. Both algorithms were modified in-order to implement the following features. The basic implementation of the two algorithms were taken from the peer reviewed Boost [14] library.
A. Non-zero size vertices implementation
Traditional force directed algorithms tend to treat the cells as points that do not posses any size or shape. The edges do not connect to any pins but to the nodes that represent the cells. This method may be acceptable for standard cell design [9] but in Macro cell placement it can cause inaccuracies of positions, wirelength, area, congestion etc. due to the cell dimensions. Recent literature [11, 15, 16] has been found to carry out work regarding the implementation of different size nodes for graph drawing.
As was mentioned in [1] the simplest method of representing a cell is to consider the node to be circular. In order to implement this on to KK and FR algorithms, the following method suggested in literature [11] was used. All the modules are assumed rectangular shaped and the width and height of each cell is used to calculate the radius of the
circular vertex that will represent the module. This calculation is given in Eq. (1) where f(v) is the radius of the vertex and r and R are the width and height of the module respectively[11].
−
+ +
−
+ =
R r R r
R
r R r R
r
arctan sin 1
arctan sin 1 ln . arctan sin 1
arctan sin 1 ln . 2
1 f(v)
π
(1)In order to minimize vertex overlaps, in FR it was possible to use the vertex size to check if the vertices were overlapping and therefore adjust the force applied to the vertices. Overlapping can be easily tested by the condition; if the distance between two cells (centre-to-centre) is less than the summation of their radii, the two cells can be said to be overlapping. Unfortunately, KK does not clearly distinguish the attraction and repulsive forces; instead, it calculates an overall force acting on each cell. Therefore, it was not possible to implement an overlap minimizing method for KK.
B. Fixed node support
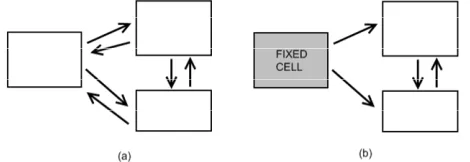
[image:4.595.307.552.105.161.2]Another feature that was lacking within the graph drawing algorithms was support to handle fixed nodes. This is especially useful when designers may specify locations for some of the cells to be fixed or for the placement of the IO (Input Output) pads, which communicate with the external world. In force directed algorithms, since there are attraction and repulsion forces that affects all cells, it was needed to ensure that the forces emitted by the fixed cells were still being taken into account whilst the forces felt upon the fixed cells do not cause the fixed cell to displace as is illustrated in Figure 3.
The algorithm of FR was altered so that the fixed nodes are treated equally as movable cells during force calculation. During displacement calculations, fixed nodes are ignored and for added measure ignored during positional updating of the cells as well. This has shown to be a more accurate method of force calculation for the algorithm when containing fixed cells.
The KK algorithm was modified to filter out the fixed nodes during the energy minimization calculations. This was accomplished in a manner that, whilst minimizing the energy function for the movable cells, the affect made from fixed nodes are still felt. Again, this has been proven successful in implementation.
[image:4.595.311.546.645.726.2]C. Input/output format
Not all placement tools follow a single format for input and output. This hinders benchmarking and comparison of placement tools. It is with this in mind that it was thought best to use the industry standard formats; the Cadence LEF/DEF file format. The LEF/DEF format is written in ASCII format and can be easily understood. The DEF file contains all the information relevant to the design, constraints, layout and netlist information whilst the LEF file contains the library information of all the cells and modules within the design as well as information regarding layers, vias and core area information. In order to read in the necessary information for the placement tool, a parser was developed. The parser reads data in from the two files, extracts the necessary data and saves it in to a text file, which can then be read in by the placement algorithms. It is hoped that in the future, this will be integrated within the placement algorithm itself so that the data input will be a one-step process.
Once the algorithms have generated a placement, it will output the summary in text format and a plot the placement in order to inspect the results achieved. In future, it is hoped to output the data into a DEF file such that the final placements then can be routed which is another important quality of measurement of the placement.
VI. EXPERIMENTATION AND RESULTS
With the implementation of different features to the algorithms, they were simulated under different conditions to identify their strengths and weaknesses. To start, the two algorithms were subjected to a selection of graphs, some with known golden topologies. Cells of different dimensions were used to observe the impact the changes described in this chapter. The simulations were run on an Intel Pentium IV PC running at 3.2GHz and with 2 GB of RAM.
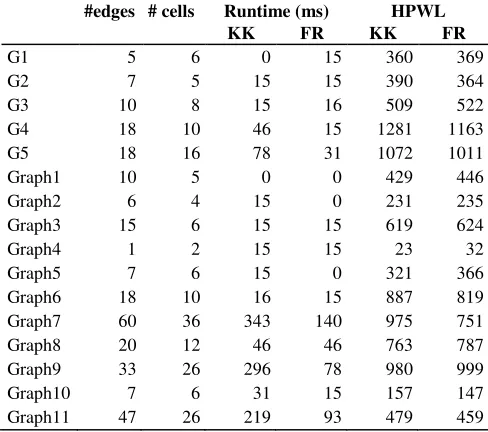
Table 1 compares the results obtained through this exercise. The runtime and HPWL (Half-perimeter wirelength) are the cost factors looked at during the experimentation to evaluate the performance of the
algorithms. The results shown for the FR are those obtained for the grid option, which allows the use of disconnected graphs. Another important change made to FR was to set the optimal distance between the cells to be as small as possible. In KK the ideal edge length values was defined as zero to ensure shortest possible wirelengths.
Both algorithms were successful in achieving visually pleasing layouts within the first iteration for all the below mentioned designs. Looking at the results in Table 1 it is seen that for majority of the graphs, the runtimes and wirelength values achieved are similar to one another between the two algorithms.
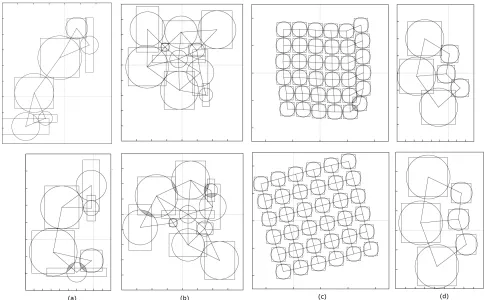
For the more dense graphs, it was seen that KK would take longer runtimes than FR, which is especially true for graph7, graph9 and graph11. Looking at the runtime and wirelength results alone does not allow us to compare the results in full. Therefore, to have a better understanding of the quality of the layouts it is also needed to compare the placements visually. A selection of the placement results have been presented in Figure 4 for this purpose.
As was expected [1], the use of circles to represent the cells does not take the long rectangles into sufficient consideration resulting in overlaps between the rectangles. It is believed that this can be overcome by representing the nodes as ellipses and not circles, which will have a better relationship of the rectangular shape. However, what was not expected were overlaps between the circles themselves which is shown by the grayed areas in Figure 4. In FR, even though there are sufficient repulsive forces to keep the circles apart, due to the number of sweeps being a constant figure, some overlaps or less-than-ideal cell locations may get bypassed. In KK, no obvious repulsion force exists to ensure that the cells are kept apart. The minimum edge length value acting on its own in the calculation of the energy minimization equations has found to be insufficient in eliminating overlaps within designs.
One of the objectives of the KK algorithm is to achieve uniform edge lengths. With the introduction of cell dimensions, it was seen that the edge lengths varied according to the forces acting upon the vertices. This is clearly seen in Figure 4. For designs with similar size cells in Figure 4(c), KK achieves equal edge length values and retains the symmetry of the design. For varied cell sizes, it is sometimes seen that smaller size cells are engulfed by the larger cells due to the increased attraction force. This is believed by be the main reason why there are less overlaps in the placements achieved by FR than those of KK. It is believed the introduction of a separate repulsion force will balance the forces in a much more efficient manner.
[image:5.595.47.291.70.286.2]Overall, both algorithms have achieved good results with the implementation of cell sizes. They both have been able to retain the underlying topologies of the designs successfully which generating placements within a short amount of time. In future, larger graphs (increased number of nodes and edges) will be experimented upon to identify the limitations of the tools.
Table 1 Comparison of runtime (ms) and wirelength (unit length) results for KK and FR
#edges # cells Runtime (ms) HPWL
KK FR KK FR
G1 5 6 0 15 360 369
G2 7 5 15 15 390 364
G3 10 8 15 16 509 522
G4 18 10 46 15 1281 1163
G5 18 16 78 31 1072 1011
Graph1 10 5 0 0 429 446
Graph2 6 4 15 0 231 235
Graph3 15 6 15 15 619 624
Graph4 1 2 15 15 23 32
Graph5 7 6 15 0 321 366
Graph6 18 10 16 15 887 819
Graph7 60 36 343 140 975 751
Graph8 20 12 46 46 763 787
Graph9 33 26 296 78 980 999
Graph10 7 6 31 15 157 147
VII. FUTURE WORK AND CONCLUSION
In this work, a method of using graph-drawing algorithms as a building block for a macro cell placement has been proposed. Future work will focus on optimizing those added features, especially in handling different sized cells by exploring the possibility of representing the nodes with ellipses rather than circles. This should eliminate any remaining overlaps and help generate more accurate attraction/repulsion forces within the graph algorithms. Other work will include establishing techniques to use pin locations to optimize wirelength by means of rotating and/or mirroring of cells. The experiments carried out so far have given positive results in achieving good layouts even with the presence of cell dimensions.
REFERENCES
[1] Samaranayake, M., Ji, H., and Ainscough, J.: 'Force directed graph drawing algorithms for Macro cell placement'. World Congress on Engineering, London, UK, 2-4 July, 2008, pp. 222-227.
[2] Kamada, T. and Kawai, S., "An algorithm for drawing general undirected graphs," Information Processing Letters, vol. 31, p. 15, 1989.
[3] Fruchterman, T. M. J. and Reingold, E. M., "Graph Drawing by Force-directed Placement," Software- Practice and Experience, vol. 21, pp. 1129-1164, November 1991.
[4] Adya, S. N., Chaturvedi, S., Roy, J. A., Papa, D. A., and Markov, I. L.: 'Unification of partitioning, placement and floorplanning'. Int. Conf. of Computer Aided Design, November 2004, pp. 550-557.
[5] Taghavi, T., Yang, X., Choi, B. K., Wang, M., and Sarrafzadeh, M.: 'Dragon2005: Large Scale Mixed-Sized Placement Tool'. Int. Symp. on
Physical Design, April, 2005, pp. 245-247.
[6] Viswanathan, N., Pan, M., and Chu, C.: 'FastPlace 3.0: A Fast Multilevel Quadratic Placement Algorithm with Placement Congestion Control'. Asia and South Pacific Design Automation Conf, 23-26 Jan 2007, pp. 135-140.
[7] Kahng, A. B., Reda, S., and Wang, Q.: 'APlace: A General Analytic Placement Framework'. Int. Sym. of Physical Design, California, USA, April 2005, pp. 233-235.
[8] Adya, S. N. and Markov, I. L., "Fixed-outline floorplanning: enabling hierarchical design," IEEE Trans. on Very Large Scale Integration
(VLSI) Systems, , vol. 11, pp. 1120-1135, December 2003.
[9] Mo, F., Tabbara, A., and Brayton, R. K.: 'A Force-Directed Macro-Cell Placer'. Int. Conf. on Computer-aided design, San Jose, USA, November 2000, pp. 177-180.
[10] Alupoaei, S. and Katkoori, S., "Net-based force-directed macrocell placement for wirelength optimization," IEEE Trans. on Very Large
Scale Integration (VLSI) Systems, vol. 10, pp. 824-835, December
2002.
[11] Harel, D. and Koren, Y.: 'Drawing graphs with non-uniform vertices'. Proc. of Working Conference on Advanced Visual Interfaces, pp. 157–166.
[12] Eades, P.: 'A heuristic for graph drawing'. Congressus Numerantium, pp. 149-160.
[13] Brandenburg, F. J., Himsholt, M., and Rohrer, C.: 'An Experimental Comparison of Force-Directed and Randomized Graph Drawing Algorithms'. Symposium on Graph Drawing, 20 - 22 September 1995, pp. 76 - 87
[14] Boost, http://www.boost.org/, accessed Sep 2007
[15] Wang, X. and Miyamoto, I., "Generating customized layouts," in Graph Drawing. vol. 1027, F. J. Brandenburg, Ed.: Springer Berlin, 1996, pp. 504-515.
[16] Gansner, E. and North, S., "Improved Force-Directed Layouts," in Graph Drawing. vol. 1547, S. H. Whitesides, Ed.: Springer Berlin, 1998, pp. 364-373.
[image:6.595.56.541.400.700.2]