Effect of Temperature Ranges of Alternating Current Imposition
on Modification of Primary Mg
2Si Crystals in Hypereutectic Mg-Si Alloy
Jun Du
1;2;*and Kazuhiko Iwai
11
Department of Materials, Physics and Energy Engineering, Graduate School of Engineering, Nagoya University, Nagoya 464-8603, Japan
2School of Materials Science and Engineering, South China University of Technology, Guangzhou 510640, P.R. China
An alternating current (AC) of 60 A with a frequency of 1 kHz was imposed on the hypereutectic Mg-4.8 mass% Si melt during solidification in order to modify the primary Mg2Si crystals. The liquidus and eutectic temperatures of the Mg-4.8 mass% Si alloy are 761C and 638C, respectively. In order to investigate the effect of temperature ranges with application of AC on the modification of the primary Mg
2Si crystals, six temperature ranges from 770C to 740, 700 and 630C, and from 700C to 680, 650 and 630C were adopted. The temperature ranges examined had an obvious influence on the modification of the primary Mg2Si crystals. For a starting temperature of 770C, the average size of the primary Mg2Si crystals could be significantly reduced with further decrease in the ending temperature to 700 and 630C, with agglomeration of the refined primary Mg2Si crystals in these two samples was observed. For a starting temperature of 700C, the average sizes of the primary Mg2Si crystals could also be reduced, although no obvious agglomeration of the refined primary Mg2Si crystals was observed. The sample treated in the temperature range between 700 and 630C had primary Mg
2Si crystals with the lowest average size and the highest uniformity of size. [doi:10.2320/matertrans.MRA2008366]
(Received October 7, 2008; Accepted January 6, 2009; Published February 25, 2009)
Keywords: magnesium silicon alloys, primary Mg2Si crystals, alternating current imposition, modification
1. Introduction
Magnesium alloys, the lightest structural metal materials, have been given much attention for applications in the automobile industry during the past two decades, in order to
reduce fuel consumption and lower exhaust gas emissions.1,2)
Among the broad range of magnesium alloys, those
contain-ing Mg2Si particles have excellent creep resistance and have
been extensively studied,2–4)because Mg
2Si exhibits a high
melting temperature, high hardness and high compression
strength.5)In particular, the hypereutectic Mg-Si alloys have
high potential as structural materials for elevated temperature
applications.2) However, the hypereutectic Mg-Si alloys
prepared by conventional ingot metallurgy processes have very low ductility and strength, due to the large primary
Mg2Si crystal size and the brittle eutectic phase.6)Therefore,
refinement of the primary Mg2Si crystals is very important to
achieve the desired mechanical properties of hypereutectic Mg-Si alloys.
For hypereutectic Mg-Si alloys prepared by ingot metal-lurgy processes, the microstructures were traditionally refined by the addition of refiners, such as the rare earth
element yttrium7) and the boron-containing compound
KBF4.8)However, the material compositions become
com-plex upon such additions, making recycling of the materials difficult. Compared with the addition of refiners, a route for microstructure refinement induced by electromagnetic vibra-tion (EMV) has an excellent advantage in that there is no change in the composition of the treated alloys. It has long been established that the EMV technique is a very effective route to refine the microstructures of various metals prepared
by ingot metallurgy processes.9–22)
Unfortunately, few studies have been performed on
modification of the primary and eutectic Mg2Si crystals in
primary Mg-Si alloys by EMV. In a preliminary study,23)we
showed that the Mg2Si crystals in a hypereutectic Mg-Si
alloy could be effectively refined by weak EMV induced by imposing an alternating current (AC) with a high frequency of 1 kHz. In the present study, AC was imposed on the hypereutectic Mg-Si melt over different temperature ranges to clarify the correlation between the temperature range during application of the AC and the effect on modification
of the primary Mg2Si crystals.
2. Experimental Procedure
The hypereutectic Mg-Si alloy used in the present study
was the same as that used in the previous study,23)in which
the silicon content was approximately 4.8 mass%, and the liquidus and eutectic temperatures were determined as 761
and 638C, respectively.
The samples treated by application of AC were prepared as follows. Approximately 25 g of the hypereutectic Mg-Si
alloy was melted at 800C in a mild steel crucible using an
electric resistance furnace under a protective flux cover
(45 mass% MgCl2, 35 mass% KCl, 5 mass% CaF2, 15 mass%
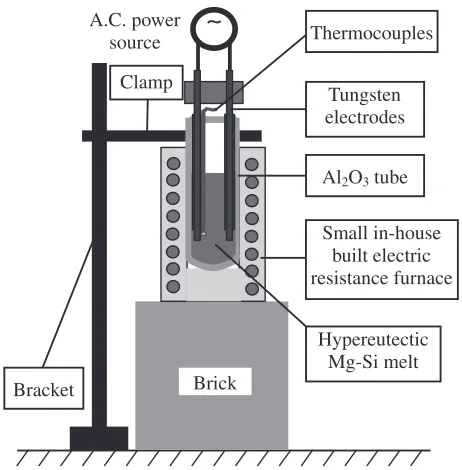
NaCl). The melt was poured into an Al2O3tube (21 mm inner
diameter, 25 mm outer diameter, 70 mm length) that was
preheated to 700C using a small in-house built electric
resistance furnace. The Al2O3 tube was held with a clamp
fixed on a bracket, as shown in Fig. 1.
After the melt was poured into the Al2O3tube, a couple of
tungsten electrodes (3 mm diameter) were quickly inserted into the melt. The distance between the two tungsten electrodes was 12 mm. The tungsten electrodes were covered
with an Al2O3 tube (3 mm inner diameter, 5 mm outer
diameter, 60 mm length). The end of tungsten electrodes with a length of 5 mm was not covered, so as to apply AC into the melt. The distance between the end of the tungsten
electrodes and the bottom of the Al2O3 tube was 10 mm. A
*Corresponding author, E-mail: [email protected]
K-type thermocouple was fixed to one of the two tungsten electrodes and the temperature of the melt was recorded using a digital recorder (Keyence, GR-3500).
The small in-house built electric resistance furnace was turned off after the temperature of the melt was decreased to
approximately 770C. A brick (as shown in Fig. 1) was then
moved away and the small furnace was removed. The
hypereutectic Mg-Si melt contained in the Al2O3 pipe was
then air-cooled, with application of AC at 60 A with a frequency of 1 kHz over the different temperature ranges. Six temperature ranges (process Nos. 2 to 7, Table 1) were examined to investigate the correlation between the duration
of AC and the effect of modification on the primary Mg2Si
crystals. For Nos. 2 to 4, the starting temperature of AC
application was fixed to 770C with ending temperatures of
740, 700, and 630C, respectively, and for Nos. 5 to 7, the
starting temperature was fixed to 700C with ending
[image:2.595.45.549.95.234.2]temper-atures of 680, 650, and 630C, respectively. Process No. 1 in
Table 1 indicates the sample prepared without AC treatment. After solidification, the cylindrical ingots were cut longitudinally along the middle plane parallel to the
electrodes. They were then cut at the horizontal plane 20 mm from the bottom of the ingots. Samples for micro-structural observations were prepared by a standard
proce-dure with final polishing using a 0.05mmalumina suspension.
The samples were then etched with 3 vol% HF solution for 1 min. The etched samples were observed using a scanning electron microscope (SEM; Keyence, VE-7800) under differ-ent magnifications. The middle area between the two tungsten electrodes was selected for SEM observations, as shown in Fig. 2. The size of the observed area was
1515mm2.
To evaluate the effect of AC, the sizes of the primary
Mg2Si crystals for all samples were measured from SEM
images with40magnification, using the longest length of
the primary trunk of the dendritic Mg2Si crystals. All Mg2Si
crystals present in one SEM image area were measured.
Mg2Si crystals from other SEM images were also measured
until 200 primary Mg2Si crystals were obtained for every
sample, and the 200 data sizes were then analyzed using statistical methods. The average values and standard
devia-tions obtained for the 200 primary Mg2Si crystals of each
sample were then used to evaluate the effect of AC on the
primary Mg2Si crystal in the hypereutectic Mg-Si alloy.
3. Results
3.1 SEM observations of primary Mg2Si crystals
To clearly understand the distributions of refined primary
A.C. power source
Hypereutectic Mg-Si melt
∼
Brick
Small in-house built electric resistance furnace Clamp
Al2O3 tube
Tungsten electrodes Thermocouples
Bracket
[image:2.595.333.519.108.417.2]Fig. 1 Schematic view of the experimental apparatus.
Table 1 Statistical results of the sizes of the primary Mg2Si crystals in the hypereutectic Mg-Si alloy treated by imposing the alternating current in the different temperature ranges.
Process No.
Temperature ranges of the alternative current imposition
Statistical average size of primary Mg2Si
crystals (mm)
Standard deviation (mm)
Total ratio of Mg2Si crystals with sizes over than 400mm
1 Without alternative
current treatment 403 241 40.0%
2 770C740C 322 153 24.0%
3 770C700C 237 92 6.0%
4 770C630C 202 96 4.0%
5 700C680C 220 89 4.5%
6 700C650C 199 79 2.5%
7 700C630C 196 68 0%
Tungsten electrode
10 20
Al
2O
3tube
Observed
area 15
×
15
Fig. 2 Observed area in the sample (unit: mm).
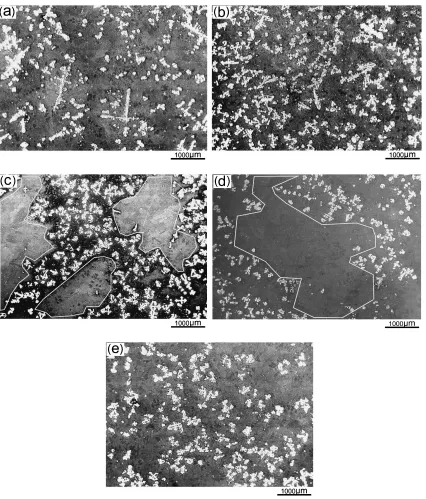
[image:2.595.336.513.254.413.2] [image:2.595.53.284.264.499.2]Mg2Si crystals, low magnification (20) SEM images of the
hypereutectic Mg-Si alloy treated through process Nos. 1, 2, 3, 4 and 7 were observed, and are shown in Fig. 3. Large
amounts of long and coarse dendritic primary Mg2Si crystals
were present in the sample without AC treatment, as shown in Fig. 3(a). The features of the long and coarse dendritic
primary Mg2Si crystals under high magnification are
dis-cussed later with regard to their formation mechanisms. The
primary Mg2Si crystals were refined by application of AC,
except for the No. 2 sample. For the No. 3 and 4 samples, it
was interesting that some large primary Mg2Si crystal-free
areas could be observed, as indicated by the white lines in the
Figs. 3(c) and 3(d). The refined Mg2Si crystals were
agglomerated locally in these two samples. However, for
the sample with a starting temperature of 700C, large
primary Mg2Si crystal-free areas were not observed and the
refined Mg2Si crystals had relatively uniform distribution, as
shown in Fig. 3(e).
To observe the features of the Mg2Si crystals more clearly,
a relatively high magnification SEM image of the sample without AC treatment was obtained, as shown in Fig. 4. Two
typical morphologies can be observed for the primary Mg2Si
crystals in this sample. One is a coarse dendritic morphology, such as the crystals denoted by A and B. The other is a polygonal morphology, such as the crystals denoted by C.
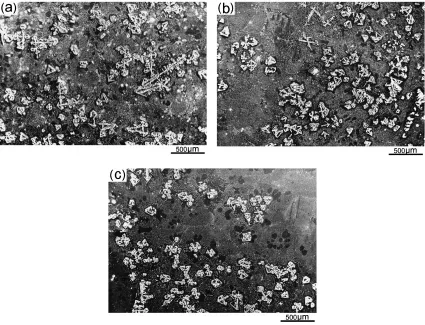
Figure 5 shows40SEM images of the hypereutectic
Mg-Si alloys treated through process Nos. 2 to 4. For the sample
treated through process No. 2, some coarse primary Mg2Si
[image:3.595.88.514.69.568.2]crystals with complex dendritic morphology were observed; however, they were not observed in the samples treated through process Nos. 3 and 4. Compared with the sample
without AC treatment, the primary Mg2Si crystals in samples
[image:4.595.59.280.72.236.2]No. 3 and 4 were significantly refined, were non-uniformly distributed and agglomerated.
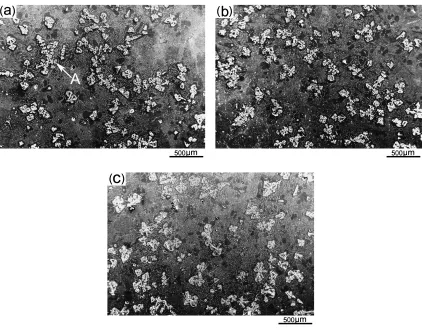
Figure 6 shows40SEM images of the hypereutectic
Mg-Si alloy treated through process Nos. 5 to 7. For these three
samples, the primary Mg2Si crystals were refined compared
with the sample without AC treatment (Fig. 4). Small
amounts of coarse primary Mg2Si crystals with complex
dendritic morphology were observed only in the sample
treated through process No. 5, such as the Mg2Si crystal
denoted by A in Fig. 6(a). Agglomerations of the refined
primary Mg2Si crystals were not observed in these three
samples.
3.2 Statistical analysis of the primary Mg2Si crystal sizes
Statistical histograms of the 200 data sets of primary
Mg2Si crystal sizes are shown in Figs. 7, 8 and 9 for all
samples, and the results for average size and standard deviation are listed in Table 1. The total ratios of the numbers
of coarse (>400mm) Mg2Si crystals to the 200 primary
Mg2Si crystals for all samples are also listed in Table 1.
Figure 7 shows the statistical histogram of the primary
Mg2Si crystals sizes in the hypereutectic Mg-Si alloy without
AC treatment. The size interval for counting in this histogram
was 100mm. For this sample, the primary Mg2Si crystal sizes
were distributed in a very wide range, with an average size
and standard deviation of 403mmand 241mm, respectively.
Figure 8 shows the statistical histograms for the primary
Mg2Si crystal sizes in the hypereutectic Mg-Si alloy treated
through process Nos. 2 to 4. The size interval for counting in
these histograms was 50mm. For the sample treated through
process No. 2, the primary Mg2Si crystal sizes were
distributed in a relatively wide range, as shown in Fig. 8(a). The average size and standard deviation were decreased
to 322mmand 153mm, respectively. For the sample treated
through process No. 3, the distribution of primary Mg2Si
Fig. 4 Middle magnification (40) SEM image of the hypereutectic Mg-Si alloy without alternative current treatment.
Fig. 5 Middle magnification (40) SEM images of the hypereutectic Mg-Si alloy treated through process No. 2 (a), process No. 3 (b) and process No. 4 (c).
[image:4.595.85.510.435.760.2]crystal sizes was in a narrow range, as shown in Fig. 8(b). The average size and standard deviation were further
decreased to approximately 237 and 92mm, respectively.
For the sample treated through process No. 4, the primary
Mg2Si crystal sizes were distributed in a same range as that of
the No. 3 sample, as shown in Fig. 8(c). The average size was
further decreased to 202mmand the standard deviation was
approximately 96mm, which is almost the same as that of the
No. 3 sample. For the two samples treated through process
Nos. 3 and 4. The ratios of the primary Mg2Si crystals with
sizes over 400mmin these two samples were 6% and 4%,
respectively. However, the total ratios of the primary Mg2Si
crystals with sizes over 400mmamounted to 40% and 24%
for the sample without AC treatment and the No. 2 sample, respectively.
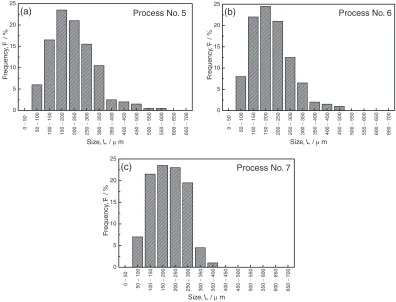
Figure 9 shows the statistical histograms of the primary
Mg2Si crystals sizes in the hypereutectic Mg-Si alloy treated
through process Nos. 5 to 7. The size interval for counting
in these histograms was 50mm. For the sample treated
through process No. 5, the primary Mg2Si crystal sizes were
distributed in a same range as that of the No. 3 sample, as shown in Fig. 9(a). The statistical average size and standard
deviation were 220mm and 89mm, respectively. For the
sample treated through process No. 6, the distribution of
primary Mg2Si crystal sizes became narrower, as shown in
Fig. 9(b). The statistical average size and standard deviation
were decreased to 199mmand 79mm, respectively. For the
sample treated through process No. 7, the primary Mg2Si
crystal sizes were distributed in the narrowest range in all
samples, as shown in Fig. 9(c). The average size was 196mm,
which was almost the same as that of the sample treated through process No. 6, while the standard deviation was
further decreased to 68mm. Some coarse primary Mg2Si
crystals with sizes over than 400mmwere present in the two
samples treated through process Nos. 5 and 6, and the total
ratios of primary Mg2Si crystals with sizes over 400mmwere
4.5% and 2.5%, respectively. However, coarse primary
Mg2Si crystals with sizes over than 400mm were not
observed in the sample treated through process No. 7. Fig. 6 Middle magnification (40) SEM images of the hypereutectic Mg-Si alloy treated through process No. 5 (a), process No. 6 (b) and
process No. 7 (c).
0 5 10 15 20 25
1600
~
1700
Size, L / µ m 1500
~
1600
1400
~
1500
1200
~
1300
1100
~
1200
1000
~
1100
900
~
1000
800
~
900
700
~
800
600
~
700
500
~
600
400
~
500
300
~
400
200
~
300
100
~
200
0
~
100
F
requency
,
F
/ %
Without alternating current treatment
[image:5.595.87.509.69.399.2] [image:5.595.56.284.448.609.2]0 5 10 15 20 25
Size, L / µm
(a) 100 ~ 150 850 ~ 900 800 ~ 850 750 ~ 800 700 ~ 750 650 ~ 700 600 ~ 650 550 ~ 600 500 ~ 550 450 ~ 500 400 ~ 450 350 ~ 400 300 ~ 350 250 ~ 300 200 ~ 250 150 ~ 200 0 ~ 50 50 ~ 100
Process No. 2
F requency , F / % 0 5 10 15 20 25 (b) Process No.3 F requency , F / % 0 5 10 15 20 25
(c) Process No. 4
F
requency
,
F
/ %
Size, L / µm
100 ~ 150 850 ~ 900 800 ~ 850 750 ~ 800 700 ~ 750 650 ~ 700 600 ~ 650 550 ~ 600 500 ~ 550 450 ~ 500 400 ~ 450 350 ~ 400 300 ~ 350 250 ~ 300 200 ~ 250 150 ~ 200 0 ~ 50 50 ~ 100 100 ~ 150 850 ~ 900 800 ~ 850 750 ~ 800 700 ~ 750 650 ~ 700 600 ~ 650 550 ~ 600 500 ~ 550 450 ~ 500 400 ~ 450 350 ~ 400 300 ~ 350 250 ~ 300 200 ~ 250 150 ~ 200 0 ~ 50 50 ~ 100
Size, L / µm
Fig. 8 Statistical histograms of the primary Mg2Si particles sizes in the hypereutectic Mg-Si alloy treated through process No. 2 (a), process No. 3 (b) and process No. 4 (c). The size intervals for counting in these three histograms were 50mm.
0 5 10 15 20 25
(a) Process No. 5
Size, L / µ m
0 ∼ 50 50 ∼ 100 100 ∼ 150 150 ∼ 200 200 ∼ 250 250 ∼ 300 300 ∼ 350 350 ∼ 400 400 ∼ 450 450 ∼ 500 500 ∼ 550 550 ∼ 600 600 ∼ 650 650 ∼ 700 F requency , F / % 0 5 10 15 20 25
(b) Process No. 6
F requency , F / % 0 5 10 15 20 25
(c) Process No. 7
F
requency
,
F
/ %
Size, L / µ m
0 ∼ 50 50 ∼ 100 100 ∼ 150 150 ∼ 200 200 ∼ 250 250 ∼ 300 300 ∼ 350 350 ∼ 400 400 ∼ 450 450 ∼ 500 500 ∼ 550 550 ∼ 600 600 ∼ 650 650 ∼ 700
Size, L / µ m
0 ∼ 50 50 ∼ 100 100 ∼ 150 150 ∼ 200 200 ∼ 250 250 ∼ 300 300 ∼ 350 350 ∼ 400 400 ∼ 450 450 ∼ 500 500 ∼ 550 550 ∼ 600 600 ∼ 650 650 ∼ 700
Fig. 9 Statistical histogram of the primary Mg2Si particles size in the hypereutectic Mg-Si alloy through process No. 5 (a), process No. 6 (b) and process No. 7 (c). The size intervals for counting in these three histograms were 50mm.
[image:6.595.88.509.73.394.2] [image:6.595.99.495.456.758.2]The results show that the primary Mg2Si crystals could be
refined by application of AC into the hypereutectic Mg-Si melt during solidification. The temperature range for appli-cation of AC was a significant factor to determine the effect
of modification on the primary Mg2Si crystals. When the AC
was applied from a high starting temperature of 770C, the
average sizes of the samples were reduced with the decrease in the ending temperature. Agglomeration of the refined
primary Mg2Si crystals occurred if the AC was turned off at
the ending temperatures of 700 and 630C. If the AC was
applied from a starting temperature of 700C, no obvious
agglomeration of the refined primary Mg2Si crystals was
observed. The primary Mg2Si crystals could be effectively
modified, even though the sample was treated in the narrow
temperature range between 700 and 680C. The average sizes
of the primary Mg2Si crystals and their standard deviations
could be further reduced with decrease in the ending
temperature to 650 and 630C. The lowest average size and
highest uniformity of size were obtained when the hyper-eutectic Mg-Si melt was treated through process No. 7, i.e., application of AC in the temperature range between 700 and
630C.
4. Discussion
For the present experimental conditions, the cooling curves for all samples were recorded. The effect of the AC on the cooling rate was negligible and the average cooling
rates from 760 to 640C were almost the same, at 1.9C/s, for
all samples. Details regarding the effect of AC on the cooling
rate has been discussed previously.23)
The primary Mg2Si crystals began to nucleate and grow in
the hypereutectic Mg-Si melt after the temperature decreased
to less than the liquidus temperature of 761C.23)The growth
characteristics of the primary Mg2Si crystals had a close
relation with the cooling rate. In the studies performed by
Ourfali et al.24) and Qin et al.,25) it was found that the
morphologies of the primary Mg2Si crystals changed from
coarse equiaxed to dendritic over a critical velocity for the
cooling rate. The crystal structure of the Mg2Si is face
centered cubic (FCC) and the dendrite arm grows along
the preferential [100] crystallographic direction.5,25)For the
sample without AC treatment, the morphologies of the
primary Mg2Si crystals are mainly characterized by dendrites
(shown in Fig. 4), which implies that the solidification cooling rate was above the critical velocity, as reported by
Ourfaliet al.24)and Qinet al.25)
To date, many studies have investigated the mechanisms for microstructure refinement caused by EMV, and some
mechanisms have been proposed.9–14,17–22)The refinement of
solidified structures subjected to EMV is mainly determined by two factors. One is that EMV promotes the nucleation rate of primary crystals. The other is that EMV contributes to the fracture of the primary dendritic crystals. For example, the
study performed by Huanget al.9)showed that an optimum
AC contributed to a significant increase in the nucleation rate. On the other hand, the dendritic primary phase could be fractured by EMV and the small fragmental particles of the primary phase could also act as nuclei for the growth of
primary crtstals.10,17)
When the hypereutectic Mg-Si melt is treated by AC J,
with frequency f, an alternating magnetic fieldB, with the
same frequency is induced in the melt.16–19)The alternating
magnetic field then interacts with the electric current and
induces an electromagnetic vibration (EMV) in the melt.16–19)
Mg2Si crystals with complex dendritic morphologies are
disintegrated at weak parts in the crystals by the EMV. For dendritic crystals, the weak parts are the base regions where secondary dendrites grow from, such as the primary trunk of dendrites, or third dendrites grow from the trunk of secondary
dendrites.26)These base regions become gradually smaller if
the melting point decreases, due to enrichment of the solutes
rejected from the surfaces of the dendrites.26)Consequently,
the primary Mg2Si crystals are effectively modified and their
sizes are significantly refined. For the three samples treated
from the starting temperature of 700C, the standard
deviations and total ratios of Mg2Si crystals with sizes over
400mm to the 200 primary Mg2Si crystals were gradually
decreased with the decrease in the ending temperature, which
implies that modification of the primary Mg2Si crystals
caused by application of the AC continued until the eutectic reaction ended.
The thickness of the electromagnetic skin layer , was
calculated to be approximately 8.7 mm when the frequency of the AC was 1 kHz. This means that the actual passage area of the AC is less than the total longitudinal section of the sample. For the hypereutectic Mg-Si melt containing
primary Mg2Si crystals, the electrical conductivity of the
Mg2Si crystals should be much lower than that of the
melt, because the Mg2Si phase is an n-type semiconductor,5)
and an Archimedes electromagnetic force is developed that
acts on the Mg2Si crystals to resist the motion caused by
the EMV.13,27,28)Therefore, it is possible that some primary
Mg2Si crystals are moved away by the Archimedes
electro-magnetic force to some regions where the AC does not
flow. These primary Mg2Si crystals are not fully modified
by the EMV and they grow into large Mg2Si crystals. The
primary Mg2Si crystals present in the regions where the
AC did not flow were not considered in the present study. Further study is required to investigate the effect of EMV on
the distributions of primary Mg2Si crystals in the entire
sample.
In the case of the higher starting temperature of 770C,
agglomeration of the refined primary Mg2Si crystals was
observed in the samples treated through process Nos. 3 and 4, as shown in Figs. 3(c) and 3(d). This might occur only when the AC is continuously imposed upon the hypereutectic
Mg-Si melt until temperatures below 740C. The melt containing
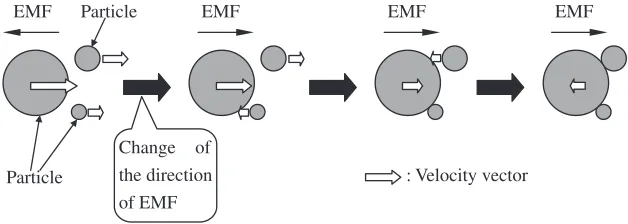
Mg2Si particles vibrates periodically and the direction of
movement of the melt and the particles are opposite under the imposition of AC, due to the low electrical conductivity of
solid Mg2Si compared with that of the melt. For a particle, its
motion velocity, which is driven by the Archimedes
electro-magnetic force, is mainly controlled by its diameter.27,28)A
larger particle has greater velocity.27)Particles with different
diameters should continuously move in the same direction, due to the inertial force after the direction of the EMV changes. The distance that a particle moves to a position where the direction of the particle changes is also a function
amplitude of movement, because a larger particle is subjected to more inertial force. It is therefore possible that particles with different diameters coagulate together, as shown in
Fig. 10, which was proposed by Kameyama et al.27)
Con-sequently, many primary Mg2Si crystals that are coagulated
together could be kept in certain zones of the melt, resulting in the formation of larger agglomerations, as shown in Figs. 3(c) and 3(d).
In the study of Kameyama et al.,27)the Al
2O3 particles
coagulated together in the Al-Cu melt by the effect of EMV
and resulted in the increase of the Al2O3 particle size.27)In
the present study, agglomerations of the primary Mg2Si
crystals occurred with fragmentation of the dendritic arms of
the crystals. On the other hand, some large primary Mg2Si
crystals were moved by the Archimedes electromagnetic force to regions where the AC did not flow. Therefore, the
effective refinement of primary Mg2Si crystals was achieved
in the present study, even though agglomeration of the
refined Mg2Si crystals occurred.
Agglomeration of the refined primary Mg2Si crystals
resulted in the formation of primary Mg2Si crystal-free areas,
as shown in Figs. 3(c) and 3(d). The reason why the primary
Mg2Si crystal-free areas were formed is not clear. After
agglomeration of the Mg2Si crystals, it can be reasonably
inferred that the electrical conductivity in the regions
containing agglomerations of Mg2Si crystals is relatively
lower than that of the pure melt. Small primary Mg2Si
crystals that are subsequently precipitated would be moved to regions with lower conductivity by the Archimedes electro-magnetic force. Consequently, the conductivity would
increase in regions where the primary Mg2Si crystals were
moved away from. The primary Mg2Si crystals precipitated
in these regions would be more easily moved away to the
regions with lower conductivity. As a result, primary Mg2Si
crystal-free areas were formed, as shown in Figs. 3(c) and 3(d).
5. Conclusions
An alternating current (60 A, 1 kHz) was imposed on a hypereutectic Mg-4.8 mass% Si melt during solidification over a range of temperatures to examine the modification of
the primary Mg2Si crystals. The following conclusions were
made:
(1) Primary Mg2Si crystals could be effectively refined by
imposing an alternating current on the hypereutectic Mg-Si melt during solidification. The temperature range during
imposition of the alternating current was a significant factor
to determine the modification effect on the primary Mg2Si
crystals.
(2) When imposition of the alternating current was begun
from a higher starting temperature of 770C, the average
sizes of the samples were significantly reduced with the
decrease in the ending temperature to 700 and 630C, and
agglomeration of the refined primary Mg2Si crystals occurred
under these conditions.
(3) No obvious agglomeration of the refined primary
Mg2Si crystals was observed if imposition of the alternating
current was begun from 700C. The average sizes of primary
Mg2Si crystals and their standard deviations were reduced
with the decrease in the ending temperature to 630C. The
lowest average sizes and the highest uniformity of size were obtained when the hypereutectic Mg-Si melt was treated in
the temperature range between 700 and 630C.
Acknowledgement
This work was partially supported by JSPS Asian Core Program ‘‘Construction of the World Center on Electro-magnetic Processing of Materials’’, and Natural Science Foundation of Guangdong Province, China (Contract No. 05300139).
REFERENCES
1) B. L. Mordike and T. Ebert: Mater. Sci. Eng. A302(2001) 37–45. 2) A. A. Luo: Int. Mater. Rev.49(2004) 13–30.
3) P. Zhang: Scr. Mater.52(2005) 277–282.
4) D. J. Kang, S. S. Park, Y. S. Oh and N. J. Kim: Mater. Sci. Eng. A 449–451(2007) 318–321.
5) E. E. Schmid, K. V. Oldenburg and G. Frommeyer: Z. Metallkde.81 (1990) 809–815.
6) Y. C. Pan, X. F. Liu and H. Yang: Characterization55(2005) 241–247. 7) Q. C. Jiang, H. Y. Wang, Y. Wang, B. X. Ma and J. G. Wang: Mater.
Sci. Eng. A392(2005) 130–135.
8) H. Y. Wang, Q. C. Jiang, B. X. Ma, Y. Wang, J. G. Wang and J. B. Li: J. Alloy. Compd.387(2005) 105–108.
9) L. G. Huang and W. Q. Zhang: Nonferrous Metals57(2005) November 6–8.
10) A. prodhan, C. S. Sivaramakrishnan and A. K. Chakrabarti: Metall. Mater. Trans.32B(2001) 372–378.
11) C. Vive`s: Metall. Mater. Trans. B27(1996) 445–455. 12) C. Vive`s: Metall. Mater. Trans. B27(1996) 457–464.
13) A. Radjai, K. Miwa and T. Nishio: Metall. Mater. Trans.29A(1998) 1477–1484.
14) Y. Mizutani, S. Kawai, K. Miwa, K. Yasue, T. Tamura and Y. Sakaguchi: Mater. Trans.45(2004) 1939–1943.
EMF
Particle
Particle EMF EMF EMF
Change of the direction of EMF
[image:8.595.140.454.73.185.2]: Velocity vector
Fig. 10 Mechanism of coagulation of particles under electromagnetic vibration.27)
15) Y. Mizutani, Y. Ohura, K. Miwa, K. Yasue, T. Tamura and Y. Sakaguchi: Mater. Trans.45(2004) 1944–1948.
16) T. Takaki, K. Iwai and S. Asai: ISIJ Int.43(2003) 842–848. 17) K. Sugiura and K. Iwai: ISIJ Int.45(2005) 962–966. 18) M. Usui, K. Iwai and S. Asai: ISIJ Int.47(2007) 1571–1574. 19) M. Usui, K. Iwai and S. Asai: ISIJ Int.47(2007) 1613–1617. 20) Y. Mizutani, T. Tamura and K. Miwa: Mater. Sci. Eng. A413–414
(2005) 205–210.
21) M. Li, T. Tamura and K. Miwa: Acta Mater.55(2007) 4635–4643. 22) M. Li, T. Tamura and K. Miwa: ISIJ Int.48(2008) 320–329. 23) J. Du and K. Iwai: Mater. Trans. (2009), doi:10.2320/matertrans.
MRA2008235.
24) M. F. Ourfali, I. Todd and H. Jones: Metall. Mater. Trans.36A(2005) 1368–1372.
25) Q. D. Qin, Y. G. Zhao, W. Zhou and P. J. Cong: Mater. Sci. Eng. A447 (2007) 186–191.
26) Q. C. Li: Principles of casting formation, (Mechanical Industry Press, 1989) pp. 94–155.
27) T. Kameyama, S. Niwa, J. Park, T. Matumura, K. Sassa and S. Asai: Tetsu-to-Hagane´89(2003) 623–628.