Enhanced Room-Temperature Stretch Formability
of Mg
0.2 mass
%
Ce Alloy Sheets Processed by Combination
of High-Temperature Pre-Annealing and Warm Rolling
Kazutaka Suzuki
1,+, Yasumasa Chino
1, Xinsheng Huang
1,
Motohiro Yuasa
1and Mamoru Mabuchi
21Materials Research Institute for Sustainable Development, National Institute of Advanced Industrial Science and Technology,
Nagoya 463-8560, Japan
2Department of Energy Science and Technology, Graduate School of Energy Science, Kyoto University,
Kyoto 606-8501, Japan
MgCe alloys exhibit good cold rollability. However, their room-temperature formability is known to be almost the same as that of commercial Mg alloys. In this study, Mg0.2 mass%Ce alloy sheets were processed by repeated high-temperature pre-annealing and subsequent warm rolling. The MgCe alloy sheet processed by pre-annealing at 773 K, rolling at 573 K, and thenfinal annealing at 423 K exhibited a significantly increased Erichsen value of 8.0, which is comparable to the Erichsen values of commercial Al alloys. On the other hand, the reference material obtained by pre-annealing at 673 K, rolling at 673 K, and thenfinal annealing at 423 K had a low Erichsen value of 3.1. The former sheet exhibited a basal texture with lower texture intensity and a larger basal pole inclination angle tilted toward the rolling direction. Extensive twinning contributed to this texture modification. In addition, fewer local deformation bands were observed in this sheet. The pre-annealing at 773 K, which promoted recrystallization, is thought to have resulted in the annihilation of local deformation bands. It is suggested that the enhancement of the room-temperature formability of the MgCe alloy sheets could be attributed to the synchronous effects of the texture modification and the suppression of the formation of local deformation bands. [doi:10.2320/matertrans.L-M2015811]
(Received December 26, 2014; Accepted April 3, 2015; Published June 5, 2015)
Keywords: magnesium alloys, rolling, texture, microstructure, stretch formability, tensile properties
1. Introduction
Mg alloys are promising light-weight structural materials because of excellent properties such as high specific strength and specific stiffness. For their wider application, it is necessary to develop Mg alloy sheets with high room-temperature formability. However, during rolling, (0002) basal planes align parallel to the rolling direction (RD) transverse direction (TD) plane and an intense basal texture is formed. The resulting rolled Mg alloy sheets exhibit poor room-temperature formability.1)
Recently, it was reported that the minor addition of rare-earth elements such as Ce in MgZn alloys is an effective approach for enhancing the room-temperature formability.2,3) For example, a rolled Mg1.5 mass%Zn0.2 mass%Ce alloy sheet showed a large Erichsen value of 9.0, which is comparable to that of commercial Al alloys. The enhanced stretch formability is attributed to the formation of a TD-split texture: a split of the basal planes in the TD at about 35° from the normal direction (ND).35)
In addition, it was reported that the minor addition of rare-earth elements in pure Mg also contributes to modification of the deformation characteristics of Mg alloys. For example, the addition of dilute Ce to Mg improved the cold-rolling ability of the alloy,68) and Mg0.2 mass%Ce alloy extrusions exhibited enhanced ductility at room temperature.9) However, our previous study revealed that the room-temperature formability of a MgCe alloy sheet rolled at 673 K was about the same as that of a pure Mg sheet, despite the fact that basal texture formation of the rolled MgCe alloy was significantly suppressed as
compared with that of the pure Mg processed by a similar rolling procedure.10)
More recently, our research revealed that pre-annealing at approximately 773 K and subsequent warm rolling at approximately 473 K promoted the weakening of basal textures for Mg1.5 mass%Mn alloy sheets, resulting in a significant enhancement of room-temperature formability. The above rolling procedure is considered to promote extensive twinning, which contributes to the suppression of basal texture formation.11)These results obtained for MgMn alloys suggest that the above rolling procedure might also be effective for MgCe alloys.
In this study, MgCe alloy sheets were processed by a combination of high-temperature pre-annealing, subsequent warm rolling, and final annealing. The room-temperature formability, texture, and mechanical properties of the sheets were evaluated.
2. Experimental Procedure
A plate with 70 mm in length, 50 mm in width and 3.0 mm in thickness, machined from the as-received rolled Mg 0.2 mass%Ce alloy, was homogenized at 703 K for 86.4© 103s and subsequently used as the specimen for rolling. During the rolling process, the specimen was first heated at 773 K for 120 s in a furnace. Then, after air cooling, the specimen was heated at 573 K for 120 s and subsequently rolled to a reduction ratio of 24%, during which the roll temperature was maintained at 423 K. The first and second heating steps and the subsequent rolling were repeated until the sheet was rolled to a thickness of 1.0 mm. The sheets were rotated after each pass so that the shear strain could be alternatively introduced. Finally, the rolled sheets were
annealed at a temperature in the range 423623 K for 7.2©103s. It is noted that the main purpose of the
preliminary heating prior to rolling was to promote micro-structural changes induced by strain energy. Henceforth, the temperature at which the initial heating was carried out will be termed as the “pre-annealing temperature”, and the temperature at which the subsequent heating was carried out will be termed as the “rolling temperature”. In addition, the temperature at which thefinal annealing was carried out will be termed as the“final annealing temperature”. Besides, the rolled sheets, of which both the pre-annealing temperature and rolling temperature was set to 673 K, were processed as references. In the paper, the sheet processed by thefirst and second rolling procedures is called“sheet A”and“sheet B”, respectively.
The (0002) plane pole figures of the sheets at the center through the thickness were investigated by the Schulz reflection method. The microtextures of the sheets in the RDND plane were investigated by electron back-scatter diffraction (EBSD) analysis. Also, the microstructures of the sheets in the RDND plane were investigated by optical microscopy.
A circular blank with a diameter of 50 mm was machined from each sheet and polished to 0.9 mm in thickness by using #1200 SiC paper. Erichsen tests were carried out at room temperature using a hemispherical punch with a diameter of 20 mm to investigate the stretch formability of the sheets and the Erichsen value (IE), i.e., the punch stroke at fracture initiation, was measured. The punch speed and blank-holder force were 5 mm/min and 10 kN, respectively. Graphite grease was used as the lubricant. For tensile tests, specimens with a gage length of 12 mm and a gage width of 4 mm were machined from the rolled sheets and polished to 0.9 mm in gage thickness by using #1200 SiC paper. Tensile tests at room temperature were carried out with an initial strain rate of 2.8©10¹3s¹1, where the angles between the tensile direction and the RD were set to 0°, 45°, and 90°. Additional tensile tests were conducted to investigate the Lankford (r) value. The Lankford value is given by r=¾w/¾t=¹¾w/
(¾l+¾w), where ¾l, ¾w, and ¾t are the true strains along the
length, width, and thickness of the specimen, respectively. The¾land¾wvalues were measured for specimens deformed
to approximately 6%of permanent strain along the specimen length, except the specimens with premature fracture, which were deformed along the 0° and 45° directions to the RD for the sheet B specimens annealed at 423 K. The ¾l and
¾w values of the specimens with premature fracture were
measured using specimens deformed to approximately 2%of permanent strain along the specimen length.
3. Results and Discussion
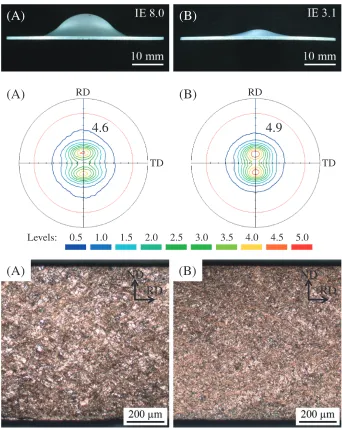
The results of the Erichsen tests for sheets A and B, whose final annealing temperature was 423 K, are shown in Fig. 1 (top figure). The Erichsen value of sheet B was 3.1, which was almost the same as that in our previous study.10) In
contrast, sheet A exhibited a significantly higher Erichsen value of 8.0, which was almost equivalent to those of 5000 and 6000 series Al alloys.12) The above results indicate
that repeated high-temperature pre-annealing and subsequent
rolling at ambient temperature was effective for enhancing the room-temperature formability of MgCe alloys.
Figure 1 (middle figure) shows the (0002) plane pole figures of sheets A and B with afinal annealing temperature of 423 K. Sheets A and B exhibit clear double-peak-type pole figures, in which the peaks of the basal poles inclined toward the RD by approximately «19° and «16°, respectively. In addition, the basal texture intensity of sheet A (4.6) was a little lower than that shown by sheet B (4.9). Atfirst glance, it seems that the lower texture intensity and larger inclination angle of the basal pole of sheet A contributed to strain in the thickness direction, resulting in enhanced room-temperature formability. On the other hand, our previous studies suggested that a reduction in basal texture intensity of 23 is essential for significant enhancement of the room-temper-ature formability of Mg alloys [MgMn alloys11) and AZ31
alloys13)]. The above information implies that in addition to
the variation in basal texture, an additional microstructural factor was likely to have affected the room-temperature formability in the case of MgCe alloy sheets.
Figure 1 (bottom figure) shows optical micrographs of sheets A and B with thefinal annealing temperature of 423 K. It seems that sheet B had a smaller grain size than sheet A, and extensive twinning occurred in sheet A, although grain and twin boundaries were not clearly observed in either specimen. In sheet B, local deformation bands inclined approximately 30° with respect to the RDTD plane and distributed parallel to the TD axis were clearly observed, indicating that macroscopic shear deformation was imposed on these regions. Omori7)and Barnett8)reported that one of
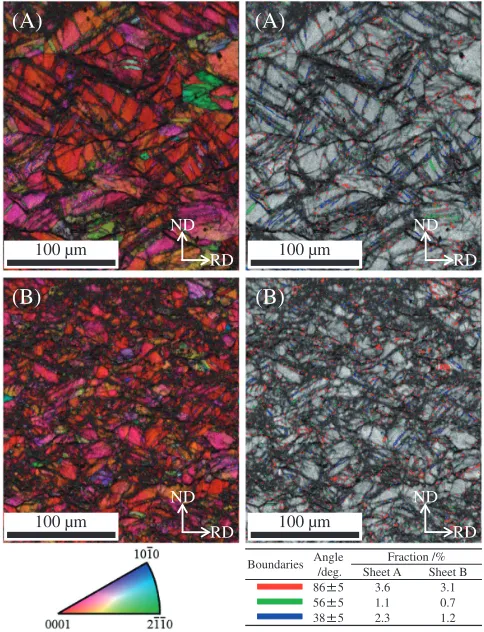
the main reasons for the excellent cold-rolling ability of Mg Ce alloys is the reduced formation of local deformation bands during cold rolling as compared with commercial Mg alloys such as AZ31 because local deformation bands often become fracture sites. From optical microscopy observations, number density of local deformation band along the RD in sheet B was measured to be 5.2©103m¹1. On the other hand, clear formation of local deformation bands was not observed in sheet A. The formation of local deformation bands in sheet A seemed to be suppressed as compared with sheet B. Thus, it is presumed that not only the texture modification but also the suppression of local deformation bands in sheet A contrib-uted to the enhancement of the room-temperature formability. Inverse pole figure maps and the related image quality maps of sheets A and B with afinal annealing temperature of 423 K are shown in Fig. 2. The boundaries of an 86°f1012g extension, 56° f1011g contraction, and 38° f1011gf1012g double twins sharing a commonh1120irotation axis between the twin and the parent grain with a tolerance angle of 5° are indicated in the image quality maps.14) The f1012gh1011i twin is one of the main twins for Mg. Another main twin in Mg is the f1011gh1012i twin. An important twin related to the f1011g twin is the f1011gf1012gdouble twin. The number fractions of 86° f1012g tensile, 56° f1011g compression, and 38° f1011gf1012g double twins were 3.6, 1.1, and 2.3%, respectively, for sheet A and 3.1, 0.7, and 1.2%, respectively, for sheet B. Although the twin bounda-ries exhibited the discrete distribution due to the low band contrast around the twin boundaries,8)it seems that more twin
It is noted that sheet A exhibited a larger average grain size (93.5 µm) than sheet B (60.5 µm). The larger grain size of sheet A was likely due to more intensive grain coarsening originating from high-temperature pre-annealing before roll-ing. It is known that the grain-size dependence of twinning stress is greater than that of slip stress.15) This grain-size
dependence was likely responsible for the increase in twin boundaries with increasing grain size. In our previous study for MgMn alloys,11)the repetition of high-temperature
pre-annealing and subsequent warm rolling promoted the formation of extensive twinning, which contributed to the formation of basal textures with low intensities because
f1011g compression and f1011gf1012g double twins have high misorientation angles between these twins and the matrix. Besides, Couling et al.16) reported that the splitting of basal poles toward the RD develops according to the occurrence of f1011gf1012g double twins. Thus, it is suggested that differences in the twinning behavior accom-panied by differences in grain size are the direct origins of the lower texture intensity and larger inclination angle of the basal pole in sheet A than in sheet B.
The image quality maps in Fig. 2 show more dark regions in sheet B, which are continuously distributed in grains and at grain boundaries, than in sheet A. The dark regions in the image quality maps correspond to low band contrast, which indicates a poor degree of lattice perfection.8) These areas
often correspond to regions of higher dislocation density due to flow localization,8) namely, the formation of local
deformation bands. The image quality maps point out that the formation of local deformation bands was more sup-pressed in sheet A than in sheet B. It is known that development of local deformation bands promotes local strain concentration, resulting in the formation of fracture sites.8)Thus, the suppression of the local deformation bands in sheet A is suggested to be another microstructural factor that enhances room-temperature formability.
In order to clarify the mechanisms of suppression of local deformation bands in sheet A, the microstructures of the as-received MgCe alloy plates before rolling were investigated. Figure 3 shows the microstructures of the as-received MgCe alloy plates after homogenization [Fig. 3(a)] and after pre-annealing at 773 K for 120 s [Fig. 3(b)]. Some twins and
(A)
(B)
0.5 1.0 1.5 2.0 2.5 3.0 3.5 4.0 4.5 5.0 Levels:
RD RD
TD TD
4.6
4.9
(A)
(B)
(B)
(A)
ND
RD
ND
RD
[image:3.595.127.469.67.497.2]local deformation bands were observed in the as-received plate after the homogenization treatment. On the other hand, twins and local deformation bands vanished and a fully recrystallized microstructure was observed in the plate after the annealing treatment, regardless of the short pre-annealing time of 120 s. Our previous research17) confirmed that recrystallization did not occur at 673 K but it did occur at more than 773 K in the MgCe alloys, although recrystalli-zation was observed at 573 K in the case of pure Mg. The suppression of recrystallization by the addition of Ce in Mg was attributed to the activation of extended dislocations (prismatic ©aª slip) accompanied by an increase in the stacking fault energy. The result of previous research15)
implies that the addition of dilute Ce in Mg plays an important role for determining the recrystallization temper-ature. The results of Fig. 3 and the results of our previous study17) indicate that pre-annealing at high temperature (773 K), which was conducted on sheet A, was effective for annihilating local deformation bands and promoting recrystallization. On the other hand, pre-annealing at 673 K, which was conducted on sheet B, was insufficient for promoting recrystallization. Thus, it is demonstrated that the enhancement of the room-temperature formability of sheet A can be attributed to not only texture modification originating from the variation in twinning behaviors but also to suppression of the formation of local deformation bands,
which was accompanied by recrystallization during pre-annealing at high temperature.
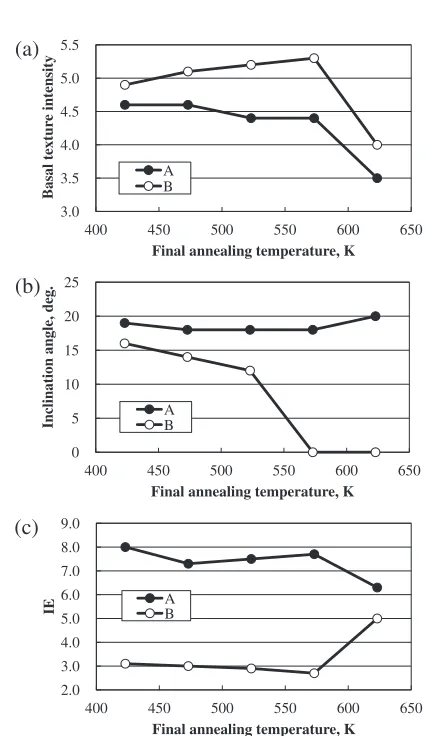
The effects of the final annealing temperature on the formation of basal texture and the Erichsen value of the Mg Ce alloy sheets were also investigated, and the results are summarized in Fig. 4. Figure 4(a) shows the variation in the basal texture intensity of sheets A and B as a function of the final annealing temperature. The basal texture intensity of sheets A and B moderately decreased and increased, respectively, with increasingfinal annealing temperature up to 573 K. The basal texture intensity of both sheets then exhibits an abrupt decrease up to a final annealing temperature of 623 K. Figure 4(b) shows the changes of the inclination angle of the basal pole toward the RD as a function of the final annealing temperature. The inclination angle for sheet B changed from around 12° to 0° when the final annealing temperature was set to more than 523 K. The abrupt changes in the basal texture intensity and the inclination angle of the basal pole suggest that recrystallization occurred during the final annealing at temperatures between 573 and 623 K. It is interesting to note that the recrystallization occurred in the rolled specimen during thefinal annealing set to 573623 K, although recrystallization did not occur in the as-received specimens or the rolled specimens during the pre-annealing set to 673 K. The reason for the recrystallization at lower temperatures in the rolled specimens during the final annealing was likely that the period of the final annealing was much longer than that of the pre-annealing.
(A)
(B)
(B)
(A)
Boundaries Angle /deg.
Fraction /% Sheet A Sheet B 86 5 3.6 3.1 56 5 1.1 0.7 38 5 2.3 1.2 100 µm
100 µm
100 µm 100 µm
ND
RD
ND
RD
ND
RD ND
RD
Fig. 2 Inverse polefigure maps of the RDND plane for sheets A and B
final annealed at 423 K, and related image quality maps of the RDND plane, where the boundaries of tensile, compression, and double twins are characterized by red, green, and blue lines, respectively. Bottom table indicates fraction of tensile, compression, and double twins for sheets A and Bfinal annealed at 423 K.
(a)
(b)
ND
RD
ND
RD
[image:4.595.321.533.67.396.2] [image:4.595.48.290.71.387.2]Figure 4(c) shows the changes of the Erichsen value of sheets A and B as a function of the final annealing temperature. The Erichsen value did not show any significant change at a final annealing temperature of less than 573 K.
However, a sudden decrease and increase was observed in sheets A and B, respectively, when the final annealing temperature was set to 623 K. The changes were accom-panied by a decrease in the basal texture intensity for both sheets. It should be noted that some coarse grains approximately 50 µm in size were observed in both speci-mens subjected to a final annealing of 623 K, although the average grain size was 15.6 µm for sheet A and 15.4 µm for sheet B. Thus, the deterioration in the Erichsen values observed in sheet A at 623 K could probably be attributed to abnormal grain growth, which may promote the formation of coarsef1011gf1012gdouble-twins as fracture sites.18)The
enhancement of the Erichsen values observed in sheet B at a final annealing temperature of 623 K could be explained by the fact that the synchronous effects of the annihilation of local deformation bands by recrystallization and the texture modification as explained above were dominant as compared with the effect of abnormal grain growth. The lower Erichsen value of sheet B than sheet A at afinal annealing temperature of 623 K was likely due to the differences in the basal texture intensity between them.
As shown in Fig. 4(b), sheet B subjected to a final annealing of 573 K exhibited a large change in the inclination angle of the basal pole, which is evidence of recrystallization. However, the Erichsen value of sheet B was insensible to the above texture modification. One possible reason for this trend was that the deformation microstructure may not have been fully recrystallized at afinal annealing temperature of 573 K. The tensile properties and Erichsen values of sheets A and B subjected to final annealing temperatures of 423 K and 573 K were also investigated and the results are summarized in Table 1. In sheet A, the specimenfinal annealed at 573 K exhibited lower yield stress and higher failure elongation as compared with the specimen final annealed at 423 K. This was likely due to annihilation of local deformation bands and work hardening as a result of the final annealing at higher temperature. On the other hand, the differences in r values were negligibly small. This trend was consistent with the results of the Erichsen tests. The same trends in the
3.0 3.5 4.0 4.5 5.0 5.5
400 450 500 550 600 650
Basal textur
e intensity
Final annealing temperature, K A
B
2.0 3.0 4.0 5.0 6.0 7.0 8.0 9.0
400 450 500 550 600 650
IE
Final annealing temperature, K A
B
(c)
(a)
0 5 10 15 20 25
400 450 500 550 600 650
Inclination angle, deg
.
Final annealing temperature, K A
B
(b)
[image:5.595.53.551.93.299.2]Fig. 4 Changes in basal texture intensity, inclination angle of basal pole, and Erichsen value (IE) as a function of thefinal annealing temperature for sheets A and B.
Table 1 Tensile properties,rvalues, and Erichsen values of the rolled Mg0.2 mass%Ce alloys (sheets A and B). The notationsUTS,YS, andFEdenote the ultimate tensile strength, yield stress, and fracture elongation, respectively. Tensile properties were determined by three tensile tests (N=3).
Rolled sheets
Final-annealing temperature/K
Angle
/deg.
UTS/MPa YS/MPa FE/%
r-value IE
Average Max. Min. Average Max. Min. Average Max. Min.
A
423
0 188 188 187 159 160 157 17 17 16 0.31
8.0
45 199 199 199 160 162 158 20 21 18 0.56
90 230 231 227 170 171 167 16 16 16 0.84
573
0 186 187 184 128 129 128 18 19 17 0.35
7.7
45 207 208 207 139 140 139 22 23 21 0.61
90 231 233 230 152 152 151 23 23 23 0.89
B
423
0 193 194 193 153 155 152 3 3 3 0.42
3.1
45 208 208 208 157 158 156 4 4 3 0.65
90 227 228 227 168 169 168 22 23 20 1.10
573
0 214 215 213 148 148 147 17 18 15 0.67
2.7
45 228 229 228 136 136 135 17 18 17 1.28
[image:5.595.51.368.97.670.2] [image:5.595.60.273.304.672.2]relationships between the r values and the Erichsen values were also observed in sheet B subjected to final annealing temperatures of 423 K and 573 K.
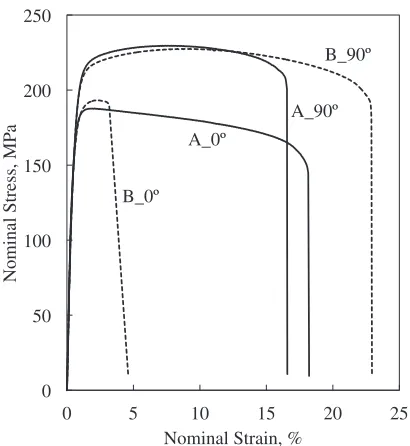
The typical stressstrain curves of sheets A and B final annealed at 423 K are shown in Fig. 5. It is known that the large strain-hardening exponent leads to a reduction in plastic instability, resulting in enhanced stretch formability.1)
How-ever, sheets A and B exhibited almost the same work hardening behaviors, indicating that the enhanced stretch formability of sheet A is likely independent of the work hardening behaviors.
It is noted that the failure elongation of sheet B subjected to the final annealing temperature of 423 K exhibited much lower values at 0° and 45° than it did at 90° in Table 1. The deterioration in failure elongation at 0° and 45° was not observed in sheet A subjected to thefinal annealing temper-ature of 423 K. As shown in Fig. 1 (optical micrographs) for sheet B subjected to thefinal annealing temperature of 423 K, local deformation bands inclined approximately 30° with respect to the RDTD plane and distributed parallel to the TD axis were clearly observed. The geometric configuration of the local deformation band in sheet B indicates that the local deformation bands helped fracture propagation along the TD. The fracture propagation along to the TD was likely connected to the deterioration in the failure elongation of sheet B at 0° and 45°.
4. Conclusions
In this study, Mg0.2 mass%Ce alloy sheets were proc-essed by a combination of high-temperature pre-annealing, subsequent warm rolling, and final annealing. The room-temperature formability, texture, and mechanical properties of the sheets were evaluated. The results are summarized below.
(1) Sheets pre-annealed at 773 K, rolled at 573 K, and then final annealed at 423 K exhibited a significant Erichsen value of 8.0, which is comparable to the Erichsen values of commercial Al alloys. On the other hand, the reference samples that were pre-annealed at 673 K, rolled at 673 K, and thenfinal annealed at 423 K had a low Erichsen value of 3.1.
(2) Sheets pre-annealed at 773 K, rolled at 573 K, and then final annealed at 423 K exhibited basal textures with lower basal texture intensity and basal poles with higher inclination angles towards the RD as compared with the references. The rolling procedure promoted the for-mation of extensive twinning in the rolled sheet, which contributed to the modification of the basal texture. (3) Fewer local deformation bands, which often become
fracture sites, were observed in sheets pre-annealed at 773 K, rolled at 573 K, and thenfinal annealed at 423 K than in the reference sheets. The high-temperature pre-annealing at 773 K, which promoted recrystallization, probably contributed to the annihilation of the local deformation bands in the sheets.
(4) The enhancement of the room-temperature formability of the MgCe alloy sheets pre-annealed at 773 K, rolled at 573 K, and then final annealed at 423 K is likely attributed to the synchronous effects of the texture modification originating from the variation in twinning behaviors and the suppression of the formation of local deformation bands, which was accompanied by recrys-tallization during pre-annealing at high temperature.
REFERENCES
1) Y. Chino, H. Iwasaki and M. Mabuchi:Mater. Sci. Eng. A466(2007) 9095.
2) Y. Chino, K. Sassa and M. Mabuchi:Mater. Trans.49(2008) 1710 1712.
3) Y. Chino, K. Sassa and M. Mabuchi:Mater. Trans.49(2008) 2916 2918.
4) L. W. F. Mackenzie and M. O. Pekguleryuz:Scr. Mater.59(2008) 665 668.
5) K. Hantzsche, J. Wendt, K. U. Kainer, J. Bohlen and D. Letzig:JOM61
(2009) 3842.
6) S. L. Couling, J. F. Pashak and L. Sturkey: Trans. ASM51(1959) 94 107.
7) G. Omori, S. Matsuo and H. Asada:J. Jpn. Inst. Light Met.17(1967) 3237.
8) M. R. Barnett, M. D. Nave and C. J. Bettles:Mater. Sci. Eng. A386
(2004) 205211.
9) R. K. Mishra, A. K. Gupta, P. R. Rao, A. K. Sachdev, A. M. Kumar and A. A. Luo:Scr. Mater.59(2008) 562565.
10) Y. Chino, M. Kado and M. Mabuchi:Mater. Sci. Eng. A494(2008) 343349.
11) K. Suzuki, Y. Chino, X. Huang, M. Yuasa and M. Mabuchi:Mater. Trans.54(2013) 392398.
12) Aluminum Handbook, (4th ed.) (Japan Light Metal Association, Tokyo,
2000) p. 98.
13) X. Huang, K. Suzuki, Y. Chino and M. Mabuchi:J. Alloy. Compd.509
(2011) 75797584.
14) M. D. Nave and M. R. Barnett:Scr. Mater.51(2004) 881885. 15) M. A. Meyers, O. Vöhringer and V. A. Lubarda:Acta Mater.49(2001)
40254039.
16) S. L. Couling, J. F. Pashak and L. Sturkey: Trans. ASM51(1959) 94 107.
17) Y. Chino, M. Kado and M. Mabuchi:Acta Mater.56(2008) 387394. 18) J. Koike, N. Fujiyama, D. Ando and Y. Sutou:Scr. Mater.63(2010)
747750.
0 50 100 150 200 250
0 5 10 15 20 25
Nominal Stress, MP
a
Nominal Strain, % A_0º
B_90º
B_0º
A_90º
[image:6.595.67.272.68.291.2]