Structure and spectroscopy of hydrogen adsorbed in a nickel metal-organic
framework
Craig M. Brown,
1,2*Anibal Javier Ramirez-Cuesta,
3Jae-Hyuk Her,
1,4,5Paul
S. Wheatley,
6Russell E. Morris
61National Institute of Standards and Technology, Center for Neutron Research,
Gaithersburg, MD 20899, USA. Email: [email protected]
2Department of Chemical Engineering, University of Delaware, Newark, DE 19716,
USA
3Chemical and Engineering Materials Division, Neutron Sciences Directorate,
Oak Ridge National Laboratory, Oak Ridge, TN 37831-6460, USA
4Dept. Material Science and Engineering, University of Maryland, College Park, MD
20742, USA
5(Current address) GE Global Research, Niskayuna, NY 12309 USA
6EaStCHEM School of Chemistry, University of St Andrews, St Andrews KY16 9ST,
United Kingdom
Abstract
The structure of Ni2(dobdc) (dobdc4- = 2,5- dioxido-1,4-benzenedicarboxylate) as a function of deuterium adsorption has been determined through the application of in-situ neutron powder diffraction. Detailed information concerning the local adsorption potential for hydrogen at each site has also been probed using inelastic neutron scattering techniques. These results are compared to those previously published on isostructural analogues and the Ni2+ variant shows the shortest deuterium-metal distance in the M2(dobdc) series (M = Mg, Zn, Co, Fe) that have been studied so far.
Keywords: Neutron scattering; Hydrogen storage; Metal-organic framework; porous crystal
Introduction
Hydrogen storage has been viewed as a potentially viable mechanism for moving to a non-fossil-fuel based energy infrastructure.1 One of the main stumbling blocks is being able to store enough hydrogen at ambient temperatures on a gravimetric and volumetric
*Manuscript
basis. While no single material has been proven to be viable at this point, the concept of using physical adsorption in metal-organic frameworks (MOF) with enhanced interactions with unsaturated metal centers has been proposed.2-6 Thermodynamic considerations indicate that the enthalpy for adsorption should be around 20 kJ/mol to have reversible storage around ambient temperature.7
M2(dobdc) (M = Mg, Mn, Fe, Co, Ni, Zn) forms an extensive family of isostructural MOFs. The connectivity and pore structure of M2(dobdc) is based on a 1-dimensional honeycomb-like channels, with pores of ~12 Å diameter and helical chains of edge sharing metal oxygen octahedra running down the intersections of the pore walls formed from 2,5-dioxido benzenedicarboxylate (dobdc2−) ligands. One of the pseudo–
octahedra coordination sites at the transition metal is initially solvated at synthesis with this one molecule easily removed to provide a square-based pyramidal coordination with one site now accessible through the pore.8-15 These highly reactive, electron deficient sites allow for strong polarization of adsorbed H2 molecules resulting in zero
coverage isosteric heats ranging from −8.8 to −13.5 kJ/mol.16-20 These values are some of the highest reported,21-26 and are significantly larger than isosteric heats observed for frameworks lacking open metal coordination sites.27 Interaction of hydrogen with the framework is characterized by an enhanced electrostatic interaction with the exposed metals in the framework, and has been characterized by gas adsorption isotherms, powder neutron diffraction, inelastic neutron scattering, theoretical calculation and optical spectroscopies. These studies indicate a strong adsorption primarily at the metal center, followed by adsorption associated with the organic framework oxygen and carbon atoms that are weaker and more van der Waals in nature.28-35
Here, we expand these data to include the Ni2(dobdc) member of the series, which exhibits the strongest enthalpy for hydrogen adsorption and the shortest interaction distance form metal to deuterium. Using inelastic neutron scattering as a probe of the rotational potential, and hence the hydrogen-metal interaction, is complicated due to local magnetic ion fluctuations interconverting para- and ortho-hydrogen that contains a spectrum composed of rotations and rotation-phonon combination bands. However, by using D2 we were able to mask the signal coming from the different site and therefore assign the observed features in the spectra.
Ni(dobdc) was synthesized using published procedures9. The material was characterized using powder X-ray diffraction to ensure the framework structure was correct and prior to data collection the samples were activated to remove residual guests from the pores of the solid. This is best done in a two stage process; first the materials are placed under vacuum to remove loosely held guests before heating carefully to 110 C under dynamic vacuum for 36 hrs to ensure all coordinated water molecules are removed36-37
The BT-1 high-resolution neutron powder diffractometer at the National Institute of Standards and Technology Center for Neutron Research (NCNR) was used to perform neutron powder diffraction (NPD) experiments on 1.075 g of activated Ni2(dobdc). Data were collected using a Ge(311) monochromator with an in-pile 60' collimator resulting in a wavelength of 2.0782 Å. The sample in a vanadium cell was mounted with gas loading lines on to a closed-cycle refrigerator and data were collected on the bare framework at 4 K. For D2 loading, the sample was heated to 77 K, exposed to a specified amount of D2, and subsequently cooled back to 4 K for data measurement. Data were collected at loadings of 0.5 and 1.5 D2 molecules per nickel. NPD data were analyzed using the Rietveld method as implemented in EXPGUI/GSAS.38-39 Adsorbed atoms were located using Fourier techniques and subsequently added to the Rietveld model and refined as single atoms of D with double occupancy due to the quantum mechanical rotational that average their positions.29
Inelastic neutron scattering (INS) experiments were performed on the Filter Analyzer Neutron Spectrometer (FANS) at the NCNR40 and with improved resolution on the TOSCA41 neutron spectrometer located at the ISIS facility of the Rutherford Appleton Laboratories. When operated with one proton pulse removed for use on the second target station, the instrument accesses energy transfers between -3 meV and 500 meV with a resolution of ≈2% E/E on the sample energy gain (positive) side of the spectrum. The same sample used for diffraction was loaded in to a vanadium cell (1.024 g) in a helium glovebox and attached to a gas loading stick for a top-loading closed-cycle refrigerator that is installed in the spectrometer. The spectrum of the activated, bare, sample was measured at base temperature at ~12 K. Calibrated volumes were used to dose known amounts of n-H2 and p-H2 at 35 K and the spectra were recorded at ~12 K.
filter consisting of Bi, Be, and graphite, the energy transfer of the scattered neutrons is determined at a bank of 3He detectors. Data were collected on the bare framework, and with loadings of 1 p-H2 and 2 p-H2 per Ni2+. An additional loading with 1 D2 saturating the strongest adsorption site followed by a further 1 p-H2 per Ni2+ was measured. The smaller zero-point motion of the D2 molecule ensures that it is adsorbed at the strongest binding site, thus saturating the metal with the much weaker scattering D2, and allows for easier discrimination of the weaker sites that adsorb H2.20 While both spectrometers probe similar ranges in momentum transfer (Q), FANS measures intensities proportional to the densities-of-states and TOSCA measures the scattering function, S(Q, ω). This
effectively gives the FANS spectra an intensity boost that goes as the square of the
energy transfer, ω. Upon hydrogen adsorption the framework modes are apparently not significantly perturbed and a direct subtraction of the bare framework spectra results in the rotation-vibration spectra of the adsorbed hydrogen. Data were analyzed using the DAVE software suite.42
Result and Discussion
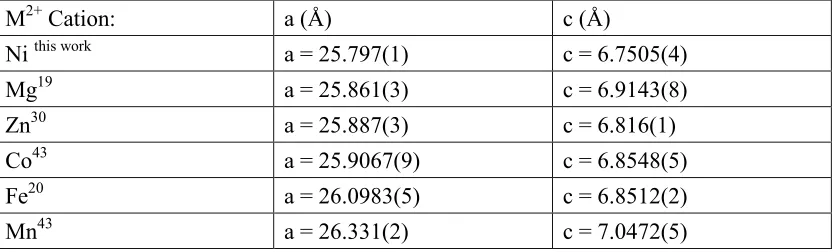
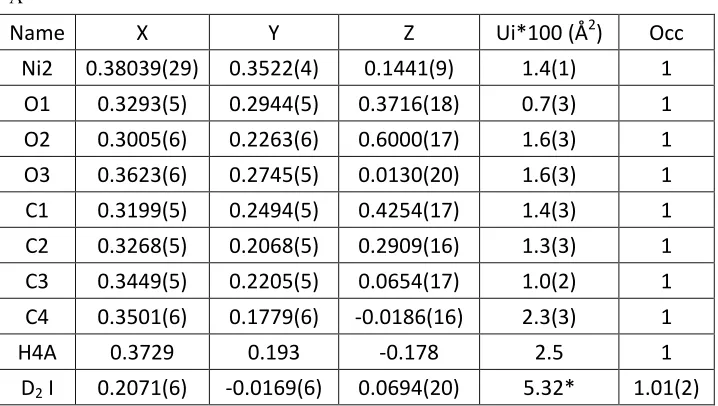
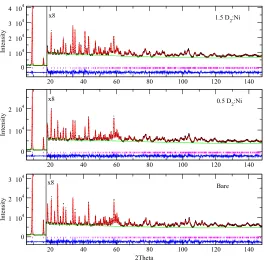
Rietveld refinement of the neutron powder diffraction (NPD) data measured on the activated Ni2(dobdc) material was performed using an isostructural refinement previously determined as an initial model.30 The data is consistent with the structure conforming to a R-3 space group and unit cell parameters of a = 25.797(1) Å and c = 6.7505(4) Å. The unit cell dimensions are the smallest compared to those determined for Zn,30 Mg,19 Fe,20,44 Co,43 and Mn43 variants from NPD data under similar conditions (Table 1). Figure 1 indicates that the model provides an excellent fit to the data, with structural parameters detailed in Table 2.
oblateness of the site I deuterium here, results in a very close interaction distance of 2.20(1) Å. The short distance correlates well with the reported high initial heat of hydrogen adsorption at −13.5 kJ/mol.20, 47
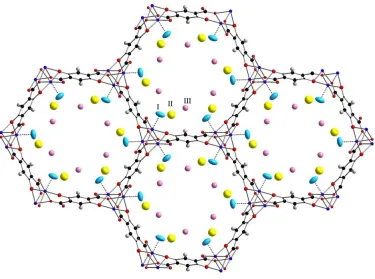
Upon further loading of deuterium, the model continues to fit the data extremely well (Fig. 1) and we can further identify two more adsorption sites, II and III, illustrated in figure 2, that are similar in location to those previously observed in M2(dobdc) MOFs using diffraction techniques (Table 4). Site II is more populated than site III, and we observe that site I has not completely saturated at this loading. The D2 to Ni2+ distance has decreased slightly and is now 2.17(2) Å, comparable to the closest distances observed for D2-Cu2+ (2.23(1) Å) in NOTT-11646 or D2-Fe2+ (2.17(5) Å) in Fe-BTT.49
To probe the site-specific binding properties of H2 further we used inelastic neutron scattering. In ideal H2, the molecules behave as three-dimensional quantum rotors with energy levels (EJ) determined as EJ = J(J + 1)B, where B is the rotational constant equal
to 7.35 meV and J is the rotational quantum number. The rotational transition from J = 0 to J = 1 is known as the para to ortho transition and occurs at an energy of 2B = 14.7 meV. Adsorption of H2 can create a barrier to the quantum rotation, resulting in a shift of the rotational lines away from 14.7 meV and can lift the degeneracy of the triplet J = 1 state, causing splitting of the 14.7 meV peak.50, 51
INS spectra for a range of p-H2 loadings after subtraction of the bare spectrum are shown in Fig. 3. At low loadings of 0.52 to 0.75 p-H2 molecules per nickel, there are
two regions of observable rotational lines centered at ≈6.8 and more distributed at ≈10 meV with additional features between 15 and 30 meV. While transitions in similar energy transfer regions have been observed in the INS spectra for the other members of the M2(dobdc) series the distribution at ≈10 meV is unusual. The lowest energy ≈7 meV peak, the ≈10 meV peak, and a strong peak at ≈30 meV have previously been assigned. From a combination of INS measurements, neutron diffraction, and confirmed through application of van der Waals corrected density functional theory calculations these were identified as transitions occurring from the J = 0 state to three sublevels of the split J = 1 rotational state. The series of weaker features between 15 meV and 25 meV would presumably arise from multiple rotation/vibration transitions. Upon higher p-H2
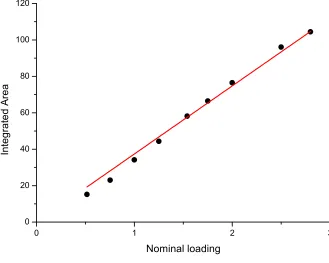
The low energy spectra ranging from neutron energy gain to neutron energy loss of ≈ -12 meV to 13 meV, respectively, have been reported previously with limited resolution (on a different spectrometer) for a loading of 0.5 and 1.0 H2 per Ni2+ and as a function of temperature.31 We have good agreement between the locations of these lowest rotational lines and those reported previously. An additional observation from this previous report was that there is a conversion of n-H2 to primarily p-H2 on cooling the sample from the dosing temperature of 70 K,31 stimulated presumably by fluctuation magnetic moments on the Ni2+ ion. This complication of conversion is potentially the cause of the distribution of peaks around 10 meV at low loadings. To ensure that we have not lost any hydrogen, we can integrate the entire spectrum of energy transfers, including the elastic line, which accounts for both the total scattering of the p-H2 and any converted o-H2. This data is plotted in figure 4 against the nominal loading value, and a clear correlation passing through the origin is observed, indicating that the total amount of hydrogen in the system is maintained, as expected.
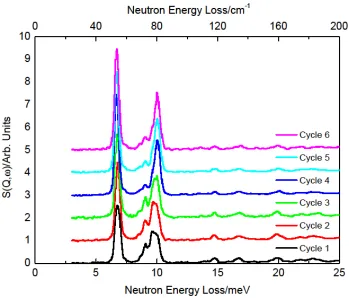
Further indications that there is ortho-para conversion were obtained by cycling the temperature of the cell with a loading of 1.1 n-H2. Figure 5 shows the results of measuring at 12 K after initially loading the sample at 120 K, and subsequently heating to 50 K and 70 K followed by cooling again. The low energy shoulder is still apparent in these spectra, and indicates that an equilibrium between o-H2 and p-H2 is obtained that due to the characteristics of the rapid cooling at low temperatures in this particular cryostat, are quenched down to the measuring temperature. There does not seem to be significant population of site II at this loading judging from the absence of any feature
center this necessarily must require another explanation perhaps due to adsorption at the second site or less likely the reduction in fluctuating moments on the Ni2+ ion.
Peak fitting the lowest energy rotational line to a Gaussian form allows the influence of the loading amount to be determined on this rotational transition (fig. 6). The peak position is slightly altered with loading shifting from 6.770(3) meV at the lowest loading to 6.878(3) meV at 1.25 p-H2:Ni2+. The rotational line then reduces in energy transfer to 6.668(2) at the highest loading of 2.8 p-H2:Ni2+. While the peak shift is subtle it does illustrate the effect of additional adsorption sites on the overall potential as the inner surface of the pores are gradually covered with H2 molecules. The location of the peak and extent of the shifts are much small than that observed in Fe2(dobdc) that is observed around 5 meV and shifts by as much as 1.4 meV with loading. The full-width at half-maximum for the Gaussian remains fairly constant over the loading range, while the area representing the sum of molecules contributing to this mode grows rapidly, saturating at about a loading of 1.5 p-H2.
While the assignments of modes in a pure p-H2 system should be relatively straightforward, it becomes more complicated for the second and third adsorption sites. A simple technique to reduce the magnitude and position of the rotational transitions for site I, is to use D2 as the adsorbed gas.20 The incoherent scattering cross section for D2 is about 20 times lower than H2, effectively making it transparent. The lower zero-point motion for D2 also ensures that it prefers the higher enthalpy adsorption sites allowing for the layering of p-H2 at the weaker second and third adsorption sites.20 This is illustrated in figure 7, using the FANS spectrometer. The p-H2 adsorbed at site I has a
clear spectrum with major peaks at ≈7 meV and ≈10 meV, as seen on TOSCA, with the third transition to the J=1 split manifold being around 33 meV. Smaller features between these primary rotational features can arise from rotations at secondary adsorption sites and combinations of rotations and phonon transitions. Further loading to 2.0 p-H2:Ni2+ adds intensity at around 10 meV, 15 meV, 18 meV and 20 meV, that should be assigned to site II and site III adsorption. Layering with deuterium, eliminates site I, allowing the identification of the ≈8 meV and ≈11 meV to be resolved (clearly
seen on TOSCA, fig 3) for site II, and ≈15 meV for site III. Definitive assignments of
other peaks are elusive, but we would tentatively assign a significant degree of multiple-rotation and overtones to those remaining.
We have determined the structural characteristics for hydrogen adsorption in the Ni2(dobdc) metal-organic framework using neutron powder diffraction. The Ni2+ member of the series exhibits the closest metal-D2 distance measured to date for the primary adsorption site. This distance is comparable with the shortest reported in the literature as may be expected for the high enthalpy for H2 adsorption in this system. The secondary adsorption sites are determined and located close to the framework oxygen and carbon, respectively. INS studies have revealed detailed interactions of the adsorbed para-hydrogen with the framework and there response to adsorption further H2. The adsorbed hydrogen interconverts between ortho and para hydrogen depending on the sample temperature. The transitions between rotational energy levels are determined for the three adsorption sites, with the transitions shifting slightly with increased adsorption levels.
References
[1] L. Schlapbach, A. Züttel, Nature, 414 (2001) 353.
[2] J.L.C. Rowsell, A.R. Millward, K.S. Park, O.M. Yaghi, J. Am. Chem. Soc. 126 (2004) 5666.
[3] J.L.C. Rowsell, O.M. Yaghi, Angew. Chem. Int. Ed. 44 (2005) 4670. [4] D.J. Collins, H.-C. Zhou, J. Mater. Chem., 17 (2007) 3154.
[5] L.J. Murray, M. Dincă and J.R. Long, Chem. Soc. Rev., 38 (2009) 1294.
[6] J. Yang, A. Sudik, C. Wolverton and D. J. Siegel, Chem. Soc. Rev., 39 (2010) 656. [7] S.K. Bhatia, A.L. Myers, Langmuir 22 (2006) 168.
[8] N.L. Rosi, J. Kim, M. Eddaoudi, L.B. Chen, M. O’Keeffe and O.M. Yaghi, J. Am. Chem. Soc. 127 (2005) 1504.
[9] P. D. C. Dietzel, Y. Morita, R. Blom and H. Fjellvåg, Angew. Chem. Int. Ed. 44 (2005) 6354.
[10] P. D. C. Dietzel, R. E. Johnson, R. Blom and H. Fjellvåg, Chem. Eur. J. 14 (2008) 2389.
[11] P. D. C. Dietzel, R. Blom and H. Fjellvåg, Eur. J. Inorg. Chem. 23 (2008) 3624. [12] S. Bhattacharjee, J. Choi, S. Yang, S.B. Choi, J. Kim and W. Ahn, J. Nanosci. Nanotechnol. 10 (2010) 135.
[13] W. Zhou, J. Wu and T. Yildirim, J. Am. Chem. Soc. 130 (2008) 15268.
[16] P.D.C. Dietzel, B. Panella, M. Hirscher, R. Blom, H. Fjellvåg, Chem. Commun., (2006) 959.
[17] W. Zhou, J. Wu and T. Yildirim, J. Am. Chem. Soc. 130 (2008) 15268.
[18] A.G. Wong-Foy, A.J. Matzger and O.M. Yaghi, J. Am. Chem. Soc. 128 (2006) 3494. [19] K. Sumida, C.M. Brown, Z.R. Herm, S. Chavan, S. Bordiga, and J.R. Long, Chem. Commun. 47 (2011) 1157.
[20] W.L. Queen, E.D. Bloch, C.M. Brown, M.R. Hudson, J.A. Mason, L.J. Murray, A.J. Ramirez-Cuesta, V.K. Peterson, and J.R. Long, Dalton Trans. 41 (2012) 4180.
[21] B. Chen, N. W. Ockwig, A. R. Millward, D. S. Contreras and O. M. Yaghi, Angew. Chem. Int. Ed. 44 (2005) 4745.
[22] M. Dinca, W.S. Han, Y. Liu, A. Dailly, C.M. Brown, and J.R. Long, J. Am. Chem. Soc. 128 (2006)16876.
[23] M. Dinca, A. Dailly, Y. Liu, C.M. Brown, D.A. Neumann, and J R. Long, Angew. Chem. Int. Ed. 46 (2007) 1419
[24] X. Lin, J. Jia, X. Zhao, K.M. Thomas, A.J. Blake, G.S. Walker, N.R. Champness, P. Hubberstey and M. Schröder, Angew. Chem. Int. Ed. 45 (2006) 7358.
[25] X. Lin, I. Telepeni, A.J. Blake, A. Dailly, C.M. Brown, J. Simmons, M. Zoppi, G S. Walker, K.M. Thomas, T.J. Mays, P. Hubberstey, N.R. Champness, and M. Schroder, J. Am. Chem. Soc. 131 (2009) 2159.
[26] S. Ma, H.-C. Zhou, J. Am. Chem. Soc. 128 (2006) 11734.
[27] B. Schmitz, U. Müller, N. Trukhan, M. Schubert, G. Férey and M. Hirscher ChemPhysChem. 9 (2008) 2181.
[28] J.G. Vitillo, L. Regli, S. Chavan, G. Ricchiardi, G. Spoto, P.D.C. Dietzel, S. Bordiga and A. Zecchina, J. Am. Chem. Soc. 130 (2008) 8386.
[29] C.M. Brown, Y. Liu, T. Yildirim, V.K. Peterson, and C.J. Kepert, Nanotechnology 20 (2009) 204025.
[30] Y. Liu, H. Kabbour, C.M. Brown, D.A. Neumann and C.A. Ahn, Langmuir 24 (2008) 4772.
[31]P.D.C. Dietzel, P.A. Georgiev, J. Eckert, R. Blom, T. Strässle and T. Unruh, Chem. Commun. 46 (2010) 4962.
[32] L. Kong, G. Román-Pérez, J. M. Soler and D. C. Langreth, Phys. Rev. Lett. 103 (2009) 096103.
[33] S.A. FitzGerald, K. Allen, P. Landerman, J. Hopkins, J. Matters, R. Myers, J.L.C. Rowsell, Phys. Rev. B 77 (2008) 224301.
[35] S.A. FitzGerald, B. Burkholder, M. Friedman, J.B. Hopkins, C.J. Pierce, J.M. Schloss, B. Thompson, J.L.C. Rowsell, J. Am. Chem. Soc. 133 (2011) 20310. [36] A.C. McKinlay, B. Xiao, D.S. Wragg, P.S. Wheatley, I.L. Megson, R.E. Morr is, R. E. J. Am. Chem. Soc. 130 (2008) 10440.
[37] H.J. Hinks, A.C. McKinlay, B. Xiao, P.S. Wheatley, R.E. Morris Microporous and Mesoporous Materials, 129 (2010) 330.
[38] A. C. Larson and R. B. Von Dreele, ‘General Structure Analysis System (GSAS)’,
Los Alamos National Laboratory Report LAUR, 1994, p. 86. [39] B. H. Toby, J. Appl. Crystallogr. 34 (2001) 210.
[40] T.J. Udovic, C.M. Brown, J.B. Leao, P.C. Brand, R.D. Jiggetts, R. Zeitoun, T.A. Pierce, I. Peral, J.R.D. Copley, Q. Huang, D.A. Neumann and R.J. Fields, Nuclear Inst. and Methods in Physics Research, A. 588 (2008) 406.
[41] S. F. Parker, C. J. Carlile, T. G. Pike, J. Tomkinson, R. J. Newport, C. Andreani, F. P. Ricci, F. Sacchetti and M. Zoppi, Physica B 154 (1998) 241.
[42] R.T. Azuah, L.R. Kneller, Y. Qiu, P.L.W. Tregenna-Piggott, C.M. Brown, J.R.D. Copley, and R.M. Dimeo, J. Res. Natl. Inst. Stan. Technol. 114 (2009) 241.
[43] S.J. Geier, J.A. Mason, E.D. Bloch, W.L. Queen, M.R. Hudson, C.M. Brown, and J.R. Long, Chem. Sci. 4 (2013) 2054.
[44] M. Märcz, R. E. Johnsen, P. D. C. Dietzel and H. Fjellvåg, Micropor. Mesopor. Mater. 157 (2011) 62.
[45] V.K. Peterson, Y. Liu, C.M. Brown, and C.J. Kepert, J. Am. Chem. Soc. 128 (2006) 15578.
[46] Y. Yan, I. Telepeni, S. Yang, X. Lin, W. Kockelmann, A. Dailly, A.J. Blake, W. Lewis, G.S. Walker, D.R. Allan, S.A. Barnett, N.R. Champness, M. Schröder, J. Am. Chem. Soc., 132 (2010) 4092.
[47] C.M. Brown, Y. Liu, D.A. Neumann, PRAMANA J. Physics 71 (2008) 755. [49] K. Sumida, S. Horike, S.S. Kaye, Z.R. Herm,W.L. Queen, C.M. Brown, F. Grandjean, G.J. Long, A. Dailly, and J.R. Long, Chem. Sci. 1 (2010) 184. [50] I.F.Silvera Rev. Mod. Phys. 52 (1980) 393.
[51] I.F. Silvera, M. Nielsen, Phys. Rev. Lett. 37 (1976) 1275.
[52] Y. Liu, C.M. Brown, D.A. Neumann, H. Kabbour and C.C. Ahn, in Life Cycle Anal ysis for New Energy Conversion and Storage Systems, ed. V.M. Fthenakis, A.C. Dillon a nd N.Savage, (Mater. Res. Soc. Symp. Proc., Volume 1041E, Warrendale, PA), 2008, 10 40-R2_03.
This research was partially supported by the Office of Energy Efficiency and Renewable Energy (EERE) through the Hydrogen and Fuel Cells Program. We thank Dr. Y. Liu for experimental assistance at NIST and M. Kibble and C. Goodway from ISIS for their help in gas loading experiments performed on TOSCA. REM thanks the EPSRC for funding (EP/K005499/1 and EP/K025112/1). REM is also a Royal Society Industry Fellow.
Table 1: Comparison of unit cell dimensions of M2(dobdc) series studied using neutron diffraction.
M2+ Cation: a (Å) c (Å)
Ni this work a = 25.797(1) c = 6.7505(4)
Mg19 a = 25.861(3) c = 6.9143(8)
Zn30 a = 25.887(3) c = 6.816(1)
Co43 a = 25.9067(9) c = 6.8548(5)
Fe20 a = 26.0983(5) c = 6.8512(2)
Mn43 a = 26.331(2) c = 7.0472(5)
Table 2: Rietveld Refinement results of Ni2(dobdc) measured at 4 K.
Goodness-of-fit parameters: χ2 = 1.44, Rp = 3.14 %, wRp = 3.95 %, wR
exp = 3.32 %.
Space group R-3; λ = 2.0782 Å; unit cell parameters: a = 25.797(1) Å, c = 6.7505(4) Å, and V = 3890.4(3)
Å3
Name X Y Z Ui*100 (Å2) Occ
Ni2 0.38025(24) 0.35135(27) 0.1440(6) 1.41(13) 1 O1 0.3323(4) 0.2990(4) 0.3708(15) 0.74(28) 1 O2 0.3021(5) 0.2263(4) 0.6116(14) 1.67(29) 1 O3 0.3623(4) 0.2780(4) 0.0081(15) 1.64(28) 1 C1 0.3201(4) 0.2476(4) 0.4310(13) 1.48(22) 1 C2 0.3276(4) 0.2074(4) 0.2907(12) 1.27(26) 1 C3 0.3456(4) 0.2239(4) 0.0775(12) 1.00(23) 1 C4 0.3511(4) 0.1805(5) -0.0285(14) 2.29(24) 1
[image:11.595.88.448.477.659.2]H4A 0.3729 0.193 -0.178 2.5 1
Table 3: Rietveld Refinement results of Ni2(dobdc) loaded with 0.5 D2:Ni measured at 4 K. Refined D2:Ni
0.505(10).
Goodness-of-fit parameters: χ2 = 1.31, Rp = 3.26 %, wRp = 4.06 %, wR
exp = 3.57 %.
Å3
Name X Y Z Ui*100 (Å2) Occ
Ni2 0.38039(29) 0.3522(4) 0.1441(9) 1.4(1) 1 O1 0.3293(5) 0.2944(5) 0.3716(18) 0.7(3) 1 O2 0.3005(6) 0.2263(6) 0.6000(17) 1.6(3) 1 O3 0.3623(6) 0.2745(5) 0.0130(20) 1.6(3) 1 C1 0.3199(5) 0.2494(5) 0.4254(17) 1.4(3) 1 C2 0.3268(5) 0.2068(5) 0.2909(16) 1.3(3) 1 C3 0.3449(5) 0.2205(5) 0.0654(17) 1.0(2) 1 C4 0.3501(6) 0.1779(6) -0.0186(16) 2.3(3) 1
H4A 0.3729 0.193 -0.178 2.5 1
D2 I 0.2071(6) -0.0169(6) 0.0694(20) 5.32* 1.01(2)
[image:12.595.89.448.122.325.2]*Uaniso D2 I = [U11,U22,U33,U12,U13,U23] = [3.7(9), 13(1), 5.9(9), 6(1), -0.7(7), -0.7(9)]
Table 4: Rietveld Refinement results of Ni2(dobdc) loaded with 1.5 D2:Ni measured at 4 K. Refined D2:Ni
1.53(3).
Goodness-of-fit parameters: χ2 = 1.76, Rp = 3.11 %, wRp = 3.77 %, wR
exp = 2.87 %.
Space group R-3; λ = 2.0782 Å; unit cell parameters: a = 25.800(1) Å, c = 6.7828(4) Å, and V = 3910.0(3)
Å3
Name X Y Z Ui*100 (Å2) Occ
Ni2 0.38102(28) 0.35095(30) 0.1442(8) 1.57(15) 1 O1 0.3271(4) 0.2967(4) 0.3598(16) 1.15(32) 1 O2 0.3013(5) 0.2259(5) 0.6074(16) 1.46(31) 1 O3 0.3598(5) 0.2731(5) 0.0066(19) 2.23(35) 1 C1 0.3171(5) 0.2457(5) 0.4256(13) 2.02(26) 1 C2 0.3274(5) 0.2061(5) 0.2886(14) 1.71(31) 1 C3 0.3456(4) 0.2225(4) 0.0754(14) 0.36(21) 1 C4 0.3528(5) 0.1817(5) -0.0303(13) 1.97(29) 1
H4A 0.3729 0.193 -0.178 2.5 1
D2 I 0.2054(4) -0.0201(4) 0.0774(13) 10.34* 1.62(2)
D2 II 0.4924(5) 0.1264(6) -0.0153(18) 10.4(5) 1.25(2)
D2 III 0.7467(33) 0.2432(34) 0.1100(101) 5(2) 0.18(1)
Fig. 1 Rietveld refinement of neutron powder diffraction data for Ni2(dobdc) measured at 4 K. Bottom,
middle and top panel are for the bare, 0.5 D2:Ni and 1.5 D2:Ni loadings, respectively. Green lines, crosses,
and red lines represent the background, experimental, and calculated diffraction patterns, respectively. The blue line represents the difference between experimental and calculated patterns, with allowed
reflections as pink tick marks. The data are scaled by a factor of 8 above ~17o to highlight the high Q
region.
20 40 60 80 100 120 140
2Theta 0
1104 2104
In
te
ns
it
y
0.5 D2:Ni x8
20 40 60 80 100 120 140
2Theta 0
1104 2104 3104
In te ns it y Bare x8
20 40 60 80 100 120 140
2Theta 0
1104 2104 3104 4104
In
te
ns
it
y
[image:13.595.121.386.169.435.2]Fig. 2 Ni2(dobdc) loaded with 1.5 D2 per Ni2+, viewed down the c-axis. Dark blue, black, and red spheres
represent Ni, C, and O atoms, respectively. Three D2 sites, determined by neutron powder diffraction, are
labelled as I (light blue), II (yellow), and III (pink) in decreasing order of binding strength. The closest
D2-framework interaction (drawn as dotted lines) is between the Ni and site I at 2.17(2) Å, with the best
[image:14.595.106.481.148.427.2]Fig. 3 INS spectra of p-H2 adsorbed in Ni2(dobdc) at loadings of (from bottom curve to top) 0.52, 0.75,
1.0, 1.25, 1.54, 1.75, 2.0, 2.5 and 2.8 p-H2 per Ni2+. Data are offset for clarity, with the top panel showing
[image:15.595.111.380.133.585.2]Fig. 4 Correlation of the total spectral weight (filled circles) with nominal p-H2 loading indicates a
conservation of total scattering intensity with hydrogen loading. The line is a linear fit to the data with a gradient of 50.7(9) (integrated area)/(nominal loading).
0 1 2 3
0 20 40 60 80 100 120
In
te
g
ra
te
d
A
re
a
[image:16.595.134.463.164.427.2]Fig. 5 Resulting hydrogen spectra (all measured at 12 K, background subtracted) for a loading of 1.1 n-H2
per Ni. Cycle 1 – initial load at 120 K; cycle 2 - heat to 50 K; cycle 3 – heat to 70 K; cycle 4 – heat to 120
K with slow cooling; cycle 5 – heat to 35 K adding helium to sample cell; cycle 6 – heat to 25 K keeping
[image:17.595.138.487.118.416.2]Fig. 6 Results of fits to Gaussian peak fitted to the lowest energy transfer rotational line. Top panel
[image:18.595.123.454.156.573.2]Fig. 7 Inelastic neutron scattering spectra obtained on the FANS spectrometer. These data have the bare
framework subtracted, for each loading, and are shifted relative to each other for clarity. The modes from
the first and second adsorption sites are easily identified without subtraction of the 1 p-H2 and 2 p-H2 per
Ni2+ by using the small cross-section of D2 as a buffer layer that essentially removes the scattering from
[image:19.595.110.462.250.500.2]Supplementary Materials
Supplementary Materials
Supplementary Materials