ISSN Online: 2160-0406 ISSN Print: 2160-0392
DOI: 10.4236/aces.2017.74033 Oct. 31, 2017 464 Advances in Chemical Engineering and Science
Experimental Investigation and Process
Optimization of Biodiesel Production from
Kusum Oil Using Taguchi Method
Rabiranjan Murmu
1,2, Harekrushna Sutar
1*, Sangram Patra
11Chemical Engineering Department, Indira Gandhi Institute of Technology, Sarang, India. 2Chemical Engineering Department, Indian Institute of Technology, Madras, India
Abstract
The paper focuses on biodiesel production from kusum oil using esterification reaction followed by transesterification reaction in an in-house batch reactor setup. The effects of methanol to oil ratio (M/O), catalyst amount (H2SO4 and
methodoxide) and reaction temperature on acid value and fatty acid methyl esters (FAME) is studied. Product has been analysed using FTIR spectroscopy technique for confirmation of ester group in biodiesel. Experimental data was optimized by Taguchi analysis to conclude the optimum variable affecting the response. In both processes M/O ratio has the significant effect for biodiesel production. The obtained biodiesel properties are close to commercial diesel fuel and may be rated as an alternative to conventional diesel. The biodiesel production will enhance the maximum utilisation of forestry or agricultural products.
Keywords
Kusum Oil, Biodiesel, Esterification, Transesterification, Taguchi Technique, Analysis of Variance
1. Introduction
All over the world demand of fuel is increasing because of the limited availability of fossil fuel resource and its increased usage. In the recent year net energy de-mand is expected to rise up to 4.8% per year. Increased consumption of fuels has an adverse effect to the environment. The limited availability of petroleum re-serves and the negative effects of exhaust gases from petro and petro derived products have forced us to search for new alternative sources. Various alterna-How to cite this paper: Murmu, R., Sutar,
H. and Patra, S. (2017) Experimental Investi-gation and Process Optimization of Biodiesel Production from Kusum Oil Using Taguchi Method. Advances in Chemical Engineering and Science, 7, 464-476.
https://doi.org/10.4236/aces.2017.74033
Received: September 19, 2017 Accepted: October 28, 2017 Published: October 31, 2017
Copyright © 2017 by authors and Scientific Research Publishing Inc. This work is licensed under the Creative Commons Attribution International License (CC BY 4.0).
DOI: 10.4236/aces.2017.74033 465 Advances in Chemical Engineering and Science tive fuels like biogas, producer gas, ethanol, methanol and biodiesel are consi-dered [1]. Nowadays biodiesel is chosen as a potential fuel because of its less polluting nature than the conventional diesel [2]. Many researchers work dedi-catedly to use vegetable oil derived fuels in existing diesel engines. But use of raw vegetable oils is restricted in diesel engine due to their unfavorable physical properties, particularly their viscosity [3]. Due to higher viscosity of the vegeta-ble oil it causes poor fuel atomization, incomplete combustion, carbon deposi-tion and diludeposi-tion of lubricating oil on the internal combusdeposi-tion engine [4]. Im-portant methods by which oil and fats are converted to biodiesel are pyrolysis, blending, micro-emulsions and transesterification [5]. The best method by which fatty acid of crude vegetable oil is converted to its ester is known as tran-sesterification [6]. Biodiesel has similar properties to that of diesel produced from crude oil. It is biodegradable, can be used in existing engines without mod-ifying and it produces less harmful gas like sulphur dioxide [7][8][9]. But use of edible oil as a raw material for the production of biodiesel is not survived on global fuel market because of its high price. The most important alternative re-source for biodiesel production is non-edible oil which is not used for human consumption and could get bulk quantity by means of agricultural or forestry product. Non-edible oils are unsuitable for human consumption because of the presence of toxic compounds. Non-edible resource has the potential to replace conventional edible resource for biodiesel production [10]. However most of the non-edible oils have high free fatty acid (FFAs) contents, which increase the cost of biodiesel production [11].
The botanical name of kusum is Schleichera oleosaand it appears greenish, larger to medium sized and 35 to 55 ft in height [12]. Its growth mainly occurs in sub Himalayan tracts in the north, central parts of eastern India. The flowers come from February to April and yields fruit in June and July. The Seeds are round in shape with 1.5 cm in diameter and weighingbetween 0.5 and 1.0 g. The weight of 1000seeds is 500 - 700 g. The fruits are berry, globoseor ovoid, and hard skinned berrywith a pointed tip and Size is (1.25 - 2.5) × (1.1 - 1.8)cm; one cell contains 1 or 2 irregularly ellipsoidal slightly compressed seeds with a thick brown seed coat. The seeds are brown, irregularly elliptic, slightly compressed, oily, enclosed in a succulent aril. The brown seed coat is brittle and breaks at a slight pressure to expose a “U” shape kernel [13] [14]. Kusum oil is extracted from the kernel of kusum seed. The fatty acid profile suggests that it has 40% unsaturated fatty acids and 53% saturated fatty acids. Because of the high degree of saturation it has better oxidative stability. Because of the presence of less free fatty acid content, kusum oil has a potential to use feedstock for biodiesel pro-duction. Constant effort should be made by all stake holders for large scale cul-tivation of kusum tree in India and for production of biodiesel a competitive price[15].
DOI: 10.4236/aces.2017.74033 466 Advances in Chemical Engineering and Science biodiesel production. The work focuses on the reaction parameters that affect conversion of FFAs from raw kusum oil and fatty acid methyl easter (FAME) yield in transesterification process. In pretreatment process, reaction between oil and methanol was carried out with the presence of acid catalyst. For transesteri-fication process a base catalyst is used. The main objective was to analyze the experimental data in Minitab-14 to understand the relationships between the va-riables (methanol-to-oil ratio, catalyst concentration and reaction time) and the response (acid value after pretreatment and FAME yield).
2. Materials and Methods
[image:3.595.200.539.496.736.2]Kusum oil is obtained from the kernel of kusum tree (Schleichera oleosa), which is collected from Mayurbhanj district, Odisha. The unrefined but filtered crude kusum oil is greenish yellow in colour. Fatty acid profile of kusum oil is given in
Table 1. The fatty acid profile tests are conducted as per the conventional me-thods in our laboratory. Its FFA content was determined by a standard titrimetry method [16]. This oil had an initial acid value of 13 mg KOH/g corresponding to a FFA level of 8%, which is far above the 1% limit for satisfactory transesterifica-tion reactransesterifica-tion using alkaline catalyst. Because of its less free acid content, it was preferred more compared with other vegetable oil. Therefore, FFAs were first converted to esters in a two-step pretreatment process using an acid catalyst (H2SO4 4% v/v) to reduce the acid value of kusum oil below 2 mg KOH/g.
Expe-riments were conducted in a laboratory-scale setup.
2.1. Experimental Set up
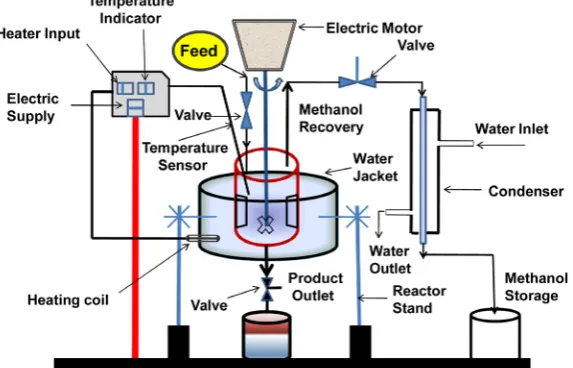
Biodiesel production was carried out in a custom built esterification set up shown in Figure 1. It consists of a batch reactor supported with iron stand. Oil
Table 1. Fatty acid profile of kusum oil and properties comparison.
FATTY ACID PROFILE OF KUSUM OIL PROPERTIES COMPARISION
Sl. No. Fatty Acid Percent Properties Measured Kusum Oil Biodiesel Diesel
1 Myristic acid (C14:0) 0.01 Flash Point (˚C) 268 70 68 2 Palmitic acid (C16:0) 7.59 Fire Point (˚C) 275 75 73
3 n − 7 Palmitic oleic acid (C16:1) 1.80 (redwood second) Viscosity 121 71 67
4 n − 9 cis Oleic acid (C18:1) 2.83 Pour Point (˚C) 12 −4 −6
5 n − 6 Translinoleic acid (C18:2) 49.69 (Mg KOH/g) Acid Value 13 0.46 0.35
6 n − 3 alpha-linoleic acid (C18:3) 0.26 Calorific Value (MJ/kg) 38 42 45
DOI: 10.4236/aces.2017.74033 467 Advances in Chemical Engineering and Science
Figure 1. Experimental set up for biodiesel production.
sample, ethanol and catalyst is fed to the inlet of reactor. To maintain the desired temperature of the reactant sample, water filled jacketed vessel was used. Heating of the water in a jacketed vessel was done by electric heater. For perfect mixing of fluid in a reactor, agitator is rotated in a constant speed of 600 rpm. Temperature of the reactant sample can be checked by temperature sensor on a continuous in-terval of time. To enhance the rate of mixing of reactant mixture baffle ware fitted in the reactor. Product sample ware collected on bottom of the reactor. The vola-tile product (methanol) is collected on the top of reactor outlet. Then it was sent to methanol recovery tower consisting of a vertical condenser. The methanol was collected from the condenser and it can be stored. The bottom product of the batch reactor consists of FAME and glycerol. It makes of two immiscible layers and can be separated based on their density difference. The bottom layer consists of glycerol and top layer was biodiesel (FAME). Then the biodiesel (FAME) was be separated and washed with distilled water for several times to get pure biodiesel (FAME). Glycerol is more valuable than biodiesel, which can be stored.
2.2. Pretreatment
DOI: 10.4236/aces.2017.74033 468 Advances in Chemical Engineering and Science hour. In pretreatment process two important things was observed. When acid catalyst concentration exceed more than 4% product appear black. Simulta-neously esterification and transesterification reaction will be carried out and some amount of FAME produced.
2.3. Transesterification
The transesterification reaction was carried out with different methanol-to-oil ratios (v/v) (0.25, 0.30. 0.35), Methoxide as an alkaline catalyst w/v (5, 7, 9) and reaction temperature (55˚C, 65˚C, 75˚C). The reaction was carried out at 65˚C for half an hour. Again the effect of methanol-to-oil, reaction temperature and catalyst concentration on production of FAME yield can be studied by statistical method. Biodiesel can be separated from the two phase glycerol-FAME (Biodie-sel) mixture. The fuel properties namely, density, kinematic viscosity, flash point, pour point, water content, ash content, carbon residue, acid value and ca-lorific value of kusum oil, kusum biodiesel and conventional diesel were deter-mined as per the standards prescribed by ASTM for comparison with the latest American and European standards [16][17].
3. Statistical Analysis
3.1. Design of Experiments (DOE)
Design of Experiments (DOE) is one of the important and powerful statistical techniques to study the effect of multiple variables simultaneously and involves a series of steps which must follow a certain sequence of experiment to yield an improved understanding of process performance as reported by Taguchi G (1990). In the present work Taguchi’s parameters design approach is used to study the effect of operating parameters on the acid value and yield of fatty acid methyl ester (FAME).
3.2. Selection of Orthogonal Array
Taguchi method which combine the experiment design theory and the quality loss function concept has been used in developing robust design of products in process and in the solving of sum taxing problems of manufacturing. The selec-tion of orthogonal array depends on 3 items in order of priority, viz. The num-ber of factors and their interactions, numnum-ber of levels for the factors and the de-sired experimental resolution or cost limitation. In this research 27 experiments were conducted at different parameters. For this Taguchi L27 orthogonal array was used, which has 27 rows corresponding to the number of tests with 3 col-umns at 3 levels. The layout of L27 orthogonal array is shown in Figure 2.
DOI: 10.4236/aces.2017.74033 469 Advances in Chemical Engineering and Science
Figure 2. Layout of orthogonal array.
Table 2. Pretreatment process design.
Factors A B C
LEVEL 1 0.25 2 55
LEVEL 2 0.33 4 67
LEVEL 3 0.40 6 75
Table 3. Transesterification process design.
Factors A B C
LEVEL 1 0.25 5 55
LEVEL 2 0.30 7 65
LEVEL 3 0.35 9 75
4. Results and Analysis of Experiment
4.1. Product Characterization
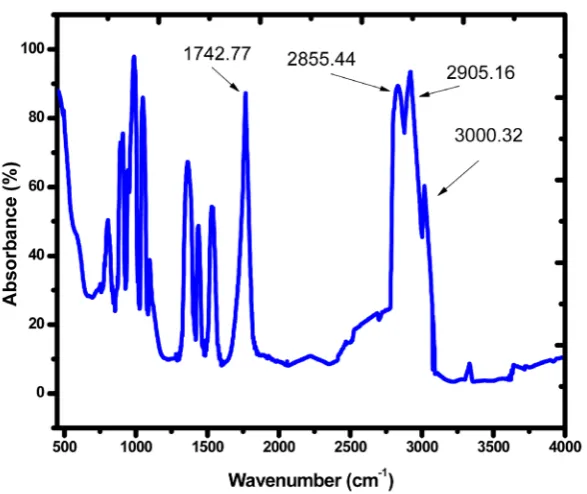
The biodiesel produced was undergone a FTIR spectroscopy analysis. Absorp-tion peaks are listed in Table 4 and strong peaks (1742.77, 2855.44, 2905.16 and 3000.32 cm−1) are shown in Figure 3.
4.2. Taguchi Treatment Process
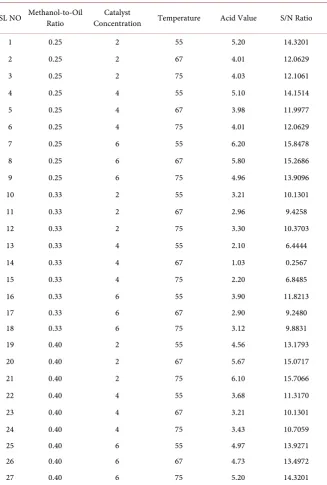
The L27-OA and response values for acid value and FAME yield are shown in
Table 5 and Table 6. From the response Table 7 for signal to noise ratio, it was found that methanol-to-oil ratio has the highest influence on acid value followed by catalyst concentration and reaction temperature. From the response Table 8
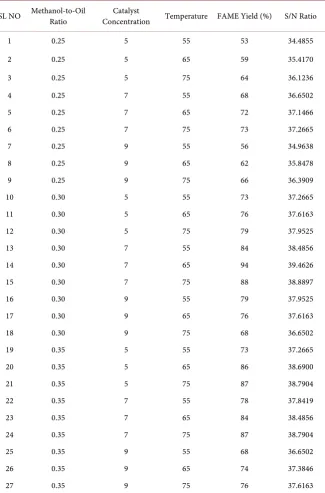
for signal to noise ratio, it was found that methanol-to-oil ratio has the highest influence on FAME yield followed by catalyst concentration and reaction tem-perature.
DOI: 10.4236/aces.2017.74033 470 Advances in Chemical Engineering and Science
Figure 3. FT-IR Spectroscopy of produced biodiesel.
Table 4. Absorption peaks of biodiesel.
Wavenumber, cm−1 Assigned group
3310.23 −OH
3000.32 =C-H
2905.16 −CH2
2855.44 −CH2
1742.77 −C=O
1461.63 −CH2
1350.18 −CH3
1180.41 −C-O-C
1017.63 −C-O-C
722.85 −CH2
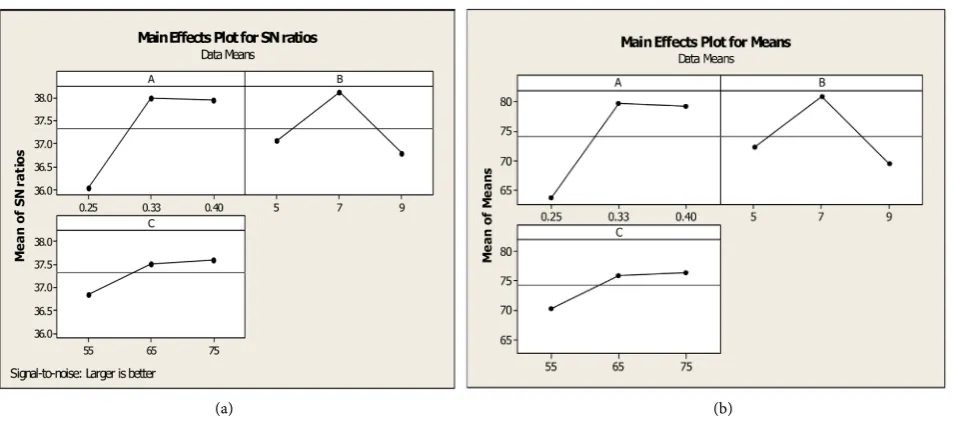
decreased and remains constant for further increase in methanol-to-oil ratio. It was observed that the yield of FAME increased from 0.25 to 0.33. However, the FAME yield was at its lowest value at 0.25 M/O ratio.
It was observed that acid value was decreased from 2 to 4, and then it was in-creased. The FAME yield was increased from 5 to 7, and then the FAME yield was drastically decreased for further increase in catalyst (B) concentration.
[image:7.595.208.538.364.540.2]DOI: 10.4236/aces.2017.74033 471 Advances in Chemical Engineering and Science
Table 5. L27-OA response values and S/N ratio for acid value.
SL NO Methanol-to-Oil Ratio Concentration Catalyst Temperature Acid Value S/N Ratio
1 0.25 2 55 5.20 14.3201
2 0.25 2 67 4.01 12.0629
3 0.25 2 75 4.03 12.1061
4 0.25 4 55 5.10 14.1514
5 0.25 4 67 3.98 11.9977
6 0.25 4 75 4.01 12.0629
7 0.25 6 55 6.20 15.8478
8 0.25 6 67 5.80 15.2686
9 0.25 6 75 4.96 13.9096
10 0.33 2 55 3.21 10.1301
11 0.33 2 67 2.96 9.4258
12 0.33 2 75 3.30 10.3703
13 0.33 4 55 2.10 6.4444
14 0.33 4 67 1.03 0.2567
15 0.33 4 75 2.20 6.8485
16 0.33 6 55 3.90 11.8213
17 0.33 6 67 2.90 9.2480
18 0.33 6 75 3.12 9.8831
19 0.40 2 55 4.56 13.1793
20 0.40 2 67 5.67 15.0717
21 0.40 2 75 6.10 15.7066
22 0.40 4 55 3.68 11.3170
23 0.40 4 67 3.21 10.1301
24 0.40 4 75 3.43 10.7059
25 0.40 6 55 4.97 13.9271
26 0.40 6 67 4.73 13.4972
27 0.40 6 75 5.20 14.3201
4.3. Analysis of Variance (ANOVA)
From the Table 9, it was observed that the major controlling parameter for acid value was methanol-to-oil ratio followed by catalyst concentration and interac-tion parameter (A*B). Hence methanol-to-oil ratio was the major process para-meter to be considered in this process due its significance influence.
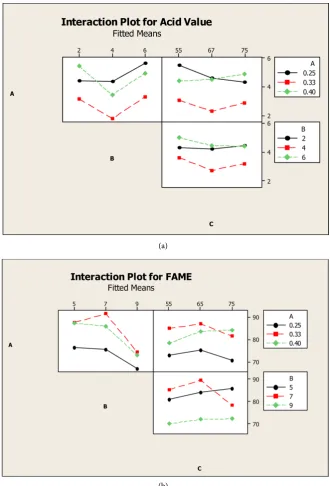
The interaction graphs are shown in the above figure. It is observed from the
DOI: 10.4236/aces.2017.74033 472 Advances in Chemical Engineering and Science
Table 6. L27-OA response values and S/N ratio for FAME yield.
SL NO Methanol-to-Oil Ratio Concentration Catalyst Temperature FAME Yield (%) S/N Ratio
1 0.25 5 55 53 34.4855
2 0.25 5 65 59 35.4170
3 0.25 5 75 64 36.1236
4 0.25 7 55 68 36.6502
5 0.25 7 65 72 37.1466
6 0.25 7 75 73 37.2665
7 0.25 9 55 56 34.9638
8 0.25 9 65 62 35.8478
9 0.25 9 75 66 36.3909
10 0.30 5 55 73 37.2665
11 0.30 5 65 76 37.6163
12 0.30 5 75 79 37.9525
13 0.30 7 55 84 38.4856
14 0.30 7 65 94 39.4626
15 0.30 7 75 88 38.8897
16 0.30 9 55 79 37.9525
17 0.30 9 65 76 37.6163
18 0.30 9 75 68 36.6502
19 0.35 5 55 73 37.2665
20 0.35 5 65 86 38.6900
21 0.35 5 75 87 38.7904
22 0.35 7 55 78 37.8419
23 0.35 7 65 84 38.4856
24 0.35 7 75 87 38.7904
25 0.35 9 55 68 36.6502
26 0.35 9 65 74 37.3846
27 0.35 9 75 76 37.6163
Table 7. Response table of S/N ratio for acid value.
Level A B C
1 13.525 12.486 12.349
2 8.270 9.324 10.773
3 13.095 13.080 11.768
Delta 5.255 3.756 1.576
[image:9.595.206.540.616.736.2]DOI: 10.4236/aces.2017.74033 473 Advances in Chemical Engineering and Science
Table 8. Response table of S/N ratio for FAME yield.
Level A B C
1 36.03 37.07 36.84
2 37.99 38.11 37.52
3 37.95 36.79 37.61
Delta 1.96 1.33 0.77
[image:10.595.59.541.221.592.2]Rank 1 2 3
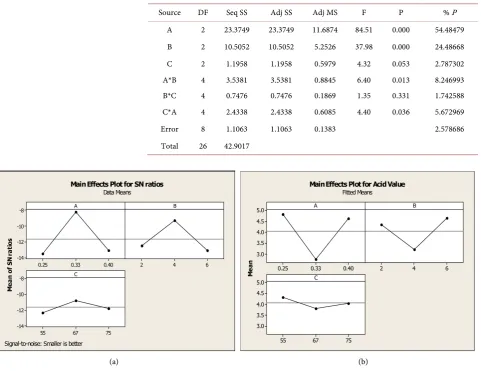
Table 9. ANOVA table for acid value.
Source DF Seq SS Adj SS Adj MS F P % P
A 2 23.3749 23.3749 11.6874 84.51 0.000 54.48479 B 2 10.5052 10.5052 5.2526 37.98 0.000 24.48668 C 2 1.1958 1.1958 0.5979 4.32 0.053 2.787302 A*B 4 3.5381 3.5381 0.8845 6.40 0.013 8.246993 B*C 4 0.7476 0.7476 0.1869 1.35 0.331 1.742588 C*A 4 2.4338 2.4338 0.6085 4.40 0.036 5.672969
Error 8 1.1063 1.1063 0.1383 2.578686
Total 26 42.9017
(a) (b)
Figure 4. Main effects plot for (a) SN ratios, (b) data mean for acid value.
output performance, but its interaction with factor A has significant contribu-tion on minimizacontribu-tion of acid value. On the other hand the interaccontribu-tion of B*C has least contribution on acid value.
DOI: 10.4236/aces.2017.74033 474 Advances in Chemical Engineering and Science (a) (b)
Figure 5. Main effect plot for (a) SN ratios, (b) data mean for FAME yield.
Table 10. Analysis of variance for FAME yield, using adjusted SS for tests.
Source DF Seq SS Adj SS Adj MS F P % P
A 2 1494.52 1494.52 747.26 69.63 0.000 53.99141 B 2 641.41 641.41 320.70 29.88 0.000 23.17174 C 2 213.41 213.41 106.70 9.94 0.007 7.709704 A*B 4 174.81 174.81 43.70 4.07 0.043 6.31523 B*C 4 51.98 51.98 12.98 1.21 0.378 1.877843 A*C 4 106.15 106.15 26.54 2.47 0.128 3.834802
Error 8 85.85 85.85 10.73 3.101439
Total 26 2768.07
The interaction graphs are shown in Figure 6(b). It was observed the interac-tion between A*B shows major contribuinterac-tion on FAME yield. Although the factor B individually has relatively high significant effect on output performance, but its interaction with factor C has least contribution on FAME yield.
5. Conclusion
[image:11.595.207.540.328.469.2]DOI: 10.4236/aces.2017.74033 475 Advances in Chemical Engineering and Science (a)
[image:12.595.209.540.70.557.2](b)
Figure 6. Interaction plot for (a) Acid value (b) FAME yield.
(75˚C) under proper agitation. This work is a portfolio to future researchers to find out the performance of the produced biodiesel in two stroke engines.
References
[1] Om, V., Steven, P. and Harvey, S. (2010) Sustainable Biotechnology: Sources of Re-newable Energy. Springer, Netherland.
DOI: 10.4236/aces.2017.74033 476 Advances in Chemical Engineering and Science
on Non-Edible Oils as Biofuels. IISc, Bangalore.
[3] Bankovic, I.B., Stamenkovic, O.S. and Veljkovic, V.B. (2012) Biodiesel Production from Non-Edible Plant Oils. Renewable and Sustainable Energy Reviews, 16, 3621-3647. https://doi.org/10.1016/j.rser.2012.03.002
[4] Moser, B.R. (2009) Biodiesel Production, Properties, and Feedstocks. In Vitro Cel-lular & Developmental Biology-Plant, 45, 229-266.
[5] Srivastava, A. and Prasad, R. (2000) Triglycerides-Based Diesel Fuels. Renewable and Sustainable Energy Reviews, 4, 111-133.
https://doi.org/10.1016/S1364-0321(99)00013-1
[6] Ma, F. and Hanna, M.A. (1999) Biodiesel Production: A Review. Bioresource Tech-nology, 70, 1-15. https://doi.org/10.1016/S0960-8524(99)00025-5
[7] Janaun, J. and Ellis, N. (2010) Perspectives on Biodiesel as a Sustainable Fuel. Re-newable and Sustainable Energy Reviews, 14, 1312-1320.
https://doi.org/10.1016/j.rser.2009.12.011
[8] Gerpen, J.V. (2005) Biodiesel Processing and Production. Fuel Process Technology, 86, 1097-1107.https://doi.org/10.1016/j.fuproc.2004.11.005
[9] Leung Dennis, Y.C., Wu, X. and Leung, M.K.H. (2010) A Review on Biodiesel Pro-duction Using Catalyzed Transesterification. AppliedEnergy, 87, 1083-1095.
https://doi.org/10.1016/j.apenergy.2009.10.006
[10] Giakoumis, E.G., Rakopoulos, C.D., Dimaratos, A.M. and Rakopoulos, D.C. (2012) Exhaust Emissions of Diesel Engines Operating under Transient Conditions with Biodiesel Fuel Blends. Progress in Energy and Combustion Science, 38, 691-715.
https://doi.org/10.1016/j.pecs.2012.05.002
[11] Leung, D.Y.C., Wu, X. and Leung, M.K.H. (2010) A Review on Biodiesel Production Using Catalyzed Transesterification. Applied Energy, 87, 1083-1095.
https://doi.org/10.1016/j.apenergy.2009.10.006
[12] Palanuvej, C. and Vipunngeun, N. (2008) Fatty Acid Constituents of Schleichera oleosa (Lour.) Oken Seed Oil.Journal of Health Research, 22, 203e212.
[13] Acharya, S.K., Mishra, A.K., Rath, M. and Nayak, C. (2011) Performance Analysis of Karanja and Kusum Oils as Alternative Bio-Diesel Fuel in Diesel Engine. Interna-tional Journal of Agricultural and Bio Engineering, 4, 23.
[14] Sharma, Y.C. and Singh, B. (2010) An Ideal Feedstock, Kusum (Schleichera triguga) for Preparation of Biodiesel: Optimization of Parameters. Fuel,89, 1470-1474.
https://doi.org/10.1016/j.fuel.2009.10.013
[15] Kumar, N. and Pali, H.S. (2013) Kusum Oil as a Potential Fuel for CI Engines. In-ternational Conference on Alternative Fuels for I. C. Engines (ICAFICE), Priya Tech Publication Private Ltd, Jaipur, India.