Walter Kucharczyk 1 Adrian P. Crawley2 W. M. Kelly3 R. Mark Henkelman2
Received August 10,1987; accepted after revi-sion January 6, 1988.
Presented in part at the annual meeting of the American Society of Neuroradiology, New York
City, May 1987.
This work was supported by the National Cancer Institute of Canada and General Electric.
1 Department of Radiology, University of To-ronto, Toronto General Hospital, ToTo-ronto, Canada M4X 1K9.
2 Department of Medical Biophysics, University of Toronto, Toronto General Hospital and Ontario Cancer Institute, 500 Sherbourne St., Toronto, Canada M4X 1 K9. Address reprint requests to R. M. Henkelman.
3 Department of Radiology, University of Califor-nia, San Francisco, CA 94143.
AJNR 9:443-451, May/June 1988 0195-6108/88/0903-0443
© American Society of Neuroradiology
443
Effect of Multislice Interference on
Image Contrast in T2- and
T1-Weighted MR Images
Multislice imaging markedly degrades the contrast of T2-weighted MR images as the separation between slices is reduced. Image contrast was measured clinically at 1.5 T and experimentally at 0.15 T as a function of interslice gap width and shown to be in agreement with calculations based on known relaxation times and excitation profiles. Thus, the cause of T2 contrast degradation in multi slice sequences is demonstrated. Contrast in T1-weighted sequences is shown to be minimally affected or even slightly enhanced. Selective excitation pulses with better spatial definition will diminish these contrast changes. Since perfect slice profiles can never be achieved, the clinical implications of these findings are discussed for MR imaging.
The choice of slice gaps is an important operator-selected parameter in reducing contrast degradation in T2-weighted sequences.
It is desirable with any tomographic technique to be able to acquire contiguous slices so as not to exclude substantial amounts of tissue from the imaged volume. Unfortunately, the acquisition of contiguous slices in multislice MR imaging can lead to substantial degradation of image contrast and Signal due to interslice interference, particularly on T2-weighted sequences with long TRs and long TEs [1-3]. Figure 1 illustrates this contrast degradation by comparing a long TR/long TE single-slice image with an image of the same location from a contiguous multislice acquisition with the same parameters. In the multislice image, the signal-to-noise ratio (SNR) is clearly decreased and the contrast is degraded.
Selective excitation pulses with better slice definition minimize this contrast degradation. A number of alternative and significantly improved excitation pulses have been described [4-9]. However, from a fundamental pOint of view, slice profiles must always have finite transition regions; that is, they can never be perfectly rectangular. The goal of contiguous and nonoverlapping slices therefore remains an unachievable ideal. Partial-volume effects also depend on the slice profile, and can lead to contrast degradation [10]. Partial volumes affect both single-slice and multislice images, and therefore are not considered in this article.
It is the purpose of this article to explain the origin of the contrast degradation in T2-weighted sequences and to show how it arises from slice interference. Quantitative agreement between experimental measurements and detailed calcu-lations demonstrate the validity of the explanation. It is further shown that the same mechanism that leads to contrast degradation in T2-weighted sequences has less effect on contrast in short TR/short TE (T1-weighted) sequences. Finally, the implications of these findings for clinical MR are discussed.
Subjects and Methods
Clinical Study
444
KUCHARCZYK ET AL. AJNR:9, May/June 1988A
B
side lobe on each side and filtered with a Hanning filter. The width of the 180° pulse was twice that of the 90° pulse. Multiple T2-weighted
2000/70/2 (TRtTE/excitations) imaging sequences were performed by using a 128 x 256 matrix and a 20-cm field of view. Slice thickness was maintained at 5 mm full-width-at-half-maximum throughout. A single-slice location was obtained through the basal ganglia followed by successive multislice imaging sequences altering only the gap width (100%, 50%, 20%, 10%, and 0% of slice thickness) with each
acquisition. Regions of interest were defined in the frontal white matter, the caudate head, and the frontal horn. Signals from these
regions of interest were plotted as a function of gap width. SNRs and contrast-to-noise ratios (CNRs) were calculated and graphed. T1
-weighted images (600/20/2) were obtained in an identical fashion.
Phantom Study
The quantitative demonstration that contrast degradation is caused by multi slice interference could be done at any field strength. A
0.15-T resistive imager was chosen because the slice definition had been
well characterized [11]. Even though the gaussian selective pulses
[11) gave somewhat inferior slice definition than that obtained in the
clinical studies, similar slice interference effects are evident in each imager.
A phantom consisting of eight vials of different concentrations of
aqueous manganese chloride solution was imaged with a 0.15-T
resistive imager. The concentrations of manganese chloride and their associated T1 and T2 relaxation times measured at the same field
strength with a spectrometer are given in Table 1. Imaging was performed by using T2-weighted 1000/60 and T1-weighted 300/28
sequences.
A slice thickness of 1 cm full-width-at-half-maximum was used
throughout. Single-slice and multislice images were recorded; a
vari-ety of slice spacings was used, ranging from 0.7 cm (significant slice overlap) through to 2 cm (corresponding to 1-cm gaps). The multislice
sequence acquired five slices, but in all cases only the center slice was evaluated. The RF excitation pulses were gaussian in shape, truncated at ±2 SD. The 90° pulse had a duration of 4 msec and the 180° pulse had a duration of only 2 msec, yielding a broader inversion profile than the 90° pulse slice excitation profile. All slices were acquired within a single TR. The order of acquisition was such that first all odd-numbered slices were acquired in order, then all even-numbered slices.
Fig. 1.-T2-weighted cardiac-gated images, 2000/70, 5-mm slice thickness. Single slice (A)
and central slice from a series of seven contig-uous slices (B). Both images have the same
window and level settings.
TABLE 1: Relaxation Times of Different Vials of Manganese Chloride
Concentration of Relaxation Time Manganese Chloride (msec)
(ILM) T1 T2
50 938 458
100 545 246
200 318 131
300 226 91
400 185 67
500 148 54
600 127 45
800 94 34
Note.-Relaxation times were measured at 0.15 T and have an accuracy of ±2% for T1 and ±5% for T2.
Results
Clinical Study
Figures 2A-2F show marked degradation of SNR and CNR on T2-weighted images as the interslice spacing was reduced
from 100% to 0%. Quantitative measures of SNR and CNR are shown in Figure 3 (a and b). CNR is defined conventionally as signal difference divided by mean signal divided by noise. The greatest reduction in signal was in tissue with the largest T1: CSF, followed by gray matter; the least reduction was in signal from white matter. From the perspective of diagnostic interpretation arising from visual perception, the CNR is the
most important. For each pair of tissues of interest, there is a 60-75% reduction in the CNR in reducing from a 100% gap
to a 0% gap. The degradation is sufficiently severe that the
caudate nuclei cannot be discriminated as distinct structures. The T1-weighted images are shown in Figures 2G-2L, and
[image:2.612.56.397.82.248.2] [image:2.612.316.557.316.435.2]AJNR:9, MaylJune 1988 MUL TISLICE INTERFERENCE 445
tissues but negligible change in the CNR, with satisfactory contrast between gray or white matter and CSF maintained at even a 0% gap. In these T1-weighted sequences there is negligible contrast between gray and white matter, since the increased recovery of magnetization from the shorter T1 of white matter is largely offset by the reduced mobile proton density evident in the white matter. Although it is difficult to demonstrate quantitatively, the ability to differentiate the cau-date nuclei visually is lost with contiguous slices.
Phantom Study
Figure 4 shows a pair of T2-weighted images taken with a single-slice sequence (Fig. 4A) and a five-slice sequence with contiguous slices (Fig. 4B). As was shown in Figure 1, the contrast is degraded in the multislice sequence. The overall signal intensity is also reduced owing to slice interference.
Figure 5 shows plots of signal as a function of slice spacing for the T2- and T1-weighted sequences. The results corre-spond to five of the sample vials, which span appropriately the range of clinical T1 and T2 values obtained at this fre-quency. As the slice spacing decreases from 2.0 cm (well-separated slices) down to 0.7 cm (overlapping slices) the signal intensities decrease and move toward a single value showing that the contrast is degraded. As shown in Figure 5, a T1-weighted sequence shows a similar decrease in intensity but no degradation of contrast.
In the next section, a theoretical explanation of the contrast behavior caused by multislice interference is given. The re-sults of the theoretical calculations are shown as solid lines in Figure 5, and are clearly in good agreement with the measured data pOints.
Discussion
Explanation of the Contrast Behavior
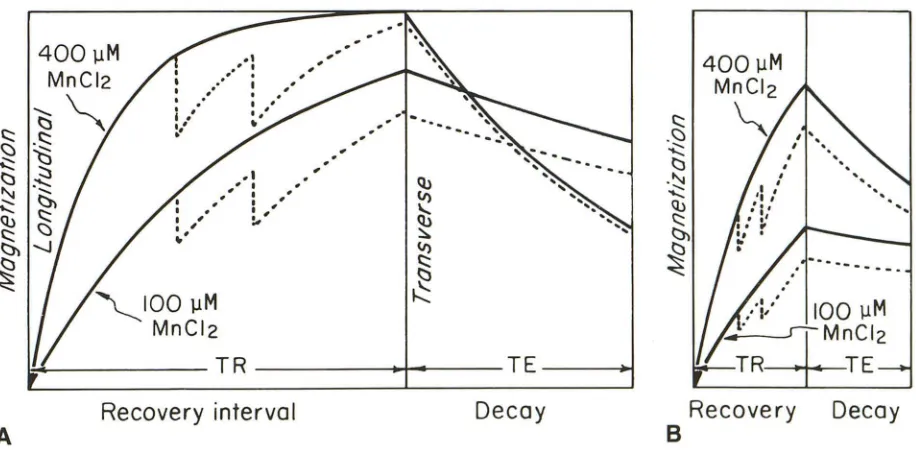
As has been stated by others [2, 3], the contrast changes observed in multislice images as the slices are brought closer together arise from slice interference. The effect on image contrast in T2- and T1-weighted sequences can be appreci-ated qualitatively in Figure 6.
Figure 6A shows a composite representation [12] of the recovery of longitudinal magnetization and transverse decay for two different samples in a single-slice T2-weighted se-quence. During the 1000-msec TR interval, both samples attain almost full longitudinal recovery. However, because the T2 values are quite different, the signal of the short T2 sample decays away during the time elapsed for echo formation (60-msec TE). Thus, the contrast in this imaging sequence is primarily derived from tissue differences in T2, leading to the designation T2 weighted.
However, in multi slice sequences, there may be loss of recovered longitudinal magnetization owing to interference from excitation pulses for adjacent slices applied during the TR recovery phase. This situation is illustrated in Figure 6A,
where partway through the recovery phase 25% of the lon-gitudinal magnetization is lost on two occasions due to inter-ference of the excitation pulses of the two adjacent slices. The long T1 sample is unable to recover full longitudinal magnetization during the TR interval. In fact, the partial inter-ference from the adjacent slices effectively reduces the TR interval. Thus, during echo formation, the persistent long T2 sample begins with a reduced longitudinal magnetization and hence achieves a final signal intensity comparable to the short T2 sample. Qualitatively, this is the mechanism whereby interference between slices reduces the contrast in T2-weighted sequences.
Figure 6B shows a similar illustration for the T1-weighted sequence. In this sequence it is the short T1 sample that recovers most of its longitudinal magnetization during the short TR recovery phase. Since the TE time is comparatively shorter, the T2 decay of the short T2 sample has less time to develop, and hence the final contrast is still dominated by the T1 recovery. Thus, a short TRjshort TE sequence is designated as T1-weighted, although in most practical ex-amples the contrast is determined by a combination of both T1 and T2 as well as by effective proton density, as has been reported before [13]. When there is interference from adjacent slices during the recovery period, the total longitudinal recov-ery is diminished for both samples and the signal intensity at the time of the echo is decreased by an almost constant amount for both samples. Thus, the relative contrast for simple tissues is slightly increased in T1-weighted sequences owing to multislice interference.
The qualitative explanation of how interslice interference leads to degraded contrast on T2-weighted sequences and enhanced contrast T1-weighted sequences can be made quantitative by exact calculations performed with experimen-tally determined RF excitation profiles [11, 14]. Figure 7 shows the excitation profiles that have been measured for the 900 and 1800 pulses used in the phantom experiment. The excitation profile is a plot of transverse magnetization as a function of distance through the slice. By plotting the profiles for contiguous slices, it can be seen that slices i - 1, i
+
1,and i - 2 have excitation profiles that overlap with the ith slice. Thus, a complete calculation considers interference from a couple of adjacent slices on each side of the slice of interest. The calculation is performed as a function of distance perpen
-dicular to the slices.
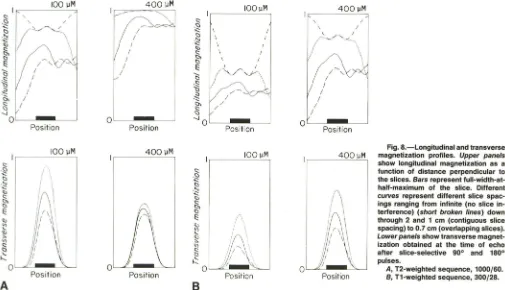
Figure 8A shows the resulting magnetization profiles for the T2-weighted sequence. The upper panels show the lon
-gitudinal magnetization that exists just before the excitation of the slice of interest. The lower panels show the transverse magnetization measured at the time of the echo. The left-hand panels are for the 100-J.LM manganese chloride solution and the right-hand panels are for the 400-J.LM solution. Differ-ent curves correspond to differDiffer-ent slice spacings, and infinite slice spacing is included to show the profiles of the longitudinal magnetization when there is no slice interference. Thus, the W-shaped curve in the upper left panel of Figure 8A corre-sponds to the residual saturation of the longitudinal magnet
446
KUCHARCZYK ET AL. AJNR:9, May/June 1988A
B
c
D
E
F
Fig, 2.-Multislice spin-echo images through basal ganglia. Window, level, and receiver attenuation are the same in each image.
A-F, T2-weighted images, 2000/70, show a progressive degradation of signal- and contrast-to-noise. A is single-slice acquisition for comparison.
Inters lice spacing: 100% (B), 50% (C), 20% (D), 10% (E), and 0% (F).
G-L (next page), T1-weighted images, 600/20, are less affected by decreasing the interslice gap. G is single-slice image. Inters lice spacing: 100% (H),
50% (/), 20% (J), 10% (K), and 0% (L). .
heavily saturated sample, the recovery from the previous excitation is complete, and so the infinite slice spacing occurs at full longitudinal magnetization. As the neighboring slices are moved closer, their interference begins to encroach on the longitudinal magnetization. This interference diminishes the intensity of the longitudinal magnetization that is available for excitation by the slice of interest (the ith slice). Also, for overlapping slices with a spacing of 0.7 cm, encroachment of the i - 2 slice from the left is evident in the longitudinal magnetization. This asymmetry arises from the fact that the i - 2 slice precedes the ith slice, but the i
+
2 slice is subse -quenttoit.The lower panels show the slice profiles that are extracted
from the longitudinal magnetization by the selective 900 and 1800
pulses for the ith slice. The profiles show a comparatively uniform and approximately gaussian shape, with the differ -ences in amplitude for a given sample determined by the available longitudinal magnetization. For very narrow slice spacings with overlap (0.7 cm), there is some shift of the peak position to the right owing to interference from the i - 2 slice. An integration over the transverse magnetization profiles in the lower panels is used to obtain the signal intensities and hence the theoretical curves shown in Figure 5.
[image:4.612.59.568.85.490.2]AJNR:9, May/June 1988 MUL TISLICE INTERFERENCE 447
G
H
parallel to that given for Figure 8A. Theoretical curves derived from Figure 88 are shown in Figure 5. The calculated lines in Figure 5, which make use of the measured relaxation times of the various samples and the measured slice excitation profiles, show excellent agreement with the experimentally measured contrasts. Thus, it can be concluded that a com-plete picture of multislice interference effects on contrast has been achieved.
It is clear from the preceding analysis that better slice definition using more precisely defined selective excitation pulses [4-9] for both the 900 and 1800 excitations will
dimin-ish the contrast degradation evident on T2-weighted se-quences. It will also reduce any slight contrast enhancement on T1-weighted sequences as seen in Figure 5, but this will
be more than offset by the overall increase in signal obtained with diminished interference.
Clinical Implications
[image:5.614.54.561.82.534.2]neurora-448
KUCHARCZYK ET AL. AJNR:9, May/June 198860~---'---(~o~1
- - - _C,2.F
40
20
GM
WM
....
, ,,
Q:: 0
~60~======~====~ lei
WM
90~0~---5~0~---~0
~
'-'1.o. - -- - - , - ---.(
c:-b"l
CSF/WM
0.5 ...
~.s.~~
.
~
.
~
..
...
~
__ G_M/WM ... .
- -------_..:, .....
0 1.0
WMiCSF
.... G·fViIC'SF·
0.5
WM/GM o
100
Idl
---50
o
Gop widlh (%1
Fig. 3.-Quantitative presentation of signal-(SNR) and contrast-to-noise (CNR) ratios for tissues imaged in Figure 2. On T2-weighted sequences (a and b), both SNR and CNR decrease as gap width is reduced. For T1-weighted sequences, SNR (c) decreases with reduced gap, but CNR (d) shows little change. GM
=
gray matter; WM=
white matter.diology, but the principles can be applied to the imaging of other parts of the body as well.
T2-Weighted Images
T2-weighted images are commonly used for the examina-tion of the brain, particularly as screening sequences [15]. They are a sensitive detector of disease in patients with a variety of neurologic problems and are also valuable in con-firming or excluding lesions suspected on CT scans. The primary objective in selecting the most appropriate protocol for a T2-weighted imaging sequence is to achieve high
lesion-to-brain contrast. Without adequate contrast the lesion may go undetected. Excluded volumes and imaging times are secondary considerations and need to be adjusted to fit specific clinical problems.
For example, to clarify a subtle but relatively large low-density area in the temporal lobe on CT, good MR contrast is required, but it is not necessary to cover every millimeter of tissue. Therefore, the scan could be obtained with large gaps (50% or 100%) to yield good contrast and without a repeated interleaving scan to fill in the gaps. Contiguous cuts could result in nondefinitive visualization (negating the
pur-Fig. 4.-lmages of a phantom, con-sisting of vials with differing
concentra-tions of manganese chloride, at 1000/ 60. The concentrations of manganese chloride in the vials are (top to bottom, left column first): 50, 100, 200, 300, 400,
500, 600, and 800 I'M, respectively. A, Single-slice acquisition. B, The same slice from the center of
a multislice acquisition consisting of
[image:6.612.57.299.82.298.2] [image:6.612.56.515.407.723.2]~
.;;;
<:;:
~
.~ OL--L ____ -L ____ ~ ____ ~ ____ ~ ____ ~L_ _ _ _ _ L_~
(:;
<:;: 1.0 B T l Weighted
~
0.5
OL-~ __ ~L-__ - L ____ ~ ____ L -_ _ ~ _ _ _ _ -L~
2.0 1.8 1.6 1.4 1.2 1.0 0.8 Slice spacing(cm)
Fig. 5.-Signal intensity plotted for five sample vials as a function of slice spacing. Data points are experimental measurements; Solid lines show theoretical calculations.
A, T2-weighted sequence, 1000/60.
B, T1-weighted sequence, 300/28.
.1
,':
""
:,'
:.'
, ,
.
,..
-.
-'.
pose of the study), whereas a second interleaved scan would unnecessarily double imaging time. On the other hand, if the suspicious area were small, interleaving would be the best and possibly only way to image the area adequately and establish a diagnostic opinion despite the cost in imaging time.
If T2-weighted images are to be the primary method of investigation (that is, if CT had not been performed previ-ously), it is most important to minimize the false-negative rate. It follows that good image contrast must be achieved and that no tissue, or little tissue, should be excluded from the imaged volume. Both these objectives can be achieved by using two interleaved sequences to maintain T2-weighted contrast and to cover the whole volume. One option is not to interleave but to insert a gap large enough to maintain good contrast but within clinically acceptable gap dimensions. We have chosen this latter option. We review an initial T2-weighted sequence performed with 5-mm-thick slices and a 50% gap. If no lesion is seen, the gaps are filled with a second identical, but shifted sequence. If the lesion is seen with the initial sequence, additional planes or different sequences are obtained if required.
The evaluation of the maturational state of the infant brain is another interesting application of these principles. The infant
brain contains a substantially higher percentage of water than does the adult brain. With commonly used T2-weighted 2000/ 70-100 sequences, gray- white-matter discrimination is poor.
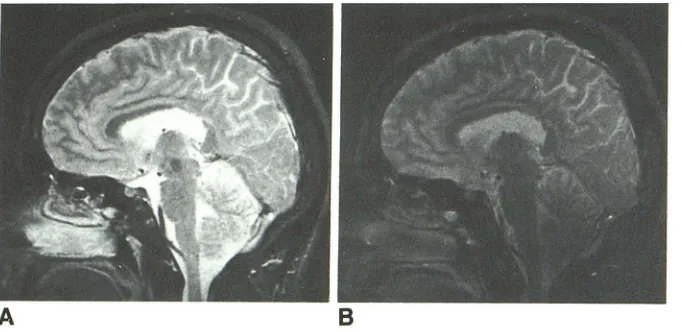
It has been shown that improved contrast can be achieved by using much longer TRs (3500) and TEs (160) to compen-sate for the substantially longer T1 relaxation of the infant brain [16]. Similar results can be achieved by introducing larger gaps (e.g., 100%) at only a marginally longer TR of 2500 msec (Fig. 9). The large spacing is not anatomically significant because it is the general pattern that is of diagnos-tic interest. The contrast of other long T1 structures such as cysts can be similarly improved.
1::4---
T R - - - . - - ' - - - - TE
- - - . IRecovery interval
Decay
A
Recovery
B
Decay
Fig. 6.-A, Evolution of magnetization as a function of time for two tissues. Recovery of longitudinal magnetization over a TR interval of 1000 msec is
on the left. The decay of transverse magnetization after the 90° pulse is shown over an expanded time scale for TE=60 msec on the right. Solid lines
represent the situation with no slice interference and dotted lines show the effect of the 25% reduction in longitudinal magnetization due to interference
from adjacent slices. Diminished T2 contrast from slice interference is evident.
B, T1-weighted sequence, 300/28. Solid lines represent no slice interference; dotted lines correspond to a 25% reduction in the longitudinal magnetization
[image:7.612.56.298.50.404.2] [image:7.612.80.538.457.682.2]450
KUCHARCZYK ET AL. AJNR:9, May/June 1988Slice number
Slice profiles
90° i-I
ISO° i-I
900i+1
ISOOi+1
900
i-2
i-2 i-I i+1
~
I '0~
~ ;~,
, I
/\0:
~
v
:
~
I '
:~
~
:,I I
I
I I
I
~
'IISooi-2 ;
I I , I I I
~
I I~
::
I I I I
900i
ISOOi
[image:8.612.88.266.76.365.2]I
Fig. 7.-Plot of 90° and 180° excitation profiles as a function of position perpendicular to the slices in a contiguous multi slice sequence shows regions of interference on the ith (i) slice by slices i - 1, i + 1, and i - 2.
Slice profiles were measured experimentally. FUIl-width-at-half-maximum is 1 cm and is represented by the bar for the ith slice. (Adapted from [11].)
I 100 ~M 400~M
c:::
,
/.~
,
/ c:::..:::: .~
~ I ..::::
.
..::::-.
I ~ \~
<U I \
§, / §, <U
~ /
E:: / ~
E::
(s / ...
.C::: ~
is .C:::
~ i5 ~
.~ .~
c::: I:h
~ c:::
"
~0 0 " 0
T1-Weighted Images
Typical spin-echo T1-weighted images display the interface between brain and CSF spaces very well, but contrast within the brain is often poor unless inversion recovery is used. For this reason typical T1-weighted images are excellent for eval-uating extraaxial disease (because these lesions border on CSF spaces) but poor for evaluating lesions intrinsic to the brain.
The detection and determination of the extent of acoustic neuromas is a good example of a common use of T1-weighted images. These tumors are often very small (requiring contig-uous or near-contigcontig-uous images) and are located in the internal auditory canal or cerebellopontine angle surrounded
by bone or CSF. Even though CNR for brain/CSF diminishes
as gaps narrow, there remains high contrast even at zero gap width. Therefore, this particular area should be imaged with a thin-section contiguous slice typical of the T1-weighted
sequence.
Conclusions
In conclusion, we have shown that contrast degradation in
multislice T2-weighted images arises from slice interference.
We have shown that detailed calculations of the interference
effects account quantitatively for experimentally measured signal intensities. Explained simply, image contrast decreases to full intensity in a long TR sequence. Slice interference,
therefore, introduces an intensity dependence on differential
T1 relaxation that interferes with the desired T2-weighted contrast.
100~M 400 ~M
I I I I
,
\ / IPosition Position Position 0' - - 'Position - - -- - '
100~M 400~M
c::: .~ ..:::: ~ .~ <U c::: I:h ~ E:: <U ~ ~ V) §
h::
0 0
Position Position
A
c:::
.~
..::::
~ ~ <U
§, ~ E:: <U ~ <U ::.. V) c::: ~ ~ 0
8
100~M
'"
Position
Fig. 8.-Longitudinal and transverse
400 ~M magnetization profiles. Upper panels
, - - ---'--=--=--=.., show longitudinal magnetization as a function of distance perpendicular to the slices. Bars represent
fUIl-width-at-Position
half-maximum of the slice. Different curves represent different slice
spac-ings ranging from infinite (no slice in-terference) (short broken lines) down
through 2 and 1 cm (contiguous slice
spacing) to 0.7 cm (overlapping slices). Lower panels show transverse magnet-ization obtained at the time of echo after Slice-selective 90° and 180°
pulses.
A, T2-weighted sequence, 1000/60.
[image:8.612.53.558.452.742.2]AJNR:9, May/June 1988 MUL TIS LICE INTERFERENCE 451
Fig, 9.-Multislice axial sections of brain of 3-month-old baby.
A, 100% gap between slices, 2500/160.
B, 20% gap, 3500/160. Despite 40% longer i m-aging time, signal-to-noise ratio and contrast are both inferior in B.
A
On T1-weighted sequences, the same mechanism can lead
to a slight increase in contrast in phantom studies, although
with an associated decrease in signal intensity and therefore
a net reduction in CNR. In clinical studies, no contrast
en-hancement is observed for important neurologic tissues.
Changes in contrast due to slice interference can be
re-duced with more precisely defined selective pulses.
Nonethe-less, perfectly rectangular excitation profiles cannot be
achieved with finite excitation times, and thus there will remain
MR applications where it is preferable to perform multislice
acquisitions with gaps equal to the slice thickness followed by a second acquisition to fill in the gaps.
ACKNOWLEDGMENTS
We thank Scott Hinks for preparing the phantom and measuring the relaxation times, Theresa Saunders for preparing the manuscript,
and Roger Smith and Jonathon Wallace for many volunteer hours in the imager.
REFERENCES
1. Feinberg DA, Crooks LE, Hoeninger JC, et al. Contiguous thin multisection
MR imaging by two-dimensional Fourier transform techniques. Radiology
1986;158:811-817
2. Fitzsimmons JR, Googe RE. Multi section-multi echo MR imaging: effect
on image quality. Radiology 1985;157:813-814
B
3. Kneeland JB, Shimakawa A, Wehrli FW. Effect of intersection spacing on
MR image contrast and study time. Radiology 1986;158:819-822
4. Silver MS, Joseph RI, Hoult DI. Highly selective ,,/2 and" pulse generation. J Magn Reson 1984;59:347-351
5. O'Donnell M, Adams WJ. Selective time-reversal pulses for NMR imaging.
Magn Reson Imaging 1985;3:377-382
6. Murdoch JB, Lent AH, Kritzer MR. Computer-optimized narrowband pulses for multi-slice imaging. J Magn Reson 1987;74:226-263
7. Conolly S, Nishimura D, Macovski A. Optimal control solutions to the
magnetic resonance selective excitation problem. IEEE Trans Med Imag
1986;5(2}:106-115
8. Yan H, Gore JC. Improved selective 1800 radiofrequency pulse for m
ag-netization inversion and phase reversal. J Magn Res 1987;71:116-131
9. Ngo JT, Morris PG. General solution to the NMR excitation problem for noninteracting spins. Magn Reson Med 1987;5:217-237
10. Young IR, Bryant DJ, Payne JA. Variations in slice shape and absorption as artifacts in the determination of tissue parameters in NMR imaging.
Magn Reson Med 1985;2:355-389
11. Crawley AP, Henkelman RM. A stimulated echo artifact from slice interfer
-ence in MRI. Med Phys 1987;14(5}:842-848
12. Sprawls P, Steinbruegge C. Contrast optimization in magnetic resonance imaging (abstr). Med Phys 1986;13:584
13. Henkelman RM, Hardy P, Poon PY, Bronskill MJ. An optimal MRI sequence
for imaging hepatic metastasis. Radiology 1986;161 :727-734
14. Joseph PM, Axel L, O'Donnell M. Potential problems with selective pulses
in NMR imaging systems. Med Phys 1984;11 :772-777
15. Brant-Zawadzki M, Norman D, New10n TH, et al. Magnetic resonance of
the brain: the optimal screening technique. Radiology 1984;152:71-77
16. Nowell MA, Hackney DB, Zimmerman RA, Bilaniuk L T, Grossman HI,
Goldberg HI. Immature brain: spin-echo pulse sequence parameters for