warwick.ac.uk/lib-publications
Original citation:
Muggleton, Naomi K. and Fincher, Corey L. (2018) You're not my type : do conservatives
have a bias for seeing long-term mates? Evolution and Human Behavior .
doi:10.1016/j.evolhumbehav.2018.06.009
Permanent WRAP URL:
http://wrap.warwick.ac.uk/104815
Copyright and reuse:
The Warwick Research Archive Portal (WRAP) makes this work by researchers of the
University of Warwick available open access under the following conditions. Copyright ©
and all moral rights to the version of the paper presented here belong to the individual
author(s) and/or other copyright owners. To the extent reasonable and practicable the
material made available in WRAP has been checked for eligibility before being made
available.
Copies of full items can be used for personal research or study, educational, or not-for-profit
purposes without prior permission or charge. Provided that the authors, title and full
bibliographic details are credited, a hyperlink and/or URL is given for the original metadata
page and the content is not changed in any way.
Publisher’s statement:
© 2018, Elsevier. Licensed under the Creative Commons
Attribution-NonCommercial-NoDerivatives 4.0 International
http://creativecommons.org/licenses/by-nc-nd/4.0/
A note on versions:
The version presented here may differ from the published version or, version of record, if
you wish to cite this item you are advised to consult the publisher’s version. Please see the
‘permanent WRAP url’ above for details on accessing the published version and note that
access may require a subscription.
You’re Not My Type: Do Conservatives Have a Bias for
Seeing Long-Term Mates?
INaomi K. Muggleton, Corey L. Fincher∗
Department of Psychology, University of Warwick, Coventry, CV4 7AL, UK
Abstract
When choosing a mate, humans favour genetic traits (attractiveness, high sex drive) for short-term relationships and parental traits (warmth, high status) for long-term relationships. These preferences serve to maximise fitness of future offspring. But this model neglects the role of social norms in shaping evolved mating strategies. In conservative cultures, individuals are likely to face costs such as punishment for short-term mating. Here we show that conservatives over-perceive some mates’ suitability as long-term partners. Study 1 found that conservatives were less likely to use a short-term strategy that was dis-tinctive from their long-term strategy. Study 2 showed that conservatives over-perceived hypothetical mates as long-term investing partners, despite their lack of commitment-compatible traits. Conservatism was measured at the regional-(India, USA, UK) and individual-level. Our results demonstrate how social norms may bias behaviour to reduce costs. We anticipate our findings to be a starting point for more sophisticated models, drawing on developments from evolutionary and social psychology.
Keywords: mate choice, conservatism, behavioural ecology, cross-cultural
psychology, sex differences
1. Introduction
What traits do humans seek in a sexual partner? Should we expect a sim-ilar answer from a British college student and a middle-aged individual from Sudan? For decades, evolutionary and social psychologists have been inter-ested in the traits that men and women desire in a sexual or romantic partner. Because human evolution has been shaped as much by social interactions as immunological diseases, a cultural view of psychology should play a central role in an evolutionary account of mating behaviour. Here, we investigate the role of cultural norms in shaping evolved mating strategies. Specifically, we ask: (a)
IWord count: 7963 words
∗Corresponding author
whether individuals from conservative backgrounds moderate their preferences by avoiding short-term mating, even when, potentially, the benefits to offspring outweigh the costs, and (b) what mechanisms support this bias.
1.1. Evolved Mate Preferences
According to evolutionary psychologists, successive generations of early hu-mans faced recurrent problems when choosing a suitable partner. Specifically, ancestral men and women would trade-off between mates offering genetic and parental quality (Pillsworth & Haselton, 2006; Gangestad & Simpson, 2000). As such, humans have developed two distinctive mating strategies. For short-term relationships, individuals favour genetic traits that signal fertility, such as physical attractiveness and high sex drive (Li & Kenrick, 2006; Pillsworth & Haselton, 2006; Regan et al., 2000). For long-term relationships, however, indi-viduals prioritise material traits, such as emotional warmth, wealth, and high social status (Gangestad & Simpson, 2000; Li et al., 2002; Regan et al., 2000).
The trade-off between genetic and parental quality is shaped further by eco-logical factors, such as historical levels of disease and resource scarcity, which influence fitness outcomes for offspring. For example, when rates of infectious disease are high, it would be prudent to favour mates with symmetrical faces, as symmetry is highly correlated with immunological functioning (Trivers et al., 1999; Thornhill, 1997). Additionally, when women’s economic independence is low, they should favour men with wealth and high status (Stanik & Ellsworth, 2010; Lu et al., 2015). Cross-cultural research has also shown that people from countries with a low average birth rate, high infant mortality, higher parasite stress, or shorter life expectancy are less likely to engage in uncommitted sex-ual behaviour (Schmitt, 2002; Schaller & Murray, 2008; Thornhill et al., 2010; Muggleton & Fincher, 2017).
Although there has been substantial focus on how environmental factors shape mate preference, previous research has typically focussed on an individ-ual’s motivation to maximise the fitness of offspring. However, most individuals will take into account factors that are indirectly related to their own fitness, such as the attitudes of their parents, society, and other potential mates. Further-more, sex with multiple or unfamiliar partners can result in the transmission of many pathogens, including sexually transmitted infections, making uncommit-ted sex particularly risky when disease prevalence is high. As such, there could be opportunities where individuals should avoid uncommitted sex with mates with a high good genes value because the potential benefits to offspring may be outweighed by social costs, such as punishment for promiscuous behaviour, which can reduce the residual reproductive value.
1.2. Social Benefits of an Evolved, Long-Term Mate Bias
and a social backlash (Baumeister & Twenge, 2002; Brehm, 1966; LaFree et al., 2009). This, by definition, would undermine social cohesion. Alternatively, a more adaptive approach would be for individuals to internalise the norms of the group, by means of a bias. It could be, for example, a cognitive, learning, or cultural bias, but we are agnostic about the form this bias should take.
At first glance, biases can be viewed as violations of rational choice, and thus an evolutionary maladaptation. Economic utility theory, philosophical reasoning, and conventional wisdom dictate that humans who are rational in their decision-making should outperform those who demonstrate bias. However, in some social situations biases can result in improved decision-making. Just as a smoke detector is attuned to prioritise safety (i.e., minimise false-negatives, even if this maximises the number of false-positives) over accuracy (minimise error rate overall), evolution has selected for psychological responses that maximise human survival (Nesse, 2005; Schaller & Park, 2011). In this view, biases, instead of designflaws, are designfeatures (Haselton et al., 2015).
Similar logic could apply to individuals’ perception of long-term mates. Con-sider this: social groups differ in the extent to which they are conservative. Conservative social norms dictate that individuals should be chaste; violation of these norms can result in malicious gossip, reputation damage, or honour killings (Ghanim, 2015; Hartung, 2012; Mayeda & Vijaykumar, 2016; Flood, 2013). A potentially adaptive bias could be an internalisation of social norms surrounding chastity, which results in an over-perception of a mate’s suitability as potential long-term partners. In conservative groups, for example, the cost of a false positive (e.g., over-perceiving the risks of promiscuity) could lead to a missed opportunity to mate with a high quality mate. However, the cost of a false negative (e.g., failing to detect the risks of promiscuity) could result in social ostracism. Thus, in conservative contexts, individuals may demonstrate a bias that promotes social conformity to long-term mating. However, in liberal groups, where the costs of short-term mating are lower, individuals can benefit from engaging in distinctive mating strategies, by favouring short-term mating with good genes mates, but long-term mating with good parent or good provider mates.
We propose a theoretical model where personal and societal levels of conser-vatism predict the likelihood of a long-term mate bias. In all societies, humans can benefit from engaging in short-term mating. Benefits include increased offspring fitness, opportunities for mate poaching, mate worth feedback, and immediate access to resources (Greiling & Buss, 2000; Meston & Buss, 2009; Smuts, 1992). However, the costs of engaging in short-term mating are mod-erated by social norms in a given ecology. If the social group is tolerant of short-term mating, the potential payoff of mating with good genes mates is rel-atively high. However, if the social group is conservative, the potential payoff of short-term mating is diminished.
will-ingness to engage in short-term mating (Schmitt, 2005; Muggleton & Fincher, 2017; Thornhill et al., 2009), which could lead to costly punishment. However, the present report seeks to test empirically whether individuals from conserva-tive groups over-perceive prototypically short-term mates as potential long-term mates.
To test this proposition, we selected two relatively liberal regions (UK and USA) and one conservative region (India). The three regions also differ in mean number of sexual partners (UK: 9.8; USA: 10.7; India: 3.0) and one-night stands (UK: 52%; USA: 50%; India: 13%). Indians are also more likely to encourage young people to abstain from intercourse until they are married (49%, vs. UK: 6%; USA: 14%) (Durex Sexuality Study, 2005). As such, we might expect that Indian mating strategies are influenced by more conservative social norms and a higher likelihood of punishment. To account for potential confounds at the regional level (e.g., GDP, religion), we also measured conservatism at the individual level.
1.3. The Present Research
We propose that conservatives have a bias for seeing long-term mates. Al-though prior research has demonstrated that conservatives possess distinctive short- and long-term mate preferences, displaying a short-term strategy may prove costly in conservative groups. As such, an adaptive response could be a bias that promotes long-term mate preferences, even under ecological conditions where - in some societies - a short-term mating strategy is adaptive. From this, four predictions emerge.
In Study 1, we predict that liberals will demonstrate stronger, more dis-tinctive preferences for short- and long-term mates, relative to conservatives (Prediction 1). Central to this proposition is the prediction that conservatives avoid a distinctive short-term strategy as a mechanism to maintain traditional social norms. In conservative cultures, short-term mating could threaten tra-ditional values, which poses a greater societal risk to conservative than liberal cultures (Roos et al., 2015). To test this assumption directly, we investigated whether an individual’s motivation to conserve traditional values promotes con-vergent short- and long-term strategies. We predicted that adherence to tradi-tional norms should negatively predict the distinctiveness between short- and long-term preferences (Prediction 2).
The purpose of our report was to investigate whether conservatives are less prone to demonstrate distinctive short- and long-term sexual strategies, rela-tive to liberals. In Study 1, we examined whether participants from the USA and UK (liberal regions) demonstrated more distinctive short- and long-term preferences than Indian participants (conservative region). We also investi-gated whether this was associated with a drive to maintain traditional values of chastity. Study 2 directly investigated whether conservatives over-perceived a mate’s suitability as potential long-term partner.
2. Study 1
2.1. Introduction
Study 1 investigated whether conservatives were less likely to adopt a dis-tinctive short-term mating strategy. We also investigated the potential causes for regional differences by testing whether short-term mating strategies are pre-dicted by an individual’s motivation to preserve traditional norms. Participants constructed their ideal short- and long-term mates by spending 30 Mate Dollars on 12 traits.
2.2. Method
2.2.1. Participants
To maximise statistical power, we conducted a power analysis based on Mug-gleton & Fincher (2017). Our analysis indicated that, to obtain the recom-mended statistical power 1−β=.80 atα=.05 (Cohen, 1988), our study would requireN ≥70 per condition. Post hoc tests revealed that our observed power was≥.81 for all key tests (pwr; Champely, 2017).
We recruited 527 participants from India, the UK, and US (women = 254; men = 273) in a Prolific Academic (PA) study. PA is an online crowdsourcing tool that produces data of a quality comparable with Amazon Mechanical Turk (Peer et al., 2017). All participants were aged 18-73 (M = 33.31;SD= 10.26), heterosexual, and reported that they were fluent in English. Participants were financially reimbursed for their time.
2.2.2. Design
In a mixed-factorial design, Nationality (USA, UK, India), Sex (male, fe-male), and Tradition scores were the between-subject factors. Trait (good genes, good parent, good provider) and Context (short-term, long-term) were the within-subject factors. The dependent variable was the proportion of Mate Dollars spent on each Trait.
Development The instrument was based on the Women’s Mate Prefer-ence Questionnaire (WMPQ), a 12-item measurement that was translated from Chinese to English (Lu et al., 2015). However, to account for potential mistrans-lations (Muggleton & Fincher, 2017), we chose to validate the questionnaire for an English-speaking sample by developing the Mate Preference Inventory (MPI). Participants rated a list of 30 mate traits, based on the long version of the WMPQ, which was translated by Lu et al. (2015) from Chinese to English.1 For this development of the MPI, 151 heterosexual women from the USA were recruited in a PA study. All participants were aged 18-44 years (M = 30.46;
SD = 6.94). Participants were presented with a list of 30 mate traits (Table S1, Supplemental Materials) and asked to rate how much they valued each item in a short-term, then term, partner. Presentation of the short- and long-term questionnaires was counterbalanced. Responses from both questionnaires were combined (i.e., two preference profiles per participant) for the Principal Component Analysis (PCA).
Analysis We conducted a PCA on the 30 items using a varimax rotation.
All items correlated .40 with at least one other item in the list, indicating acceptable factorability (Table S1, Supplemental Materials). The Kaiser-Meyer-Olkin (KMO) measure of sampling adequacy was high, KMO =.92 (see Kaiser, 1974), and above .73 for all individual items (greater than the recommended .50). For the data, Bartlett’s test of sphericity was significant, χ2(435) = 2345.23,
p < .001. These findings suggest that inter-item correlations were acceptably large for PCA.
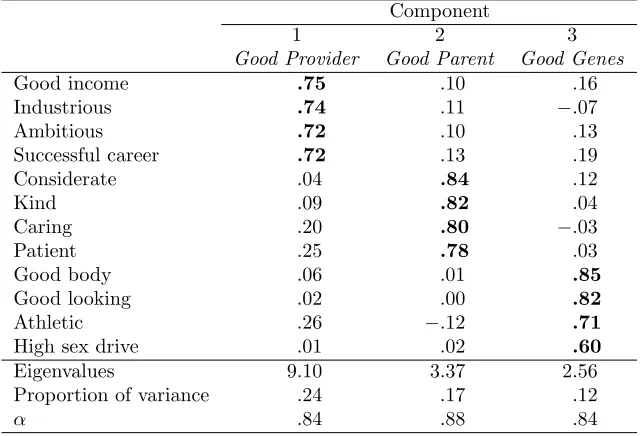
Using the eigenvalue-greater-than-one rule and scree plot inflection analy-sis, three factors were carried forward to the final analysis. As in Lu et al.’s (2015) study, the items cluster on the same components: Good Provider (Com-ponent 1),Good Parent (Component 2), andGood Genes (Component 3). To ensure that the Factors were equally balanced for Study 1, the four items with the highest factor loading were carried forward for the 12-item version of the MPI. The 12 items and factor loadings are presented in Table 1. The sum a par-ticipant spent on the 12 items was subsequently aggregated for each component type (Table 1).
Tightness-looseness scale. Gelfand et al.’s (2011) six-item tightness-looseness
scale measures the extent to which social norms are clearly defined and con-sistently imposed within a region, for example, “There are many social norms that people are supposed to abide by in this country”, and, “In this country, if someone acts in an inappropriate way, others will strongly disapprove”. Cul-tural tightness is a construct that’s related to, yet distinct from, conservative political values (Harrington & Gelfand, 2014).
1The authors’ original intention had been to collect data exclusively from women. As such,
Table 1: Mate Preference Inventory (MPI) items and factor loadings (N= 151).
Component
1 2 3
Good Provider Good Parent Good Genes
Good income .75 .10 .16
Industrious .74 .11 −.07
Ambitious .72 .10 .13
Successful career .72 .13 .19
Considerate .04 .84 .12
Kind .09 .82 .04
Caring .20 .80 −.03
Patient .25 .78 .03
Good body .06 .01 .85
Good looking .02 .00 .82
Athletic .26 −.12 .71
High sex drive .01 .02 .60
Eigenvalues 9.10 3.37 2.56
Proportion of variance .24 .17 .12
α .84 .88 .84
Note.Factor loadings above .60 appear in bold.
Tradition. Tradition was a three-item subscale from Schwartz et al.’s (2012)
Portraits Values Questionnaire (Revised) (PVQ-RR). The subscale measures the extent to which individuals believe that cultural norms should be maintained. Items include “It is important to maintain traditional values or beliefs”. The full version of the PVQ-RR measures 19 human values recognised cross-culturally, such as Tradition, Hedonism, and Benevolence. The most recent version has been validated in eight countries (Cieciuch et al., 2014).
2.2.4. Controlling for confounds
It is possible that conservatives, rather than demonstrating a bias, instead find it difficult to discriminate between short- and long-term mates. Specifically, their lack of experience with short-term mating could impair their performance in this task. This would suggest that, given sufficient exposure to short-term mating, individuals from conservative groups would eventually demonstrate a distinctive short-term mating strategy. To control for this we administered the Behaviour subscale from the SOI-R (SOI-B) (Penke & Asendorpf, 2008), a three-item measure that measures an individual’s level of sexual experience, and has good internal consistency, α= .85. The items included: “With how many different partners have you had sexual intercourse onone and only one
Table 2: Mean (SD) scores for individual-level measures, aggregated by Nationality and Sex.
Item India UK USA
Female Male Female Male Female Male
Tightness 26.62 24.91 24.51 23.80 24.53 23.33 (4.28) (3.03) (3.44) (3.47) (3.97) (4.24) SOI-B 5.39 8.46 8.56 9.08 7.24 10.94
(3.47) (4.99) (5.09) (5.48) (4.24) (6.91) Tradition 13.61 12.69 9.15 9.14 8.33 9.51
(3.97) (3.40) (4.05) (4.47) (4.13) (4.36)
2.2.5. Procedure
Participants completed the Tightness-Looseness Scale, the SOI-B, and the PVQ-RR. Next, participants were asked to construct their ideal romantic part-ner by spending 30 Mate Dollars on 12 traits (see Table 1). Instructions indi-cated that each dollar spent was equivalent to 10 percentile points. For example, a $5 spend on the trait ‘athletic’ was equivalent to ‘buying’ a mate who is more athletic than 50% of the population. A participant’s preference for traits was calculated by aggregating their spend on each trait component listed in Table 1.
At the start of each trial, participants were told to construct either their ideal “short-term partner (i.e., one-night stand)” or “long-term partner (i.e., husband / wife)” (deleted, as appropriate, based on participant sex). The pre-sentation order of the relationship context variable was counterbalanced across participants.
2.3. Results
2.3.1. Tightness-looseness validation
As a confirmatory measure, we tested whether our target regions differed in their average tightness scores (Table 2). Planned contrast analysis revealed that participants from India were significantly more tight than those in the UK and USA, t(515) = −4.15, p < .001, but that participants from UK and USA did not significantly differ in their tightness score,t(515) = 0.04,p > .05. Men’s tightness scores were significantly lower than women’s,t(515) =−3.61,
p < .001, but the Nationality x Sex interaction was not significant (India vs. UK & US:t(515) = 1.05,p > .05; UK vs. US:t(515) =−0.62,p > .05).
2.3.2. Short- and long-term preferences
(a) Good Genes (women)
UK USA India 0
5 10 15 20 25 30
Nationality
Budg
et spent on trait ($)
● ●
●
● ●
●
(b) Good Parent (women)
UK USA India Nationality 0
5 10 15 20 25 30
Budg
et spent on trait ($) ● ● ●
● ●
●
(c) Good Provider (women)
UK USA India Nationality 0
5 10 15 20 25 30
Budg
et spent on trait ($)
● ●
●
● ●
● ●Short−term
●Long−term
(d) Good Genes (men)
UK USA India 0
5 10 15 20 25 30
Nationality
Budg
et spent on trait ($)
● ●
●
● ● ●
(e) Good Parent (men)
UK USA India Nationality 0
5 10 15 20 25 30
Budg
et spent on trait ($)
● ●
●
● ●
●
(f) Good Provider (men)
UK USA India Nationality 0
5 10 15 20 25 30
Budg
et spent on trait ($)
● ●
● ●
[image:10.612.143.454.127.403.2]● ●
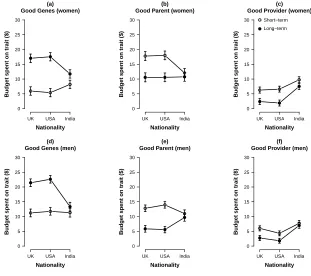
Figure 1: Mean spend by Nationality, as a function of Relationship Context for women (top row) and men (bottom row). Left = good genes, centre = good parent, and right = good provider traits. Note. Error bars denote 95% confidence intervals.
Good genes. The main effect of Nationality was significant,F(2,515) = 19.21,
p < .001,η2
G=.04 (Figures 1(a) and (d)). Planned contrasts showed that Indian participants spent significantly less on good genes than non-Indian participants,
t(515) = 6.73, p < .001, but that UK and US participants were matched on spend, t(515) = −0.86, p > .05 (Table 3). Sex was also significant, with men spending significantly more on good genes than women,F(1,515) = 92.75,p < .001,η2G =.10. We observed a significant effect of Context, with participants spending more on good genes in the short-term context F(1,515) = 523.39,
p < .001,η2 G=.30.
The Nationality x Sex interaction was significant,F(2,515) = 4.87,p < .01,
η2
G=.01. Planned contrasts showed that Indian men spent approximately $2.36 more on good genes traits, relative to Indian women,t(515) = −2.92,p < .01,
d = −0.41. The difference between male and female spend was $5.71 in the UK,t(515) =−7.66,p < .001,d=−0.65, and $4.83 in the US, t(515) =−6.32,
p < .001,d=−0.54.
The Nationality x Context interaction was significant, F(2,515) = 55.90,
p < .001, η2
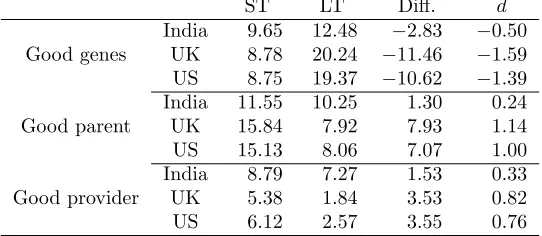
Table 3: Mean spend on traits by Nationality, as a function of short-term (ST) and long-term (LT) Relationship Contexts, the difference (Diff.) between ST and LT, and Cohen’sd(d).
ST LT Diff. d
India 9.65 12.48 −2.83 −0.50 Good genes UK 8.78 20.24 −11.46 −1.59 US 8.75 19.37 −10.62 −1.39 India 11.55 10.25 1.30 0.24 Good parent UK 15.84 7.92 7.93 1.14 US 15.13 8.06 7.07 1.00 India 8.79 7.27 1.53 0.33 Good provider UK 5.38 1.84 3.53 0.82 US 6.12 2.57 3.55 0.76
greater in the liberal regions than in India, t(515) = 6.73, p < .001, but that there was no difference between the USA and UK,t(251) = 0.03,p > .05. For good genes, short- and long-term preferences were more distinctive in the UK and USA, relative to India.
Neither the Sex x Context interaction,F(1,515) = 2.78,p > .05,η2
G< .002, nor the Nationality x Sex x Context interaction, F(1,515) = 0.07, p > .05,
η2
G< .001, reached significance.
Good parent. The main effect of Sex was significant, F(1,515) = 64.62, p <
.001,ηG2 =.07, with women spending significantly more on good parent traits (Figures 1(b) and (e)). Context was also significant, such that participants spent more on good parent in the long-term context F(1,515) = 304.89, p < .001,
ηG2 =.16 (Table 3). However, Nationality did not predict spend on good parent traits,F(1,515) = 2.55,p > .05,ηG2 =.01.
We observed a Nationality x Sex interaction,F(2,515) = 6.97,p < .01,η2
G =
.02, with planned contrasts showing that Indian women spent approximately $1.07 more on good parent traits, relative to Indian men,t(515) = 1.32,p > .05,
d= 0.20. However, the difference between male and female spend was $4.53 in the UK,t(515) = 6.05,p < .001,d= 0.59, and $4.86 in the US,t(515) = 6.34,
p < .001,d= 0.64.
The Nationality x Context interaction was significant, F(2,515) = 39.46,
p < .001, η2
G = .05. Planned contrasts revealed that the difference between short- and long-term spend was smaller in India than in the liberal regions,
t(515) = 2.40,p < .05, but that there was no difference between the USA and UK,t(515) =−0.60,p > .05.
Neither the Sex x Context interaction,F(1,515) = 0.15,p > .05,η2G< .001, nor the Nationality x Sex x Context interaction, F(2,515) = 0.32, p > .05,
ηG2 < .001, reached significance.
Good provider. Overall, women spent significantly more on good provider traits
than men,F(1,515) = 6.38, p < .05,η2
G =.09 (Figures 1(c) and (f)). We also observed a main effect of Nationality,F(2,515) = 68.19, p < .001, η2
such that Indian participants spent significantly more on good provider traits,
t(515) =−13.16,p < .001, but spend was matched in the US and UK,t(515) = −1.83,p > .05 (Table 3). The main effect of Context was significant, with spend on good provider traits higher in the long-term context, F(1,515) = 154.19,
p < .001,ηG2 =.09.
We observed a Sex x Context interaction, F(1,515) = 9.68, p < .01, η2
G =
.01. Women spent significantly more than men in the long-term context,t(941) = 3.87,p < .001, but spend was matched in the short-term context,t(941) = 0.21,
p > .05.
The Nationality x Context interaction was significant, F(2,515) = 8.74,
p < .001,η2
G =.01. Planned contrasts showed that Indians spent significantly more than US and UK participants, in both the short- and long-term contexts, (allts>5.2; allps< .001). However, spend between US and UK participants was matched in both the short- and long-term contexts (all ts < 1.40; all ps
> .28).
The Nationality x Sex interaction, F(2,515) = 1.79, p > .05, η2G < .005, plus the Nationality x Sex x Context interaction, F(2,515) = 1.02, p > .05,
ηG2 =.001, did not reach significance.
2.3.3. Tradition and mate preference
Next, we investigated whether short- and long-term preferences are predicted by an individual’s desire to maintain social norms. Mean Tradition scores are reported by Nationality and Sex in Table 2. To aid interpretation of the results, good genes, good parent, and good provider traits were analysed in isolation.
Good genes. Do non-traditional individuals display more distinctive short- and
long-term mate preferences than traditional individuals? The main effect for Tradition (PVQ-RR) was significant, F(1,517) = 38.94, p < .001, η2
G = .04,
with more Traditional individuals spending less on good genes traits. We also observed a significant Tradition x Context interaction,F(1,517) = 57.36,
p < .001, η2
G = .04, indicating that low tradition scores are associated with more distinctive short- and long-term mate preferences (Figures 2(a) and (d)). Regression slope analyses revealed that Tradition negatively predicted spend on good genes traits in the short-term context, β = −0.32, t(519) = −7.80,
p < .001, but did not predict spend in the long-term context, β = 0.00,
t(252) = 0.05,p=.96.
Neither the Tradition x Sex, Sex x Context, nor Tradition x Sex x Context interactions reached significance, (allFs<3.5; allps> .06).
Good parent. The main effect of Tradition did not predict participants’ spend on
good parent traits,F(1,517) = 2.20,p > .05,ηG2 =.002 (Figures 2(b) and (e)). However, the Tradition x Context interaction was significant,F(1,517) = 32.88,
p < .001, η2
● ● ● ● ● ● ● ● ● ● ● ● ● ● ● ● ● ● ● ● ● ● ● ● ● ● ● ● ● ● ● ● ● ● ● ● ● ● ● ● ● ● ● ● ● ● ● ● ● ● ● ● ● ● ● ● ● ● ● ● ● ● ● ● ● ● ● ● ● ● ● ● ● ● ● ● ● ● ● ● ● ● ● ● ● ● ● ● ● ● ● ● ● ● ● ● ● ● ● ● ● ● ● ● ● ● ● ● ●●● ● ● ● ● ● ● ● ● ● ● ● ● ● ● ● ● ● ● ● ● ● ● ● ● ● ● ● ● ● ● ● ● ● ● ● ● ● ● ● ● ● ● ● ● ● ● ● ● ● ● ● ● ● ● ● ● ● ● ● ● ● ● ● ● ● ● ● ● ● ● ● ● ● ● ● ● ● ● ● ● ● ● ● ● ● ● ● ● ● ● ● ● ● ● ● ● ● ● ● ● ● ● ● ● ● ● ● ● ● ● ● ● ● ● ● ● ● ● ● ● ● ● ● ● ● ● ● ● ● ● ● ● ● ● ● ● ● ● ● ● ● ● ● (a) Good Genes (women)
2.5 10.5 18.5
0 5 10 15 20 25 30 Tradition Budg
et spent on trait ($)
● ● ● ● ● ● ● ● ● ● ● ● ● ● ● ● ● ● ● ● ● ● ● ● ● ● ● ● ● ● ● ● ● ● ● ● ● ● ● ● ● ● ● ● ● ● ● ● ● ● ● ● ● ● ● ● ● ● ● ● ● ● ● ● ● ● ● ● ● ● ● ● ● ● ● ● ● ● ● ● ● ● ● ● ● ● ● ● ● ● ● ● ● ● ● ● ● ● ● ● ● ● ● ● ● ● ● ● ●●● ● ● ● ● ● ● ● ● ● ● ● ● ● ● ● ● ● ● ● ● ● ● ● ● ● ● ● ● ● ● ● ● ● ● ● ● ● ● ● ● ● ● ● ● ● ● ● ● ● ● ● ● ● ● ● ● ● ● ● ● ● ● ● ● ● ● ● ● ● ● ● ● ● ● ● ● ● ● ● ● ● ● ● ● ● ● ● ● ● ● ● ● ● ● ● ● ● ● ● ● ● ● ● ● ● ● ● ● ● ● ● ● ● ● ● ● ● ● ● ● ● ● ● ● ● ● ● ● ● ● ● ● ● ● ● ● ● ● ● ● ● ● ● (b) Good Parent (women)
2.5 10.5 18.5
0 5 10 15 20 25 30 Tradition Budg
et spent on trait ($)
● ● ● ● ● ● ● ● ● ● ● ● ● ● ● ● ● ● ● ● ● ● ● ● ● ● ● ● ● ● ● ● ● ● ● ● ● ● ● ● ● ● ● ● ● ● ● ● ● ● ● ● ● ● ● ● ● ● ● ● ● ● ● ● ● ● ● ● ● ●● ● ● ● ● ● ● ● ● ● ● ●● ● ● ●● ● ●● ● ● ● ● ● ● ● ● ● ● ● ● ●●● ● ● ● ●●● ● ● ● ● ● ● ● ● ● ● ● ● ● ● ●● ● ● ● ● ● ● ● ● ● ● ● ● ● ● ● ● ● ● ● ● ● ● ● ● ● ● ● ● ● ● ●● ● ● ● ● ● ● ● ● ● ● ● ● ● ● ● ● ● ● ● ● ● ● ● ● ● ● ● ● ● ● ● ● ● ● ● ● ● ● ● ● ● ● ● ● ● ● ● ● ● ● ● ● ● ● ● ● ● ● ● ● ● ● ● ● ● ● ● ● ● ● ● ● ● ● ● ● ● ● ● ● ● ● ● ● ● ● ● ● ● ● ● ● ● ● ● (c) Good Provider (women)
2.5 10.5 18.5
0 5 10 15 20 25 30 Tradition Budg
et spent on trait ($)
Short−term Long−term ● ● ● ● ● ● ● ● ● ● ● ● ● ● ● ● ● ● ● ● ● ● ● ● ● ● ● ● ● ● ● ● ● ● ● ● ● ● ● ● ● ● ● ● ● ● ● ● ● ● ● ● ● ● ● ● ● ● ● ● ● ● ● ● ● ● ● ● ● ● ● ● ● ● ● ● ● ● ● ● ● ● ● ● ● ● ● ● ● ● ● ● ● ● ● ● ● ● ● ● ● ● ● ● ● ● ● ● ● ● ● ● ● ● ● ● ● ● ● ● ● ● ● ● ● ● ● ● ● ● ● ● ● ● ● ● ● ● ● ● ● ● ● ● ● ● ● ● ● ● ● ● ● ● ● ● ● ● ● ● ● ● ● ● ● ● ● ● ● ● ● ● ● ● ● ● ● ● ● ● ● ● ● ● ● ● ● ● ● ● ● ● ● ● ● ● ● ● ● ● ● ● ● ● ● ● ● ● ● ● ● ● ● ● ● ● ● ● ● ● ● ● ● ● ● ● ● ● ● ● ● ● ● ● ● ● ● ● ● ● ● ● ● ● ● ● ● ● ● ● ● ● ● ● ● ● ● ● ● ● ● ● ● ● ● ● ● (d) Good Genes (men)
2.5 10.5 18.5
0 5 10 15 20 25 30 Tradition Budg
et spent on trait ($) ●
● ● ● ● ● ● ● ● ● ● ● ● ● ● ● ● ● ● ● ● ● ● ● ● ● ● ● ● ● ● ● ● ● ● ● ● ● ● ● ● ● ● ● ● ● ● ● ● ● ● ● ● ● ● ● ● ● ● ● ● ● ● ● ● ● ● ● ● ● ● ● ● ● ● ● ● ● ● ● ● ● ● ● ● ● ● ● ● ● ● ● ● ● ● ● ● ● ● ● ● ● ● ● ● ● ● ● ● ● ● ● ● ● ● ● ● ● ● ● ● ● ● ● ● ● ● ● ● ● ● ● ● ● ● ● ● ● ● ● ● ● ● ● ● ● ● ● ● ● ● ● ● ● ● ● ● ● ● ● ● ● ● ● ● ● ● ● ● ● ● ● ● ● ● ● ● ● ● ● ● ● ● ● ● ● ● ● ● ● ● ● ● ● ● ● ● ● ● ● ● ● ● ● ● ● ● ● ● ● ● ● ● ● ● ● ● ● ● ● ● ● ● ● ● ● ● ● ● ● ● ● ● ● ● ● ● ● ● ● ● ● ● ● ● ● ● ● ● ● ● ● ● ● ● ● ● ● ● ● ● ● ● ● ● ● ● (e) Good Parent (men)
2.5 10.5 18.5
0 5 10 15 20 25 30 Tradition Budg
et spent on trait ($)
● ● ● ● ● ● ● ● ● ● ● ● ● ● ● ● ● ● ● ● ● ● ●● ● ● ● ● ● ● ● ● ● ● ● ● ● ● ● ● ● ● ● ● ● ● ● ● ● ● ● ● ● ● ● ● ● ● ● ● ● ● ● ● ● ● ●● ● ● ● ● ● ● ● ● ● ● ● ● ● ● ● ● ● ● ● ● ● ● ● ● ● ● ● ● ● ● ● ● ● ● ● ● ● ● ● ● ● ● ● ● ● ● ● ● ● ● ● ● ● ● ● ● ● ● ● ● ● ● ● ● ● ● ●● ● ● ● ● ● ● ● ●● ●● ● ● ● ● ● ● ● ● ● ● ● ● ● ● ● ● ● ● ● ● ● ● ● ● ● ● ● ● ● ● ● ● ● ● ● ● ●● ● ● ● ● ● ● ● ● ● ● ● ● ● ● ● ● ● ● ● ● ● ● ● ● ● ● ● ● ● ● ● ● ● ● ● ● ● ● ● ● ● ● ● ● ● ● ● ● ● ● ● ● ● ● ● ● ● ● ● ● ● ● ● ● ● ● ● ● ● ● ● ● ● ● ● ● ● ● ● ● ● ● (f) Good Provider (men)
2.5 10.5 18.5
0 5 10 15 20 25 30 Tradition Budg
[image:13.612.141.460.123.399.2]et spent on trait ($)
Figure 2: Mean spend by Tradition score, as a function of Relationship Context for women (top row) and men (bottom row). Left = good genes, centre = good parent, and right = good provider traits. Note. Shading denotes 95% confidence intervals.
β = −0.09, t(252) = 2.10, p = .036, but negatively predicted spend in the long-term context,β=−0.20, t(252) =−4.64,p < .001.
The Tradition x Sex interaction was significant, F(1,517) = 4.96, p < .05,
ηG2 = .01. Regression slope tests showed that Tradition negatively predicted spend among women,t(506) =−2.48,p < .05, but did not predict men’s spend,
t(532) = 0.64,p > .05.
The Tradition x Sex x Context interaction was not significant,F(1,517) = 0.15,p > .05,η2
G < .001.
Good provider. Overall, Tradition was associated with an increased preference
in good provider traits,F(1,517) = 112.92,p < .001,η2
G=.13 (Figures 2(c) and (f)). The Tradition x Context interaction was significant, F(1,517) = 16.44,
p < .001, η2
G = .01. Specifically, Tradition positively predicted spend in the short-term context, β = 0.44, t(519) = 11.14, p < .001, and the long-term context,β= 0.26,t(519) = 6.19,p < .001.
2.3.4. Sexual experience
Are the observed effects driven by differences in sexual experience? To con-trol for experience, we tested whether the SOI-B score predicted whether par-ticipants’ demonstrated distinctive mate preferences. Mean sexual experience is reported by nationality in Table 2. In the multiple regression model, Context (short-, long-term) and Trait (good genes, good parent, good provider) were the within participants factors and SOI-B score was the between-participants factor. Neither the SOI-B x Context interaction,F(1,519) = 0.00,p > .05,ηG2 < .001, nor the SOI-B x Context x Trait interactions were significant,F(2,1038) = 0.00,
p > .05,ηG2 < .001. Hence we can conclude that sexual experience does not pre-dict whether individuals have distinctive short- and long-term mate preferences.
2.4. Discussion
When choosing a partner, individuals can benefit from prioritising differ-ent attributes for short- and long-term mating. However, Study 1 shows that socially conservative participants were less likely to have distinctive mate prefer-ences. This was also affected by individual differences in motivation to maintain traditional values, indicating that conservative norms can restrict participation in short-term mating.
We also observed that, independent of relationship context, conservatism (measured at the societal- and individual-level) negatively predicted spend on good genes, but positively predicted spend on good provider traits. Further, women low on tradition spent more on good parent traits, but there was no association between tradition and good parent spend among men. This is con-sistent with previous findings that, as societies become increasingly progressive and women gain parity with men, women increasingly favour good parents over good providers (Lu et al., 2015; Stanik & Ellsworth, 2010). As women gain economic independence, there is less pressure to secure a mate who can provide financially. Instead, it becomes increasingly important to find a mate who can contribute at home.
We observed further sex differences with respect to trait preference. Al-though men spent more than women to obtain good genes traits, women spent more than men on good parent and good provider traits. This supports a wealth of literature suggesting that men prioritise cues of fertility, but women priori-tise cues of resources (e.g., Buss, 1989; Kamble et al., 2014; Conroy-Beam et al., 2015; Souza et al., 2016).
Finally, we found that differences between men and women were smallest in India, but matched in the US and UK. This could be driven, in part, by converging short- and long-term preferences in this region. More broadly, this might reflect less variance in behaviour in conservative regions.
3. Study 2
3.1. Introduction
Although highlighting that conservatism is positively associated with indis-tinguishable short- and long-term mate preferences, the methodology of Study 1 does not directly address our proposition that those from conservative groups possess a long-term mate bias, compared with those from liberal groups. For example, it is possible that Indian participants possess similar short- and long-term preferences, but that this reflects long-long-term preferences that more closely resemble an individual’s short-term ideal (compared with the UK and USA samples). We addressed this by presenting participants with descriptors of the archetypal one-night stand and spouse, then tested their perceptions of these archetypes as suitable for comparatively longer relationships.
3.2. Method
3.2.1. Participants
Owing to the novel nature of our methodology, we could not base our target sample size on effect size estimates. Instead, we chose a target sample size that was comparable with Study 1 (targetN ≈80). Post hoc analyses showed that the observed power was≥.81 for all key tests.
We recruited 322 individuals (women = 156, men = 166) from India and the US via Amazon Mechanical Turk. All participants were aged 18-63 (M = 31.57;
SD= 8.08), heterosexual, and financially reimbursed for their time.
3.2.2. Procedure
Following completion of the PVQ-RR questionnaire, participants were pre-sented with two vignettes that described either the archetypal short-term (‘ideal fling’) or long-term (‘ideal spouse’) partner (adapted from Simpson & Ganges-tad, 1992):2
Ideal flingPerson A is considered physically attractive and “sexy”.
He [she] has a sort of charisma that attracts the attention of those around him [her]. Although some might consider him [her] arrogant, A possesses a kind of self-confidence that others admire. A is not known, however, for living a responsible lifestyle. In the past, he [she] has had a series of relatively short-term relationships. Some have ended because of questionable faithfulness on the part of A.
Ideal spousePerson B is an average-looking person, someone most
people wouldn’t consider “sexy”. He [she] is sufficiently socially skilled but does not possess the kind of magnetic personality that draws the attention of others. Rather, B has a stable and responsible
2Square parentheses indicate the pronouns presented to male participants; female
personality. In a relationship, B is caring, dependable and faithful. He [she] would very much like to have a family, likes children, and would probably be good with them.
The ideal fling possesses good genes, but lacks good parent and good provider traits; this pattern is reversed in the ideal spouse vignette. This matches our findings in Study 1, which found that participants from all regions favoured good genes traits in a short-term partner, but good parent and good provider traits in a long-term partner. As such, the ideal fling vignette comprised of the traits that liberaland conservatives claimed to value in short-term, but not long-term, relationships (Study 1).
Presentation of vignettes was counterbalanced. For each archetype, partic-ipants were asked to rate the type of relationship they’dideally have with the person described: “Select the type of relationship you’d most like to have with this man [woman], if there were no consequences for your choice. Consequences could include judgements from your family, friends, society, etc.”; and the re-lationship they’d mostrealistically have with the individual described: “Select the type of relationship you’d most realistically have with this man [woman]”.
To measure whether participants believed that their ratings were in line with their peers, we asked them to estimate the ratings of other same-sex participants: “Select the type of relationship you think most other women [men] would like to have with this man [woman], if there were no consequences for their choice. Consequences could include judgements from your family, friends, society, etc.”; and: “Select the type of relationship you think most other women [men] would most realistically have with this man [woman]”. To incentivise thoughtful and truthful answers, participants were told that the individuals with the most ac-curate estimates would receive a 20 USD Amazon voucher, in addition to their participation fee.
Participants selected their response using a moveable slider that ranged from 0 (labelled in the console as ‘one-night stand’) to 100 (labelled as ‘husband’ for female participants and ‘wife’ for male participants). At the start of each trail, the slider was set at the midpoint (50). Responses for the Ideal and Realistic condition were significantly correlated, r = .91, p < .001, and are combined hereafter.
3.2.3. Design
In a mixed-factorial design, Nationality (USA, India) and Sex (male, female) were the between-subject factors. Perspective (self, third-party) and Archetype (ideal fling, ideal spouse) were the within-subject factors. The dependent vari-able was participants’ relationship preference (from 0 to 100).
3.3. Results
3.3.1. Tradition by nationality and sex
[13.5, 14.0]). Next were US men, (M = 9.71, SD= 4.23, 95% CI [9.39, 10.00]), followed by US women, (M = 8.86, SD= 4.65, 95% CI [8.49, 9.22]).
3.3.2. Nationality
Self-reports. We first asked whether participants from India (vs. USA) were
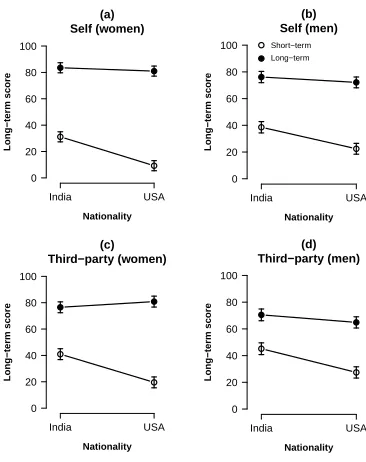
more likely to perceive the ideal fling as a potential long-term mate. A three-way mixed ANOVA was performed on participants’ ratings, with Sex (male, female) and Nationality (India, US) as the between-subjects factors, and Archetype (ideal fling, ideal spouse) as the within-subjects factor. Overall, the main effect of Archetype was significant,F(1,313) = 603.63,p < .001,ηG2 =.54, indicating that participants favoured long-term relationships with the spouse archetype, but short-term relationships with the fling archetype. The main effect of Nation-ality was significant,F(1,313) = 42.75,p < .001,η2
G=.05, with participants in India favouring comparatively longer relationships. However, the main effect of Sex was not significant,F(1,313) = 0.44,p > .05,η2
G=.001.
We observed a Nationality x Archetype interaction, F(1,313) = 13.30,p < .001,η2
G =.03, such that US participants differentiated between the vignettes more-so than Indian participants (Figures 3(a) and (b)). Post-hoc comparisons using the Bonferroni correction indicated that Indian (vs. US) participants favoured longer relationships with the ideal fling prospect, t(574.18) = 8.39,
p < .001,d= 0.67, but that ratings for the ideal spouse were matched across India and the US,t(631.81) =−4.32,p > .05,d= 0.15.
We also observed a significant Sex x Archetype interaction, F(1,313) = 18.50, p < .001, ηG2 = .04, indicating that women’s preferences were more distinctive than men’s. Bonferroni-adjusted comparisons revealed that women (vs. men) favoured comparatively shorter relationships with the ideal fling,
t(631.81) =−4.32,p < .001,d= 0.34. Additionally, women (vs. men) favoured longer relationships with the ideal spouse,t(628.64) = 4.40,p < .001.
The Nationality x Sex and Nationality x Sex x Archetype interactions did not reach significance, (allFs< .80, allps> .39).
Third-party estimates. Next, we asked whether participants believed that their
preferences would be shared by same-sex participants. As with self reports, we conducted a three-way mixed ANOVA on participants’ ratings, with Sex (male, female) and Nationality (India, US) as the between-subjects factors, and Archetype (ideal fling, ideal spouse) as the within-subjects factor. Overall, the main effect of Archetype was significant,F(1,313) = 308.71,p < .001,η2
G=.39, indicating that participants correctly predicted that others would favour long-term relationships with the spouse archetype, but short-long-term relationships with the fling archetype. Ratings differed as a function of Nationality,F(1,313) = 34.98,p < .001,ηG2 =.04, with participants in India predicting comparatively longer relationship preferences. However, ratings between men and women were matched,F(1,313) = 2.15,p > .05,η2
G=.002.
The Nationality x Archetype interaction was significant, F(1,313) = 17.11,
p < .001,η2
(a) Self (women)
India USA
Nationality
0 20 40 60 80 100
Long−term score
● ●
●
●
(b) Self (men)
India USA
Nationality
0 20 40 60 80 100
Long−term score
●
●
●
● ●Short−term
●Long−term
(c) Third−party (women)
India USA
Nationality
0 20 40 60 80 100
Long−term score
● ●
●
●
(d) Third−party (men)
India USA
Nationality
0 20 40 60 80 100
Long−term score
●
●
●
[image:18.612.204.387.124.355.2]●
Figure 3: Mean score for preferred relationship length (0 = short-term; 100 = long-term), as a function of Nationality, Relationship Context, and Sex, for (a, b) self-reports of relationship preference, and (c, d) estimates of a third party’s preference. Note. Error bars denote 95% confidence intervals.
comparisons using the Bonferroni correction indicated that Indian participants predicted longer relationship preferences for the ideal fling, t(594.94) = 8.22,
p < .001,d= 0.66, but that ratings for the ideal spouse were matched across India and the US,t(631.58) =−0.49,p > .05,d= 0.04.
We also observed a significant Sex x Archetype interaction, F(1,313) = 14.30,p < .001,η2
G=.03, indicating that women’s ratings were more distinctive than men’s. Bonferroni-adjusted comparisons revealed that women (vs. men) favoured longer relationships with the ideal spouse,t(627.78) = 5.72,p < .001,
d= 0.45. However, both sexes were matched in their predictions of ideal fling ratings,t(631.36) =−2.30, p > .05,d= 0.18.
The Nationality x Sex and Nationality x Sex x Archetype interactions did not reach significance, (allFs<2.30, allps> .13).
3.3.3. Tradition
Self-reports. Are traditional individuals more likely than liberals to perceive
po-tential mates as suited to long-term relationships? Overall, traditional partici-pants favoured longer relationships,F(1,313) = 49.38,p < .001,η2
G=.06. The Tradition x Archetype interaction was significant, F(1,313) = 10.32, p < .01,
η2
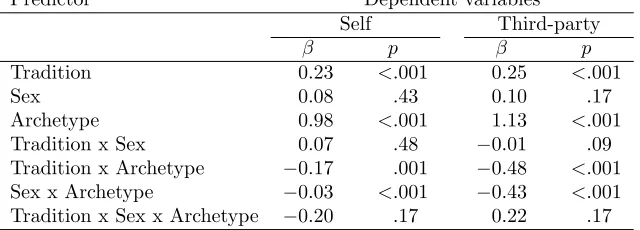
Table 4: Multiple regressions for ratings as a function of Tradition, Sex, and Archetype.
Predictor Dependent variables
Self Third-party
β p β p
Tradition 0.23 <.001 0.25 <.001
Sex 0.08 .43 0.10 .17
Archetype 0.98 <.001 1.13 <.001
Tradition x Sex 0.07 .48 −0.01 .09
Tradition x Archetype −0.17 .001 −0.48 <.001 Sex x Archetype −0.03 <.001 −0.43 <.001 Tradition x Sex x Archetype −0.20 .17 0.22 .17
β = 0.31, t(632) = 8.25, p < .001, and the ideal spouse, β = 0.11, t(632) = 2.78, p < .01. Individuals high on Tradition were more likely to perceive the archetypes as suitable for comparatively longer relationships.
Neither the Tradition x Sex, nor the Tradition x Sex x Archetype interactions reached significance, (allFs<2, allps> .16).
Third-party estimates. Additionally, more traditional participants estimated
that others participants would favour longer relationships, F(1,313) = 25.44,
p < .001, η2
G = .03. The Tradition x Archetype interaction was significant,
F(1,313) = 13.45, p < .001, η2
G = .03, with traditional participants demon-strated less distinctive preferences (Table 4). Regression slope tests showed that traditional (vs. non-traditional) individuals predicted longer preferences for the ideal fling, β = 0.27, t(632) = 7.10, p < .001. However, Tradition did not predict ratings for the the ideal spouse,β = 0.02, t(632) = 0.40, p > .05. Individuals high on Tradition predicted that same-sex others would view the ideal fling as suitable for comparatively longer relationships.
Neither the Tradition x Sex, nor the Tradition x Sex x Archetype interactions reached significance, (allFs<3, allps> .08).
3.4. Discussion
Contrary to previous findings, we found that men and women were matched for their preferred relationship length. Traditional accounts maintain that men are more short-term oriented (Schmitt et al., 2012; Schmitt, 2012), although this perspective has faced recent criticisms (Thomas & Stewart-Williams, 2018; Hal-lam et al., 2018; Stewart-Williams & Thomas, 2013; Zentner & Mitura, 2012). Although we do not find sex differences in preferred relationship length, we did observe an interaction with archetype, such that women’s preferences were more distinctive than those reported by men. Specifically, women favoured shorter relationships with the ideal fling, but longer relationships with the ideal spouse. To summarise, we found that conservatives believed that the one-night stand prospect more closely resembled a long-term mate, relative to liberals. The variance between perceptions of the ideal fling and ideal spouse was greatest among liberals, indicating that those participants adopted two distinctive sexual strategies (i.e., short-term mating with the ideal fling; long-term mating with the ideal spouse). This supports the claim that individuals from liberal groups are more likely to demonstrate distinctive short- and long-term preferences, whereas those from conservative groups over-perceive some mates’ suitability as a long-term partner.
4. General Discussion
How do differences in specific social norms shape the traits we seek in short-term and long-short-term partners? We examined perceptions of the ideal short- and long-term mate; in doing so, we found that conservatives demonstrate a regional-and individual-level bias, such that they believe that potential mates lacking in desired long-term traits (e.g., status, emotional warmth) are nonetheless suitable for comparatively longer relationships.
In Study 1, we found that liberals prioritise genetic traits when choosing a short-term mate, but parental quality is favoured for long-term mates. How-ever, ideal short- and long-term mates were less distinct for conservatives. When asked to describe their ideal short-term partner, conservatives described a mate who shared similar traits to their ideal long-term partner. This effect was repli-cated for two measures of conservatism-liberalism. Study 2 found that, relative to liberals, conservatives were more willing to invest in long-term relationships with hypothetical partners. This was unique to the ideal fling condition; for the ideal spouse condition, both groups successfully identified that he was suited for a long-term relationship. This is particularly interesting, given that the ideal fling was comprised of the traits that conservatives claimed to value in short-term, but not long-short-term, relationships (Study 1). Taken together, these findings support our prediction that conservatism - at the regional- and individual-level - moderates mate preferences, such that individuals avoid short-term mating, foregoing a potential genetic payoff for their offspring.
4.1. Social and Adaptive Benefits of a Long-Term Mate Bias
the perspective of evolutionary-based goals (i.e., maximising fitness) or social goals (i.e., conforming to group norms). The present research offers something new by investigating how, and when, humans avoid short-term mating, passing on the genetic payoff.
The findings also indicate that evaluations of a prospective mate is weighted by social norms surrounding sexuality. According to this approach, short-term mating is a viable mating strategy in liberal groups, so long as the potential mate has an acceptably high good genes value. Put another way, if the benefits to offspring outweigh the costs, even conservatives should consider short-term mating. However, for individuals in conservative groups, short-term mating is
only viable when the target mate possesses an exceptionally high good genes value. In practice, this means that conservatives will view mates who pos-sess good genes traits, but lack parental traits, as nonetheless being suited to comparatively longer relationships. These findings complement observational data, which has found that individuals from conservative regions have a higher threshold for short-term mating (Schmitt, 2002; Muggleton & Fincher, 2017; Thornhill et al., 2009) and are less willing to divorce spouses who are poor long-term partners (Vandello & Cohen, 1999).
It is interesting to note that, when financially incentivised to guess other participants’ ratings, the long-term bias persisted. This suggests that conser-vatives have internalised the bias, such that they believe others will similarly rate the poor long-term prospect as being suitable for a committed relationship. Rather than a personal preference for long-term mating, conservatives did not indicate that the potential mate described in the ideal fling context is poorly suited to parenting, responsibility, or commitment, and was thus a poor choice for a long-term mate. These findings are comparable to Durante and colleagues’ work, which finds that ovulating women overperceive ‘sexy cads’’ suitability as good dads (Durante et al., 2012). The authors suggested that this perceptual bias evolved to induce women into mating with good genes males during peak fertility.
of short-term mates. Specifically, measures of conservatism, but not partici-pants’ past experience of uncommitted sex (SOI-B; Penke & Asendorpf, 2008), was a predictor of short- and long-term preferences. Hence, we can rule out the possibility that, given sufficient exposure to short-term mating, conservatives would modify their short-term mate preferences.
In sum, we find evidence that local mating customs are maintained, in part, by individuals internalising group norms. If conservatives’ avoidance of short-term mating was purely driven by their fear of punishment, then this would suggest that they still desired short-term mates, but publicly suppressed their desire for uncommitted sex. However, we found that conservatism negatively predicted evidence of distinctive, short-term mate preferences. In Study 2, when asked to predict how other participants would perceive the target mates, con-servatives were more likely than liberals to view potential partners as suited for longer relationships - even when the target lacked long-term traits. Hence, when exposed to conservative norms, individuals experience a shift in judge-ment, perceiving good genes mates as partners worth investing in.
4.2. Theoretical Implications
Previous evolutionary-based accounts of mate choice have shown that indi-viduals trade-off between mates offering genetic and parental quality (Pillsworth & Haselton, 2006; Li et al., 2002), and that this trade-off is influenced by en-vironmental factors, such as disease prevalence, women’s educational opportu-nities, and average birth weight (Trivers et al., 1999; Stanik & Ellsworth, 2010; Schmitt, 2002). Although valuable, this does not account for the wider context of mate choice, such as cultural norms, a desire for high status, and respect for one’s kin. This report builds on previous research, demonstrating that social, non-reproductive factors can moderate evolved mating strategies. In doing so, we sought to investigate cultural factors that can influence mate preference.
Our findings also question the extent to which findings within mate choice literature can be generalised to diverse samples. Within social psychology, there is clear evidence that attitudes are shaped by culture. To date, however, studies of mate preference have been mostly based on Western samples. Although the dual-sexual strategy has been studied extensively (e.g., Buss & Schmitt, 1993; Gangestad & Simpson, 2000; Gangestad & Thornhill, 2008), the present findings challenge the conclusion that adoption of the dual-sexual strategy is homoge-nous across cultures. Instead, we provide preliminary evidence to suggest that strategies are contingent upon social norms, in addition to the genetic consider-ations. These findings could have significant implications for our understanding of cross-cultural differences in mate preference, as well as our understanding of mate guarding.
lack commitment traits. This is at odds with themales-compete/females-choose
hypothesis, and converges with several recent findings suggesting that sex differ-ences are exaggerated (Thomas & Stewart-Williams, 2018; Hallam et al., 2018; Stewart-Williams & Thomas, 2013; Zentner & Mitura, 2012).
More broadly, we believe that the findings contribute to a wider understand-ing of how social norms are maintained. Related to this is the notion of cultural tightness, a construct that closely resembles, but is distinct from, conservatism. Tight cultures are those with homogenous social norms and high levels of punish-ment for those who violate these norms (Gelfand et al., 2011). In groups where social deviance is not tolerated, individuals should internalise multiple social codes that the group enforces. For example, conservative cultures demonstrate higher prevalence of religiosity (Saroglou et al., 2004). In these groups, the cost of deviance (expressing atheist beliefs) outweighs the costs of conforming
(religiosity). As such, a bias for internalising religion could be adaptive. The
present report has far-reaching implications for the study of social norms with respect to outgroup prejudice, gender roles, and social hierarchy.
4.3. Limitations and Future Research
The present study has several limitations. First, we relied solely on partici-pants’ stated preference, rather than direct measures of preferences. Although this method has been reliably adopted and validated in previous studies (Snyder et al., 2011; Gangestad et al., 2007), and the mate budget task added an element of forced trade-off (Li et al., 2002), implicit measures (e.g., implicit-association test (IAT), face preference, process dissociation, cognitive load) would provide a more accurate measure of attraction. Future research should incorporate di-rect measures, which would prove more conclusive in testing the psychological mechanisms underlying this bias.
Second, Study 2 was designed as a forced-choice task, such that participants could not opt out of selecting a preferred relationship length. This was to ensure that conservative, sexually-inexperienced participants nonetheless evaluated all target mates. However, in a recent study (Thomas & Stewart-Williams, 2018) this methodology was amended, with participants being given the offer of select-ing a long-term, short-term, or no relationship with the target individual (‘Snog, Marry, Avoid’ paradigm). Here, the authors found that most participants chose to have neither a short- nor long-term relationship, indicating that both men and women are relatively choosy. Given this, future research might incorporate a mix of both forced-choice and opt-out studies.
4.4. Conclusions
In the present report, we found that conservatives over-perceive some mates’ suitability as a committed partner. This effect was specific to hypothetical mates who were ideally suited to short-term mating (i.e., sexy, but uncommitted). Rat-ings for ideal long-term mates (i.e., committed, but not necessarily attractive) were consistently perceived across liberals and conservatives. Although it can be prudent for individuals to favour a short-term strategy with good genes mates, the genetic benefits for offspring may be offset by the potential for social back-lash. Consistent with error management theory (Haselton & Buss, 2000) and signal detection analysis (Nesse, 2005) we find that, in conservative groups, a sexy but unfaithful mate could transform from being perceived as ‘just a fling’ to an ideal spouse.
References
Baumeister, R. F., & Twenge, J. M. (2002). Cultural suppression of female sexuality. Review of General Psychology, 6, 166–203. doi:10.1037//1089-2680.6.2.166.
Brehm, J. W. (1966). A theory of psychological reactance. New York, NY: Academic Press. doi:10.1002/hrdq.20027.
Buss, D. M. (1989). Sex differences in human mate preferences: Evolutionary hypotheses tested in 37 cultures. Behavioral and Brain Sciences, 12, 1–49. doi:10.1017/S0140525X00023992.
Buss, D. M., & Schmitt, D. P. (1993). Sexual strategies theory: An evolu-tionary perspective on human mating. Psychological Review, 100, 204–232. doi:10.1037/0033-295X.100.2.204.
Champely, S. (2017). pwr: Basic Functions for Power Analysis. R package version 1.2-1.
Cieciuch, J., Davidov, E., Vecchione, M., Beierlein, C., & Schwartz, S. H. (2014). The cross-national invariance properties of a new scale to measure 19 basic human values: A test across eight countries. Journal of Cross-Cultural
Psy-chology,45, 764–776. doi:10.1177/0022022114527348.
Cohen, J. (1988). Statistical power analysis for the behavioral sciences. (2nd ed.). Hilsdale, NJ: Routledge.
Conroy-Beam, D., Buss, D. M., Pham, M. N., & Shackelford, T. K. (2015). How sexually dimorphic are human mate preferences? Personality and Social
Psychology Bulletin,41, 1082–1093. doi:10.1177/0146167215590987.
Durante, K. M., Griskevicius, V., Simpson, J. A., Cant´u, S. M., & Li, N. P. (2012). Ovulation leads women to perceive sexy cads as good dads. Journal
Durex Sexuality Study (2005). Durex Sexuality Study. URL:
http://www.durex.com/.
Flood, M. (2013). Male and female sluts: Shifts and stabilities in the regula-tion of sexual relaregula-tions among young heterosexual men. Australian Feminist
Studies, 28, 95–107. doi:10.1080/08164649.2012.758024.
Gangestad, S. W., Garver, C. E., Simpson, J. A., & Cousins, A. J. (2007). Changes in women’s mate preferences across the ovulatory cycle.
Jour-nal of PersoJour-nality and Social Psychology, 92, 151–163.
doi:10.1037/0022-3514.92.1.151.
Gangestad, S. W., & Simpson, J. A. (2000). The evolution of human mating: Trade-offs and strategic pluralism. Behavioral and Brain Sciences, 23, 573– 644. doi:10.1017/s0140525x0000337x.
Gangestad, S. W., & Thornhill, R. (2008). Human oestrus.
Pro-ceedings of the Royal Society B: Biological Sciences, 275, 991–1000.
doi:10.1098/rspb.2007.1425.
Gelfand, M. J., Raver, J. L., Nishii, L., Leslie, L. M., Lun, J., Lim, B. C., Duan, L., Almaliach, A., Ang, S., Arnadottir, J., Aycan, Z., Boehnke, K., Boski, P., Cabecinhas, R., Chan, D., Chhokar, J., D’Amato, A., Ferrer, M., Fischlmayr, I. C., Fischer, R., Fulop, M., Georgas, J., Kashima, E. S., Kashima, Y., Kim, K., Lempereur, A., Marquez, P., Othman, R., Overlaet, B., Panagiotopoulou, P., Peltzer, K., Perez-Florizno, L. R., Ponomarenko, L., Realo, A., Schei, V., Schmitt, D. P., Smith, P. B., Soomro, N., Szabo, E., Taveesin, N., Toyama, M., Van de Vliert, E., Vohra, N., Ward, C., & Yamaguchi, S. (2011). Dif-ferences between tight and loose cultures: A 33-nation study. Science,332, 1100–1104. doi:10.1126/science.1197754.
Ghanim, D. (2015). The virginity trap in the Middle East. NY, New York: Springer.
Greiling, H., & Buss, D. M. (2000). Women’s sexual strategies: The hidden dimension of extra-pair mating. Personality and Individual Differences, 28, 929–963. doi:10.1016/s0191-8869(99)00151-8.
Hallam, L., De Backer, C. J., Fisher, M. L., & Walrave, M. (2018). Are sex differences in mating strategies overrated? Sociosexual orientation as a domi-nant predictor in online dating strategies.Evolutionary Psychological Science,
Advanced online publication. doi:10.1007/s40806-018-0150-z.
Harrington, J. R., & Gelfand, M. J. (2014). Tightness-looseness across the 50 United States. Proceedings of the National Academy of Sciences,111, 7990– 7995. doi:10.1073/pnas.1317937111.
handbook of evolutionary perspectives on violence, homicide, and war (pp. 77–90). Oxford, UK: Oxford University Press.
Haselton, M. G., & Buss, D. M. (2000). Error management theory: A new perspective on biases in cross-sex mind reading. Journal of Personality and
Social Psychology,78, 81–91. doi:10.1037//0022-3514.78.1.81.
Haselton, M. G., Nettle, D., & Murray, D. R. (2015). The evolution of cognitive bias. In D. M. Buss (Ed.), The handbook of evolutionary
psy-chology (pp. 1–20). Hoboken, NJ: John Wiley & Sons, Inc. (2nd ed.).
doi:10.1002/9781119125563.evpsych241.
Kaiser, H. F. (1974). An index of factorial simplicity.Psychometrika,39, 31–36. doi:10.1007/BF02291575.
Kamble, S., Shackelford, T. K., Pham, M., & Buss, D. M. (2014). Indian mate preferences: Continuity, sex differences, and cultural change across a quarter of a century. Personality and Individual Differences, 70, 150–155. doi:10.1016/j.paid.2014.06.024.
LaFree, G., Dugan, L., & Korte, R. (2009). The impact of British countert-errorist strategies on political violence in Northern Ireland: Comparing de-terrence and backlash models. Criminology, 47, 17–45. doi:10.1111/j.1745-9125.2009.00138.x.
Li, N. P., Bailey, J. M., Kenrick, D. T., & Linsenmeier, J. A. W. (2002). The necessities and luxuries of mate preferences: Testing the tradeoffs. Journal of
Personality and Social Psychology, 82, 947–955.
doi:doi.org/10.1037//0022-3514.82.6.947.
Li, N. P., & Kenrick, D. T. (2006). Sex similarities and differences in preferences for short-term mates: What, whether, and why. Journal of Personality and
Social Psychology,90, 468–489. doi:10.1037/0022-3514.90.3.468.
Lu, H. J., Zhu, X. Q., & Chang, L. (2015). Good genes, good providers, and good fathers: Economic development involved in how women select a mate.
Evolutionary Behavioral Sciences,9, 215–228. doi:10.1037/ebs0000048.
Mayeda, D. T., & Vijaykumar, R. (2016). A review of the literature on honor-based violence. Sociology Compass,105, 353–363. doi:10.1111/soc4.12367.
Meston, C. M., & Buss, D. M. (2009). Why women have sex: Understanding
sexual motivations from adventure to revenge (and everything in between).
New York, NY: Times Books.
Muggleton, N. K., & Fincher, C. L. (2017). Unrestricted sexuality promotes more distinctive short- and long-term mate preferences in women.Personality
Nesse, R. M. (2005). Natural selection and the regulation of defenses: A signal detection analysis of the smoke detector principle. Evolution and Human
Behavior,26, 88–105. doi:10.1016/j.evolhumbehav.2004.08.002.
Peer, E., Brandimarte, L., Samat, S., & Acquisti, A. (2017). Beyond the Turk: Alternative platforms for crowdsourcing behavioral research. Journal of
Ex-perimental Social Psychology,70, 153–163. doi:10.1016/j.jesp.2017.01.006.
Penke, L., & Asendorpf, J. B. (2008). Beyond global sociosexual orientations: A more differentiated look at sociosexuality and its effects on courtship and romantic relationships. Journal of Personality and Social Psychology, 95, 1113–1135. doi:10.1037/0022-3514.95.5.1113.
Pillsworth, E. G., & Haselton, M. G. (2006). Male sexual attractive-ness predicts differential ovulatory shifts in female extra-pair attraction and male mate retention. Evolution and Human Behavior, 27, 247–258. doi:10.1016/j.evolhumbehav.2005.10.002.
Regan, P. C., Levin, L., Sprecher, S., Christopher, F. S., & Gate, R. (2000). Partner preferences: What characteristics do men and women desire in their short-term sexual and long-term romantic partners? Journal of Psychology
& Human Sexuality,12, 1–21.
Roos, P., Gelfand, M., Nau, D., Lun, J., Morris, M., Hong, Y.-Y., & Chiu, C.-Y. (2015). Societal threat and cultural variation in the strength of social norms: An evolutionary basis.Organizational Behavior and Human Decision
Processes,129, 14–23. doi:10.1016/j.obhdp.2015.01.003.
Saroglou, V., Delpierre, V., & Dernelle, R. (2004). Values and religiosity: A meta-analysis of studies using Schwartz’s model. Personality and Individual
Differences,37, 721–734. doi:10.1016/j.paid.2003.10.005.
Schaller, M., & Murray, D. R. (2008). Pathogens, personality, and culture: Dis-ease prevalence predicts worldwide variability in sociosexuality, extraversion, and openness to experience. Journal of Personality and Social Psychology,
95, 212–221. doi:10.1037/0022-3514.95.1.212.
Schaller, M., & Park, J. H. (2011). The behavioral immune system (and why it matters). Current Directions in Psychological Science, 20, 99–103. doi:10.1177/0963721411402596.
Schmitt, D. P. (2002). Are sexual promiscuity and relationship infidelity linked to different personality traits across cultures? Findings from the International Sexuality Description Project. Online Readings in Psychology and Culture,
4, 1–22. doi:10.9707/2307-0919.1041.
Schmitt, D. P. (2005). Sociosexuality from Argentina to Zimbabwe: A 48-nation study of sex, culture, and strategies of human mating. Behavioral and Brain